
Originally published in 2018, now updated to reflect the latest Map Viewer user interface.
Because I am a geographer who makes a lot of thematic maps, over time I’ve noticed the key moments in the decision making process that dramatically influence each map. The purpose of this blog is to discuss how a typical thematic map of a percentage comes into focus and how you give it purpose.
To start, we need data, and an idea of what we want to map. We recently hosted up this layer of U.S. county health rankings data from the Robert Wood Johnson Foundation and University of Wisconsin Health Institute and made a few maps for policy making from it. The layer contains dozens of useful measures, each waiting to be turned into useful information in a thematic map.
The software can map it, but it takes a human to make it meaningful. In this blog we’ll cover how the software (in this case, ArcGIS Online) starts the thematic map, and how a human improves what the software suggests to give the map purpose.
Choose a topic
Let’s pick just one subject among the many attributes in this gold mine of data: Percent Low Birth Weight. It represents the percentage of all births in a county that meet the standard of low birth weight. So we have data.
We need an idea for the map. It is easy to imagine a choropleth map of the counties, each colored by its Low Birth Weight percent. Pretty straightforward.
As always, let’s explore the data on the map first, to compare what we know about the subject to what’s on the map, and then make a thematic map of it.
That first step (exploring the data) is key – unfortunately a lot of people simply want to get the thematic map done as quickly as possible without thinking critically about the data. They choose a default classification technique, verify that the map shows some variation in colors, and call it a day, when in reality that map is unfinished.
How can you tell a thematic map has been rushed into use without a specific purpose?
1) Default colors, default outlines, default classification settings
2) The breaks used to set the colors have no intrinsic meaning – they are the numbers generated by a classification algorithm.
3) The colors have not been chosen to emphasize the interesting part of the data.
4) The legend contains unnecessary levels of precision
Open this web map which uses layers found in ArcGIS Living Atlas, and click on the “Layers” button in the top left to see the list of layers available. Turn off the layer “Low Birth Weight % – Above and Below theme (recommended)” and turn on the layer at the bottom of the list titled “County Health Rankings 2018.”

Click the three dots to the right of the layer name “County Health Rankings 2018” and choose the “Rename” option. Rename the layer to “Low Birth Weight.” Next, click on the layer to select it, and then click on “Styles” in the top right of the user interface and choose the “Change Style” button on the layer to explore the Percent Low Birth Weight attribute.

Next, click the “+ Field” button and search for the attribute “Percent Low Birthweight.” Click the checkmark next to it and hit “Add” to see it on the map. Map Viewer evaluates the field you chose, and makes a suggestion for what map style to use. In this case, Map Viewer sees that the attribute is a rate or percent so it suggests the Counts and Amounts (Color) style of map. This style shades applies a color to each county, based on the value found in the “Percent Low Birthweight” attribute for that county.
\" style is meant for use with a numeric attribute that represents a percent, rate, index or other normalized value, and shades each feature based its attribute value.")
Click “Theme” to explore this data a bit using some settings that decide how the data will be shaded.
High to Low theme
This is where ArcGIS Online saves you time and makes you a better mapmaker by encapsulating good mapping techniques as “themes” within each map style. So far, all you did was touch an attribute, and the map lights up with a suggested “High to Low” theme using a very light blue to dark blue color ramp.
Click “Style options” to see the histogram of the data. Understanding the histogram in relation to the colors applied to the data is how you take control of which story this map is going to tell.

ArcGIS Online shows you the color ramp next to a histogram of the data. For the “High to Low” theme, the little handles on the left side of the histogram indicate at what values dark blue or light blue are applied. In this case, counties with 10% low birth weight or higher are given a full dark blue color. Counties with 6.1% or lower are given a very light blue color. These extreme values are not the main story in this map style.
Values between 10.0 and 6.1 are shaded a color somewhere between dark blue and very light blue, depending on where the attribute values fall. Sometimes referred to as “unclassed” or “continuous” color, it’s value is that you get an overall pattern on the map, and you can see how neighboring counties vary relative to one another. You can see the variation in the data because this style emphasizes variation between the two handles (10 and 6.1 in this example).
Where did these values come from? They are 1 standard deviation above the mean (10.0) and below the mean (6.1). Looking at the legend or the histogram, you can see that the mean is 8.1 for this data set. (Note: this is the average of the data, not necessarily the true national average, because counties vary widely in population from hundreds to millions.)
At this point, I always go search the documentation or online for what the literature has to say about this subject. In this case, the source data did not provide the national average for percent low birth weight, but a broader search found several indications that 8.1% happens to be the national average for this topic. This is useful information to have as you think about how to style this map.
This default is just a starting point, it is NOT the one-size-fits-all solution for making maps. It is a useful map style for initial exploration of the data, so that you can ask yourself: “What part of this data is interesting?”
From the histogram of the data we see a pretty normal bell curve, with a little skew toward higher values.

A color ramp that has only one color biases the eye toward only the high values in the data. The darker colors are applied to the higher values, but even the middle of the color ramp (near the 8.1% national average) is already leaning blue… so if the story needs to focus mainly on areas where Low Birth Weights are happening at unusually high rates, the High to Low theme is a good option. Those counties who are doing well on this topic are deemphasized in a High to Low theme when a color ramp that uses only one color is used (e.g. all shades of blue).
High to Low theme does not really care about a national average or mean, unless you adjust a break to use such a figure.
Let’s explore the same data using classification, to see where it starts the map.
Natural Breaks
Here’s the same layer, but with “Classify Data” turned on, which defaults to a Natural Breaks method. The darkest color is assigned to values at or above 11.3 so compared to the Unclassed approach above, in this style it is “harder” for a county to earn that darkest color. The values between 8.79 and 11.3 all get the same color, as do all values between 6.93 to 8.79 and all values below 6.93.

These breaks are where the Natural Breaks algorithm found a mathematical reason to divide the data up into the four breaks it was told to use. There are now eight different numbers to interpret in this map’s legend (see above), and no explanation of their significance. We see a medium blue color begins at 11.3% – is this to be considered a “high” rate? It’s not the same dark blue as is found in the Unclassed color ramp.
In which shade of blue does the national average 8.1% fall into? Unless we adjust a break to use 8.1%, we can’t really speak to that figure effectively on the map. All this map says is that some places have it worse than others, but we have not provided a standard of comparison by which we would leverage the use of color.
The challenge with this style of map lies in the reality that the breaks have no real-world significance nor any direction relationship with the histogram. It is essentially a cookie-cutter applied over the top of the histogram.
Here is the same layer, but with 10 natural breaks. It’s essentially the same map, but now the legend is a little more challenging to read and interpret.

With 10 classes, the full color ramp is used again, and we can see more detail around those darkest blue counties. But if a legend with 8 numbers for an author to explain and a reader interpret is difficult, a legend with 20 numbers is far more difficult. In the legend above, can you find which class would contain the national average 8.1%, and then find a sample county at or near that average? There are nine shades of blue to choose from, and this legend infers that you should be able to distinguish among them.
Whether your map has 4 classes or 10 classes or is not classified, the classified legend on a web map is often a poor way for someone to understand the actual value in any single county. Can a county be eligible for funding if they are at 14.39% or above? At this point, because we have not assigned any specific meaning to the classes such as “>14.39 (Eligible for funding)”, the legend is really there to simply orient the user about what color means, generally. Remember, we are making the maps to help connect a specific audience to a specific topic, so the pattern shown needs to relate to real world numbers found in the literature about a topic, current or proposed policies related to the topic, or other relatable numbers derived from comparisons to previous years or other measures.
A web map lets the user simply click on a feature to learn its value. A pop-up can provide the specific value as needed.
Equal Interval
Here’s the same layer, but with “Classify Data” turned on, and now using the Equal Interval method. The darkest color is now assigned to values at or above 21 so the effect is that it is very hard for a county to earn that darkest color. The values between 14.9 and 21 all get the same color, as do all values between 8.8 to 14.9 and all values below 8.8. All classification methods are heavily influenced by the min/max values in the data set, so it’s useful to recognize that when assessing how the software arrived at its class breaks.

The map now looks very “soft” and the histogram/color ramp tells why: most of the counties fall within the lowest category. To many people, this map would suggest low birth weights are not really much of a problem anywhere except that one northern Colorado county.
That’s because equal interval takes the maximum value minus the minimum value in the data, and divides that by the number of classes to set the interval. If the min value were 0, the breaks would shift. If the maximum were not 27 but 270, the breaks would shift, dramatically. Outlier values have a big effect on this option. Note that the national average 8.1% would fall into the lowest category.
Quantile
Here’s the same layer, but with “Classify Data” turned on, and now using the Quantile method. Quantile ensures that each color has an equal number of features in it where possible. If you have 1000 features, Quantile stuffs 250 features into each of the four colors in your ramp. Each class has the same number of features no matter what is actually going on with the data. Your map can have two features in two different classes with exactly the same percent low birthweight. The darkest color is now assigned to values at or above 9.08, the values between 7.8 and 9.08 all get the same color, as do all values between 6.7 to 7.8 and all values below 6.7. The national average 8.1% now earns the second darkest blue. Quantile ensures you’ll have lots of colors on the map, but they’ll have no intrinsic meaning for this layer.

Standard Deviation
Here’s the same layer, but with “Classify Data” turned on, and now using the Standard Deviation method. The colors are “anchored” around the mean of the data (0 Std. Dev.). The darkest colors are now assigned to values above the mean based on which standard deviation class or range they fall in. This is a useful method when trying to get more fine-grained in understanding how quickly your data deviates from the mean on the map. But, the legend is mostly unintelligible to most people, because it no longer shows the actual percentages. Consider your audience before showing them a thematic map with this legend. You can hand-edit the label of each class, to say things like “>11.1% (Very High)” or perhaps “Very High (>11.1%).”

You can see from the image above that this standard deviation method slices the histogram neatly and applies a color ramp to those slices consistently. The “High to Low” style of color ramp spreads the blue color progressively across the classes. The map is mainly blue, because the center of the color ramp is itself a medium blue.
When Should You Classify?
It’s pretty interesting to see how the various methods dramatically shift the color around the map. If it makes you feel a little uncomfortable that there are so many options with widely varying effects, that’s good, because your next step is to take control of where and when color is applied to the map, based on your purpose.
Every map needs a purpose, and you can’t get to purpose without exploring the data first. No matter how many methods are available to slice and dice the data into various colors, at some point each map author (or, manager of people making maps) needs to put meaningful numbers into the map legend: numbers they can explain, talk to and justify.
In a classified style, does it matter that a county with a value of 15 is colored the same as a county with a value of 20.9 – in effect saying there is no difference between those two counties? It may, or it may not – we classify things like body temperature into:
- < 98 Fahrenheit (cold)
- 98 to 99 (normal, since 98.6 is regarded as normal and you can’t get out of school with a 98.7 — I once argued that unsuccessfully)
- > 99 to 103 (fever)
- > 103 (high fever)
In the example above, is it useful to detect a person’s temperature rising from 99 to 101 to 102.9 ? Those three values are all in the same class, so if they were mapped, they would show no change in that classification method.
The person making the map is in a position to decide if classification is appropriate. It’s not a matter of one being right and another wrong, but it is a matter of knowing how classification tends to eliminate detail, and whether detail is important to the story your map needs to reveal.


All the maps above take one color (in shades of blue) and, in effect, smear them across the page based on the breaks you accept or, preferably, set from your knowledge of the subject. When four or five or ten classes let you simplify the world for someone based on a reason they can relate to, then classify! If you can assert why there is no significant difference among features within a given class, that is a reason for that class to exist – it has a meaning, so its use is justified.
Otherwise, give the data a chance to “breathe” a bit and turn off that “Classify data” option to let the additional detail drive interest and generate additional questions. Questions raised during the early stages of making a thematic map inevitably lead to better maps.
An example: when a lawmaker proposes a bill to provide economic development funds to any county where unemployment is 8% or higher, you have a reason to classify the map into 2 worlds: counties with 8% or higher unemployment, and everybody else. But you would be wise to show the lawmaker, or the public, a map without classification so that it becomes obvious how many counties are just above or just below that 8% cutoff. If nothing else, that map tells you where the lawsuits could be filed based on the 8.0% cutoff. Both maps are useful.
Next, let’s introduce a little more color using a very powerful map style that lets you transfer your knowledge of a subject into a map people can instantly relate to.
Above and Below theme
Go back to your layer and turn off classification. The map returns to an unclassed view of the data with all the variation showing.
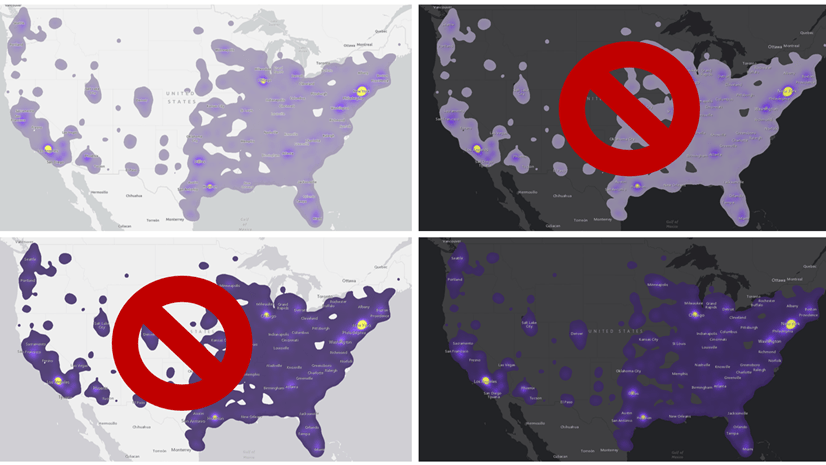
Next, change the theme from “High to Low” to “Above and Below” theme and watch what happens. The map immediately divides the data into two colors: areas whose percent low birth weight is above 8.1%, and areas below that national average. Areas in blue have a higher rate of low birthweights, and areas in red have a lower rate of low birthweights.
.")
In the example above, make one additional change, to use a green to purple color ramp so that the map highlights in purple those counties with above-average problems with low birth weights. This diverging color ramp has three colors: purple on one end, white in the middle, and green on the other end. Counties near the national average sort of fade into the background, an editorial choice which is what allows the above and below patterns to emerge.


By the way, it takes fewer than 10 clicks create this map in Map Viewer. We took the long route in this blog to get to this point, but I would estimate that 90% of my thematic maps start out using the Above and Below theme, because it forces me to think about what a meaningful anchor point would be for those diverging colors.
Every great map is the result of choices made on what to emphasize and what to de-emphasize or even omit. Most maps that people tell me need some help are the result of not choosing to emphasize what’s interesting in the data or to de-emphasize what is not important.
Think of your map like it’s your resume: not everything is equally important. There is a sense of priority in your resume. In fact, taking an editorial stance is crucial if you want your resume to get its point across. The same is true of every thematic map.
If I were building an atlas or story map of each county health ranking attribute, I probably would stick to this divering purple-to-green color ramp, so that the “language” of my maps is consistent: green is good, purple is not good.
As before, while the default option for “Above and Below” is recommended, let’s go through other options for the initial map you make.
Above and Below – Natural Breaks
Here’s the same layer, but with “Classify data” turned on, which defaults to a Natural Breaks method. To reproduce this map, start from the “Above and Below” theme shown above, and turn on “Classify data.”
The darkest color is assigned to values at or above 11.2 so the effect is that it is “harder” for a county to earn that dark purple color. The values between 8.78 and 11.2 all get the same color of light purple, and all values between 6.9 to 8.78 and all values below 6.9 get incrementally stronger shades of green.
If a proposed policy would send additional funds to counties that have 11.2% low birth weights or higher, then this map does a good job highlighting those dark purple counties. But it does a poor job showing which counties are at 11.1% (just below your funding cutoff).

It is interesting how the additional classes add detail in the map below. Map Viewer is automatically adjusting the county outlines’ width, such that at this scale, the boundaries are very thin. The grey 75% transparent boundaries help allow the color to “flow” across county lines. For a fun comparison, set the county boundaries to black 0% transparent to see how overly strong outlines destroy color patterns. We are not here to map outlines. We are here to map the patterns in the attribute being mapped.

Above and Below – Equal Interval
Here’s the same layer, but with “Classify Data” turned on, and now using the Equal Interval method. The dark purple color is now assigned to values at or above 21 so the effect is that it is very hard for a county to earn that darkest color. The values between 14.9 and 21 all get the same light purple color, while values between 8.8 to 14.9 and all values below 8.8 get incrementally darker greens. This map’s colors are saying “something important changes at 14.9%” – remember that the national average is 8.1%.

Above and Below – Quantile
Here’s the same layer, but with “Classify Data” turned on, and now using the Quantile method. Quantile ensures that each color has an equal number of features in it where possible. If you have 1000 features, Quantile stuffs 250 features into each of the four colors in your ramp. The darkest purple color is now assigned to values at or above 9.08, the values between 7.8 and 9.08 all get the same light purple color, and values between 6.7 to 7.8 and all values below 6.7 get incrementally darker greens. The colors in this map say something changes at 7.8%. Quantile ensures you’ll have lots of colors on the map, but they’ll have no intrinsic meaning for this layer.

Above and Below – Standard Deviation
Here’s the same layer, but with “Classify Data” turned on, and now using the Standard Deviation method. The darkest purple color is now assigned to values at or above 11.1% and other breaks are introduced in 1 standard deviation intervals. This is a useful method when trying to get more fine-grained in understanding how quickly your data deviates from the mean on the map.

I do love the fact that values around the mean have very soft purple or green shades, hinting that they are very close to the mean. But that soft color extends all the way to 1.5 standard deviations from the mean, which is a LOT of data getting those soft colors in a map that is supposed to call out the unusual. Change to ½ standard deviations to darken up the extremes. The legend is mostly unintelligible to most people, because it no longer shows the actual percentages. Consider your audience before showing them a thematic map with this legend.
Recommendations
There are occasions when classification makes sense as a final deliverable: when the breaks have real-world meaning and the classes have names or explanations (e.g. “Slightly above normal” or “Extremely high.” Most of the time, however, classification inhibits understanding and discourages data exploration. One way to know which is right for a given map, project, atlas or customer is to make a few versions and show them to the intended audience. Ask them what the map tells them, without coaching them, and compare their answers to what you hoped they would learn from each map. As you can see from all the above, trying each style is a few mouse click’s effort in Map Viewer in ArcGIS Online and ArcGIS Enterprise.
I recommend always starting with the “Above and Below” map style in ArcGIS Online for any thematic map of a percent, rate, ratio, index or similar data. It does not classify the data but lets the data “breathe” within an upper break and a lower break that define where “high” and “low” are for your subject. The software treats as exceptional those values beyond 1 standard deviation from the mean of the data. As with classification, your job is to confirm those particular values or provide your own, based on your knowledge of the subject, or your review of the literature on it, or your interviews with subject matter experts.
The reward of applying such values to your map’s settings is that you then have the right to say “The green areas on the map have lower than normal rates, while the purple areas have higher than normal. In this case, normal means 8.1% which is the national average.” If your map needs to highlight how counties are faring against a different norm, such as a stated goal to get the national rate down to 7.0%, you merely recenter the map’s legend around that norm to give meaning to green and purple areas.
Smart defaults are not a replacement for a human, but they certainly help you tune your map and give it a specific purpose. People who begin to understand the data, its histogram, and how color is applied or spread across that range of data begin to see how their choices reveal, or bury, what’s interesting. Thanks for reading!

Article Discussion: