*Written by Ellen van den Berg, Esri Netherlands
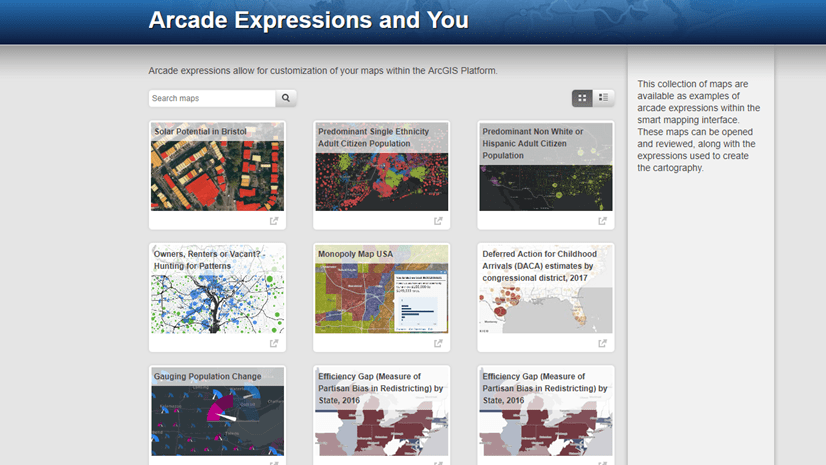
Arcade expressions allow a wide array of on-the-fly customization for your maps. Arcade can be used across the ArcGIS platform, including in ArcGIS Online. You can use these expressions to create new values to be shown in your ArcGIS Online pop-ups, but they can also be used within the HTML code for further customization. This is the strategy we used in one of our more recent content services containing location markers in the Netherlands. In this blog, we will describe how we did this.
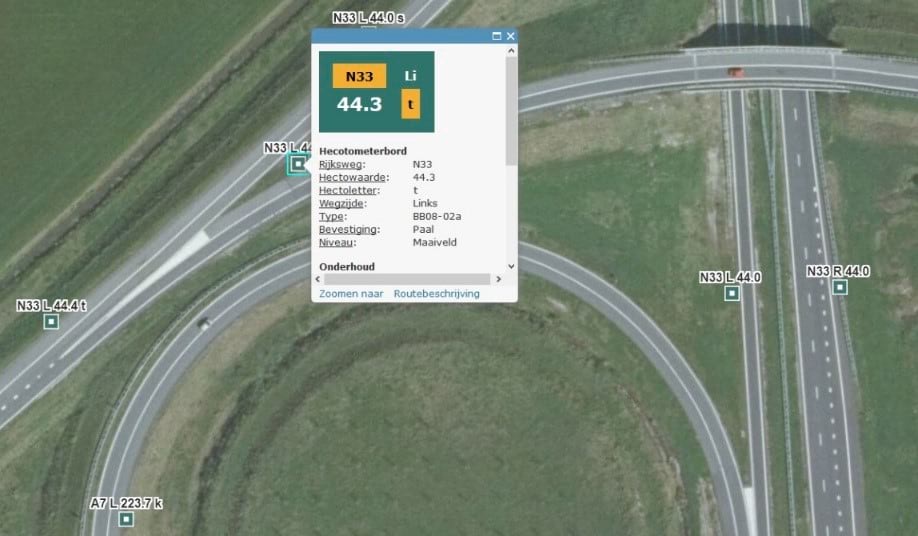
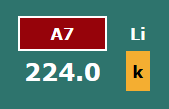
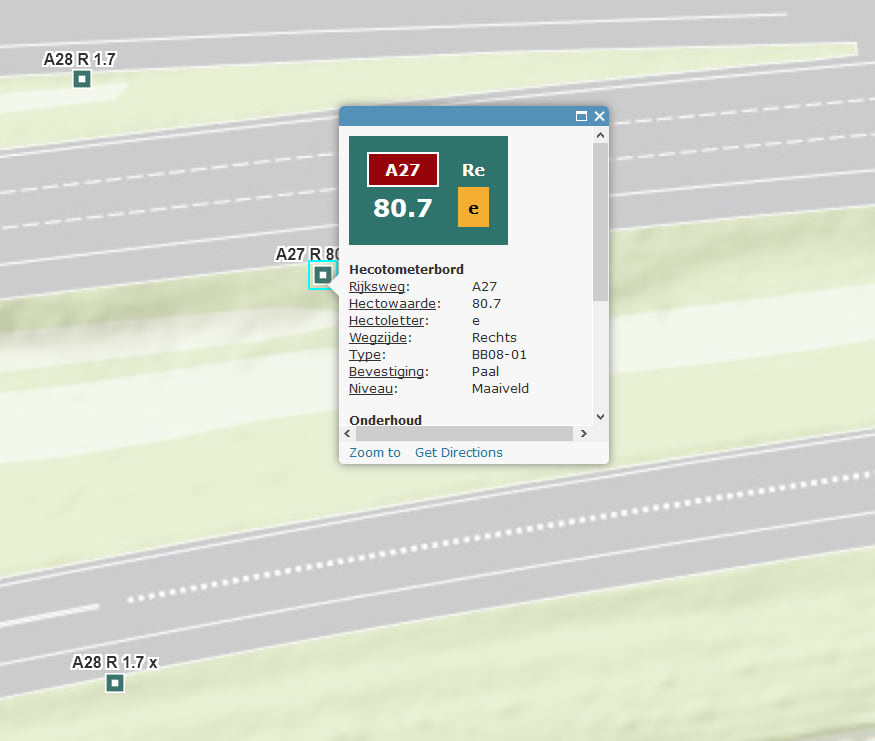
Imagine you are on a road trip and in the middle of the road your car breaks down. How are you going to describe where you are? In the Netherlands, location markers are placed along the highways to allow you to indicate your location. The markers have a specific look that everyone in the Netherlands will recognize. An example is shown in the image below.
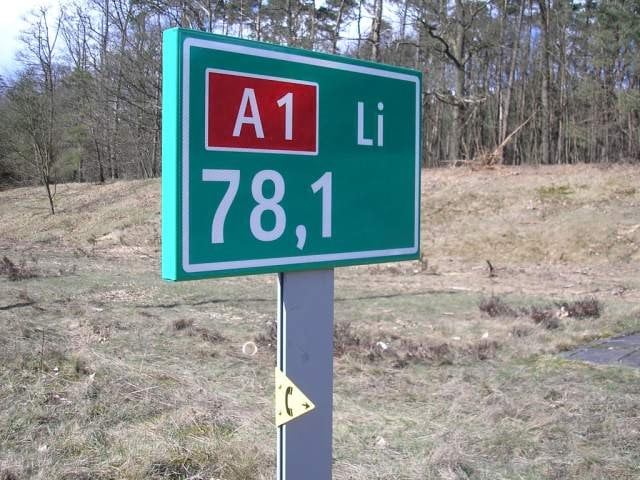
Each corner of the location marker describes information about the location. The following information can be found on the marker:
- The number of the road
- The side of the road, either Left (Li) or Right (Re)
- The distance from the beginning of the road
- The designation of the lane, for example an exit
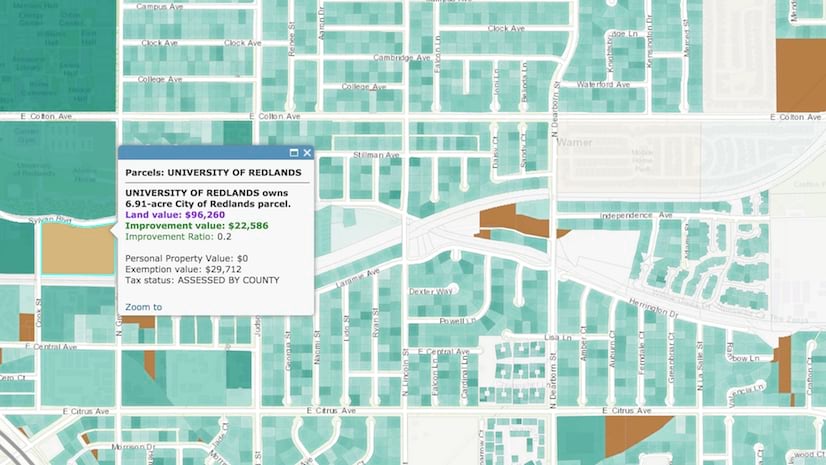
In ArcGIS Online we can perfectly describe this information in the pop-up. However, it would be nice to show this information in a familiar way in the form of this sign.
HTML Source code
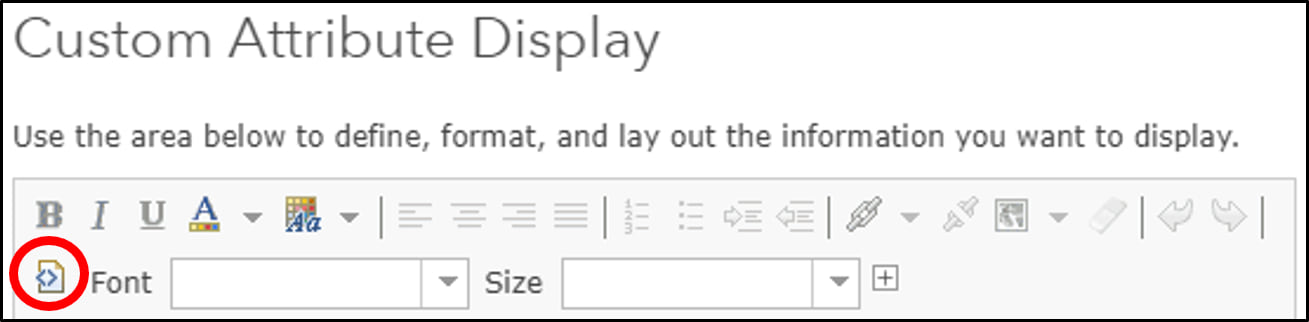
In order to create our customized pop-up, we opened the feature service with the location markers in the ArcGIS Online Map Viewer. By right-clicking on the layer, we were able to go to the “Configure Pop-up” screen. For the Pop-up Contents Display we chose “A custom attribute display” and clicked “Configure” to enable the display in which we were able to type our own text. There is also the option to view the HTML Source which can enabled by the following button:
Creating a table
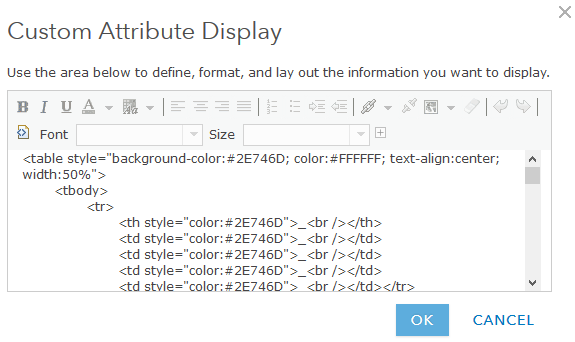
The information that will be displayed in the pop-up is present in several fields of the data. In order to put this information in the marker, we chose to create a table to structure the data in a way that looks similar to the real-world signs. We started with the most noticeable features of the location marker, namely the green background with white letters. These colors are indicated in the table row information as can be seen in the source code below. Furthermore, the marker is not as wide as the pop-up, that is why we indicated a width of 50%.
<table style=”background-color:#2E746D; color:#FFFFFF; text-align:center; width:50%”>
After this, we were able to start putting the information in the marker, but troubles arose…
Road numbers
The road number was present in our data in two fields, one containing the letter and one containing the number. We referred to these fields using curly brackets and placed them in the right cell of the table.
<td>{RoadLetter}{RoadNumber}</td>
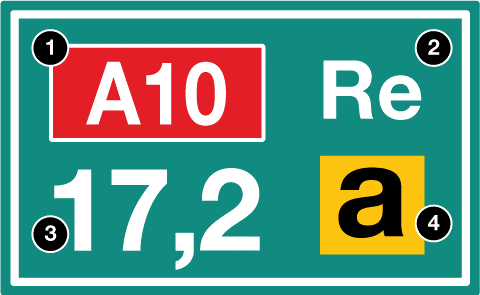
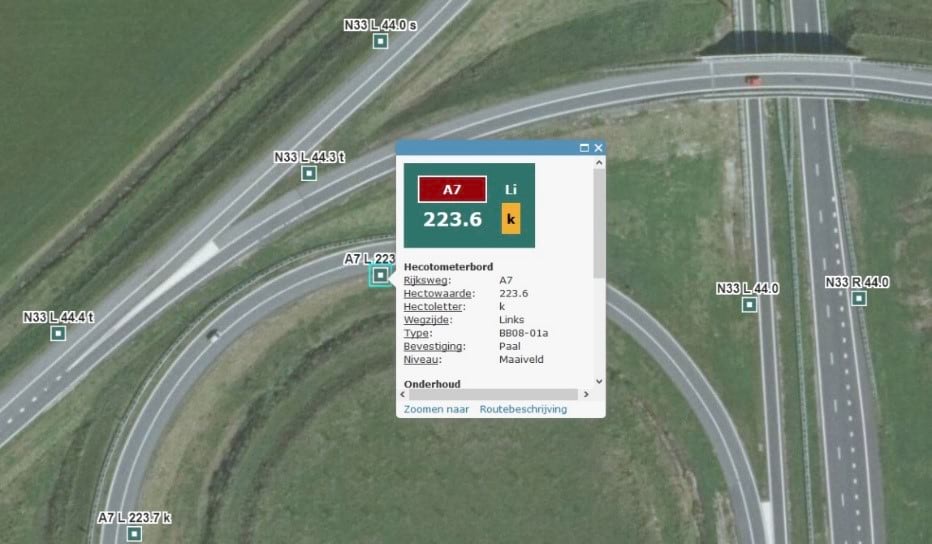
Unfortunately for us there was a catch: not all location markers are exactly the same! The location markers are placed along two types of roads: the “A-roads”, the highways, and the “N-roads”, the regional roads. The road numbers of highways on the markers have white letters, a red background and a white border. The regional roads require black letters a yellow background and no border.
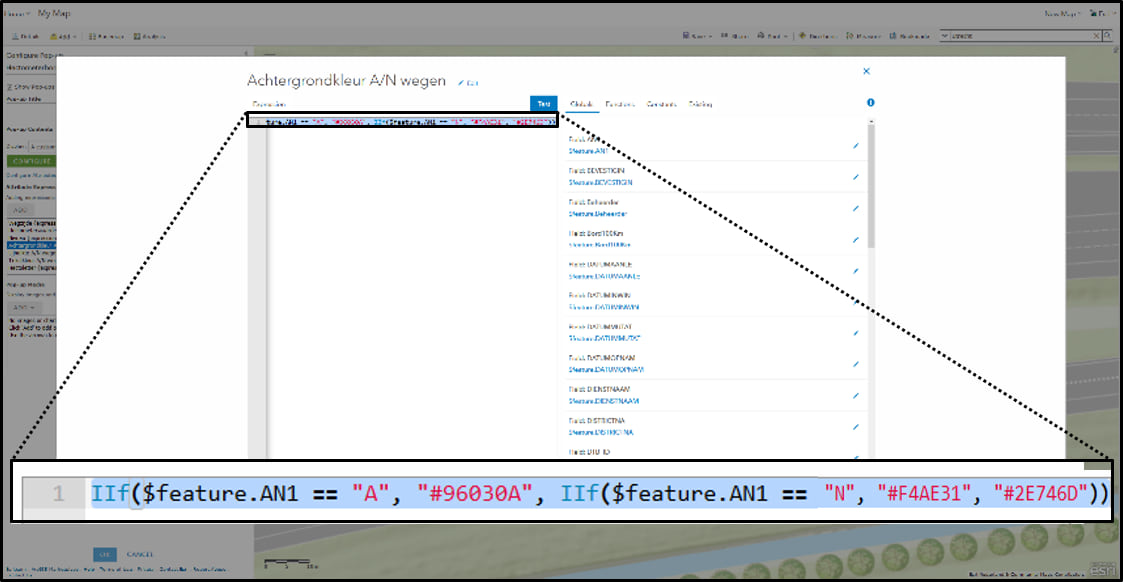
Since the information to which markers these characteristics should apply are present in a field, the RoadLetter field, we were able to solve this problem using Arcade. In the Arcade expression we indicated that the hexagon value for the background-color should be a certain value if the RoadLetter is “A” and another value if it’s “N”. If the RoadLetter is neither “A” nor “N”, we used the normal green background color, resulting in the following Arcade expression:
IIf($feature.RoadLetter == “A”, “#96030A”, IIf($feature. RoadLetter == “N”, “#F4AE31”, “#2E746D”))
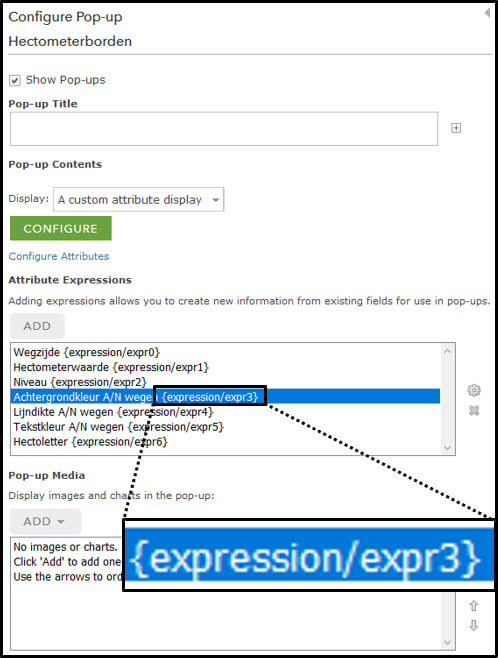
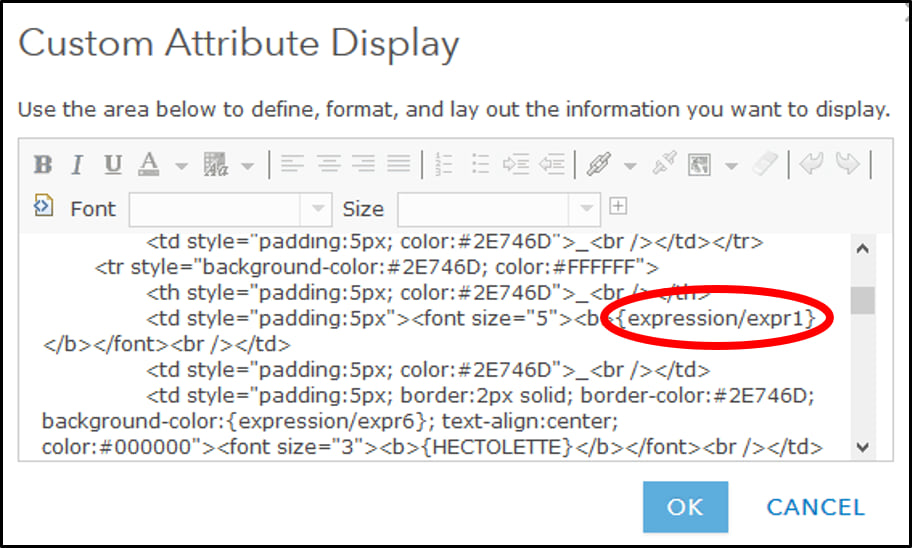
Similar expressions were made for the border color and text color, which resulted in many references to expressions in the HTML code.
<td style=” background-color:{expression/expr0}; border-color:{expression/expr1}; color:{expression/expr2}”>{RoadLetter}{RoadNumber}</td>
Side of the Road
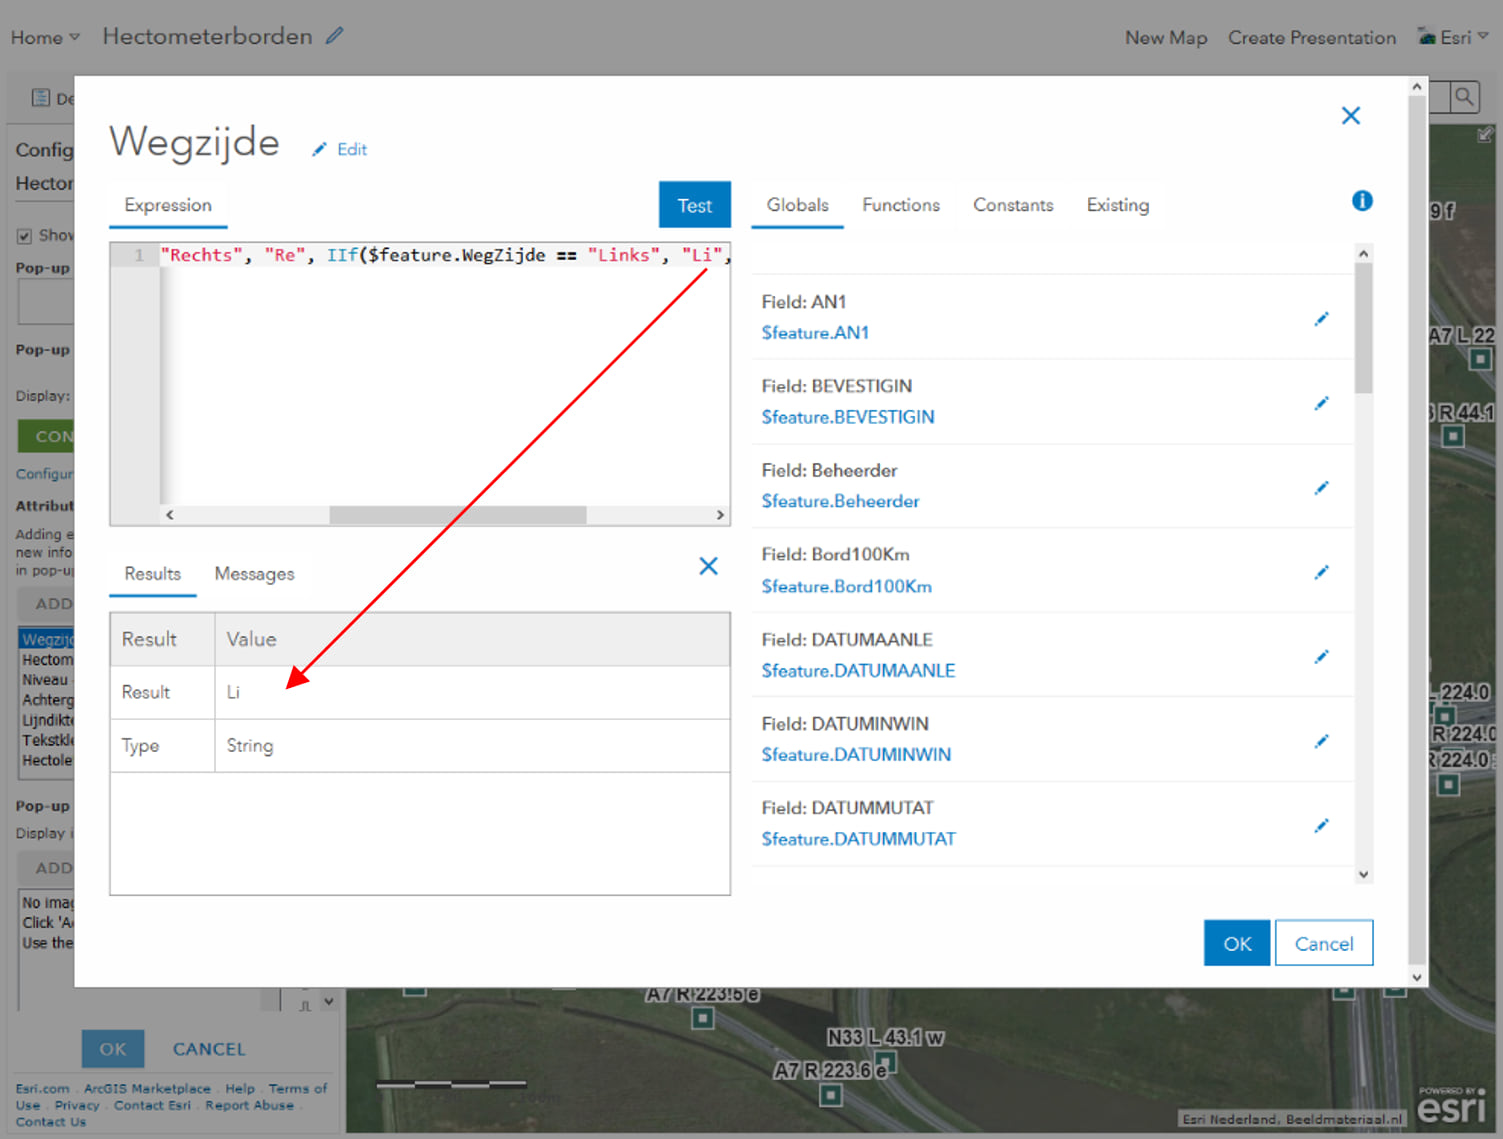
When we tackled the issue of indicating the road number on the sign properly, we moved on to the information showing the side of the road. In our data we were presented with the entire text, so either “Left” or “Right”, while only an abbreviation is used on the sign. Luckily we were also able to solve this problem using Arcade:
IIf($feature.RoadSide == “Rechts”, “Re”, IIf($feature.RoadSide == “Links”, “Li”, $feature.RoadSide))
On to the next corner of the marker!
Distance
The information for this part of the sign was almost completely present in the data, although there was a small challenge. The data included the distance from the beginning of the road using one decimal number, except for the distances with zero decimals. On the markers, however, these zeros are indicated as well. That is why an Arcade expression was used to find values that include a decimal number and add .0 to the ones that don’t have a decimal number in the data. This shows how easily numbers can be converted with basic text manipulation without needing to make changes in the data.
IIf(Mid($feature.Distance, Find(“.”, $feature.Distance), 1) == “.”, $feature. Distance, $feature.Distance + “.0”)
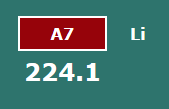
Lane designation
The last part of making up the marker included an indication for the lane designation, for example, if the road is an exit. This information is indicated with one letter on a yellow background with black letters. This extra letter is not always present and when it is not, you see the green background of the sign. We were able to show different layouts in a similar way as with the road numbers, using an Arcade expression. If there is no information in the field with the lane designation, the normal background is shown, otherwise, it should be yellow. The text color can be set to black anyway since it is not noticeable when there is no information.
IIf($feature.Letter == ” “, “#2E746D”, “#F4AE31”)
Finishing up
To finish up the pop-up, we added some more information that is not part of the sign, but can still be of interest to users. This includes information on how the marker is connected to the road and the type of marker for example. This information is presented in the form of a table without visible borders.
All in all, seven Arcade expressions were used and referenced in the HTML code of the pop-up. It is possible to view the full HTML code and Arcade expressions if you access the configuration settings for the pop-up within the location markers map. Hopefully, this blog has given you some ideas on how to increase the real-life experience of pop-ups using Arcade in HTML code. Please do share your own examples, I look forward to seeing them!
Note: For the purpose of this blog the field names were translated.


Do you ever see a pop-up, or details dashboard element ignore the styling if it uses an expression? I am having that trouble, whether it’s in a div style or a td style. I can type in a raw value and it works, but as soon as I replace like a position value with an expression, it just ignores it in the pop up (for either it displays it in the pop up builder, but not the actual popup from the map… so I know the expression is working).