Market opportunity maps show where demand for a product or service exceeds supply. They can help you find the best locations to start or expand your business. Using ArcGIS Online and demographic data from ArcGIS Living Atlas of the World, you can create your own market opportunity map. This article explains how.
Where are the best locations for opening new stores?
As a data analyst for a clothing retail company, you might consider this question. Perhaps you’re considering expanding your business into the Manhattan borough of New York City. One way to identify business opportunity is to look at current sales and potential sales, based on household spending, in the clothing industry. The higher the potential, the more opportunity, or demand, there could be for your company’s products.
Where can you find reliable data that compares retail sales and customer spending in your industry? And how can you visualize the data to see business opportunities?
Using ArcGIS Online Map Viewer and demographic data from ArcGIS Living Atlas of the World, you can create your own market opportunity map, allowing you to identify the best locations for your new stores. Here’s how you do it in 3 main steps.
Step 1: Find your location on a map
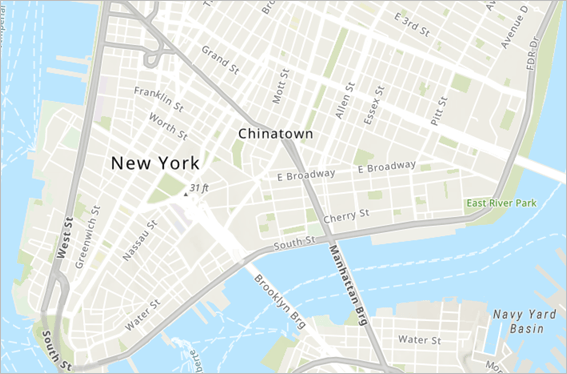
Begin by opening a new map of Manhattan in ArcGIS Online Map Viewer.
a. Sign in to ArcGIS Online with your ArcGIS account and click Map.

You’ll need privileges to use premium content to make the market opportunity map. If you don’t have these privileges, contact your administrator or join the Learn ArcGIS organization for a free 60-day membership.
b. In the map search box, type Manhattan, NY, USA and click the Search button (or choose from the suggested addresses).
c. Zoom out and pan the map until you can see most or all of the southern part of Manhattan Island.
Step 2: Add a Living Atlas layer
Next, you’ll add data related to clothing store supply and demand from ArcGIS Living Atlas of the World.
a. Click Add > Browse Living Atlas Layers.
b. In the search box, type 2018 USA Clothing Store Market Opportunity, press Enter, and add the layer to the map.
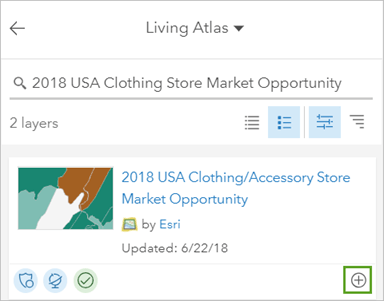
c. In the search window, click the Back arrow to return to the Contents pane.
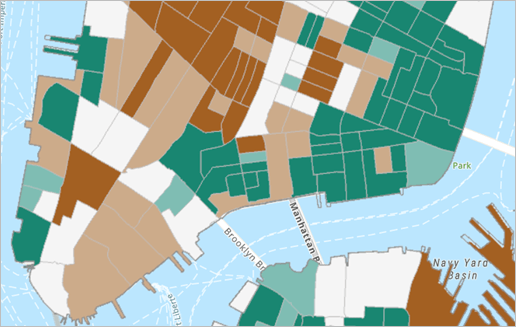
The layer you added has many features, symbolized as either brown or green. Green areas are places where the demand for clothing stores exceeds supply, while brown areas are places where supply exceeds demand.
You’re only interested in green areas where demand exceeds supply.
d. Click any green feature to open its pop-up and explore the data.
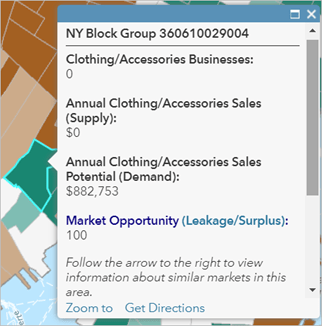
The pop-up shows the number of stores in the area, as well as total sales (supply) and sales potential (demand). Based on these numbers, each feature also has a market opportunity number, also known as a leakage/surplus factor, on a scale from 100 to -100. Positive numbers mean demand exceeds supply, while negative numbers indicate the opposite. A factor of 100 means there are no stores in the area, so demand exceeds supply by 100 percent.
Step 3: Filter the layer
You’ll create a filter to see where demand significantly exceeds supply – features that have a leakage/surplus factor of at least 20.
a. In the Contents pane, click the 2018 USA Clothing/Accessory Stores Market Opportunity layer to expand it.
b. Point to the Block Group category and click Filter.
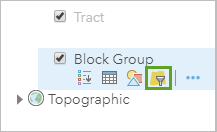
Tip: If block group is grayed out, zoom in to your map until the block group category is active (no longer grayed out).
c. In the filter, for the first box, choose 2017 Leakage/Surplus Factor: Clothing/Accessory Stores (NAICS 4431). For the second box, choose is at least. For the third box, type 20.

d. Click Apply Filter. Your map now displays only census blocks where demand significantly exceeds supply.
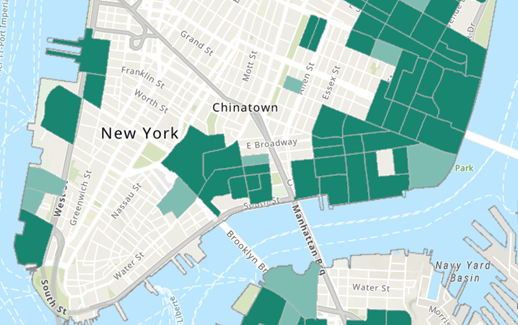
e. To help see the market opportunity data, change the basemap to Dark Gray Canvas.
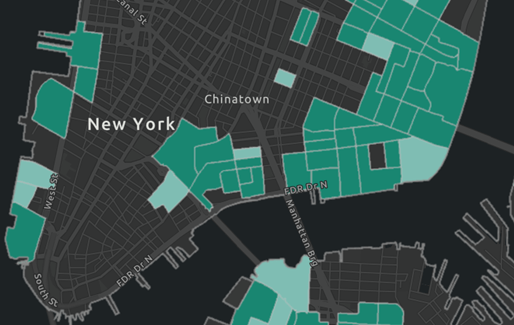
In 3 steps, you made a market opportunity map. You can use it to help find the best locations for your new stores.
Where are the best locations? You’ll want consider a variety of factors, including areas with high potential demand. Based on your map, the eastern part of Manhattan Island is a good area to explore.
Now that you’ve completed some basic data exploration, you may be interested in trying these related learning resources.


Article Discussion: