Animated maps are pretty awesome but they haven’t always been easy to make. For decades GIS focused on mapping where things were but struggled to show when. We continue to enhance time animation options in Map Viewer since we’ve long known animated maps quickly grab our attention and add a much-needed temporal depth to our depictions of the world. Adding time is important because many of the things we want to better understand in the real world play out over both space AND time. Put simply, the world is not static or frozen, so our maps shouldn’t be either.
Animated maps that show change in positions of objects (e.g., fleet vehicles), or the change in values at locations (e.g., decades of election results) are a powerful and intuitive way to visually process huge amounts of data at-a-glance. Humans are literally hardwired to see motion or changing shapes and colors. Tapping into those innate perceptual abilities is just good cartography.
With the November 2026 ArcGIS Online update, Map Viewer added several enhancements to the time configuration and animation experience. Read on to learn more about these enhancements and how they might improve your time workflows.
Redesigned compact & responsive time slider component
The most visually apparent enhancement is the update from the time slider widget to the new minimal time slider component.

It has a new compact, slim design to make it easier to read, more informative, and more responsive across apps and devices. You’ll also notice that the current map time or range is always displayed above the slider handles, providing a quick and clear indication of the time filter currently applied to the map.
Persistent Time Filtering
The new compact time slider has another quality-of-life improvement with this update: When the map reader temporarily hides/shows the time bar it will now remember where you are in the animation and how you’ve set your temporal filtering. Previously, hiding the time slider would remove all temporal filters. Hiding the time slider is useful since it can obscure parts of the map.
Look for the clock icon to show/hide the time slider in the lower left corner of the map. If needed, you can still temporarily disable time animation at the map level by opening the time slider, clicking Map time Options and turning off the Apply time filter toggle.
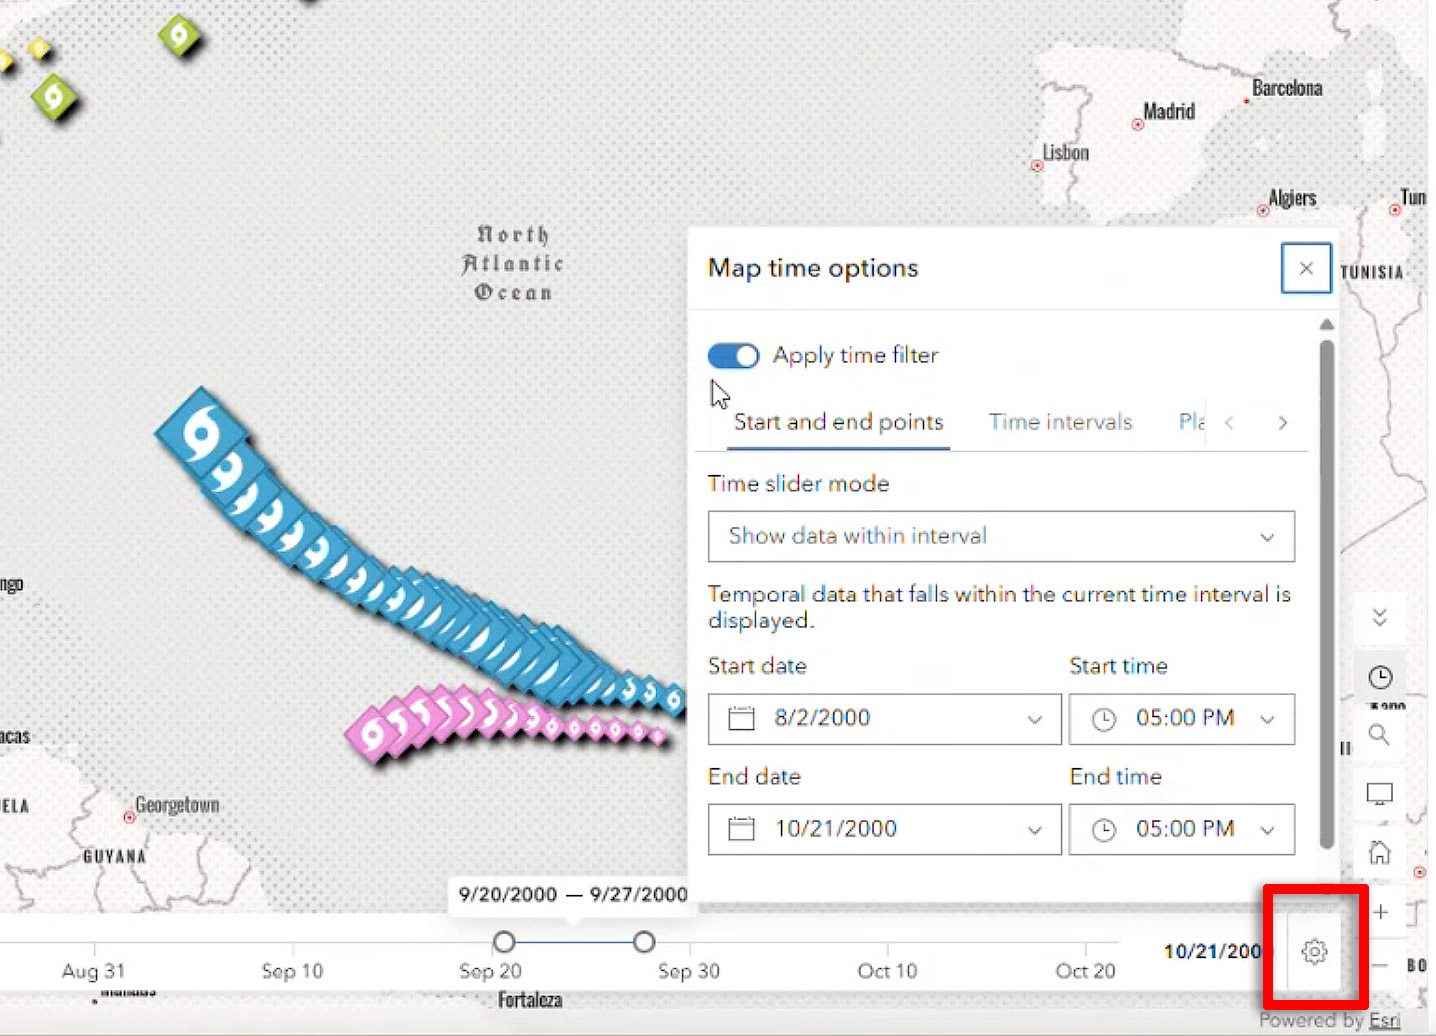
Share your time-enabled maps in new ways
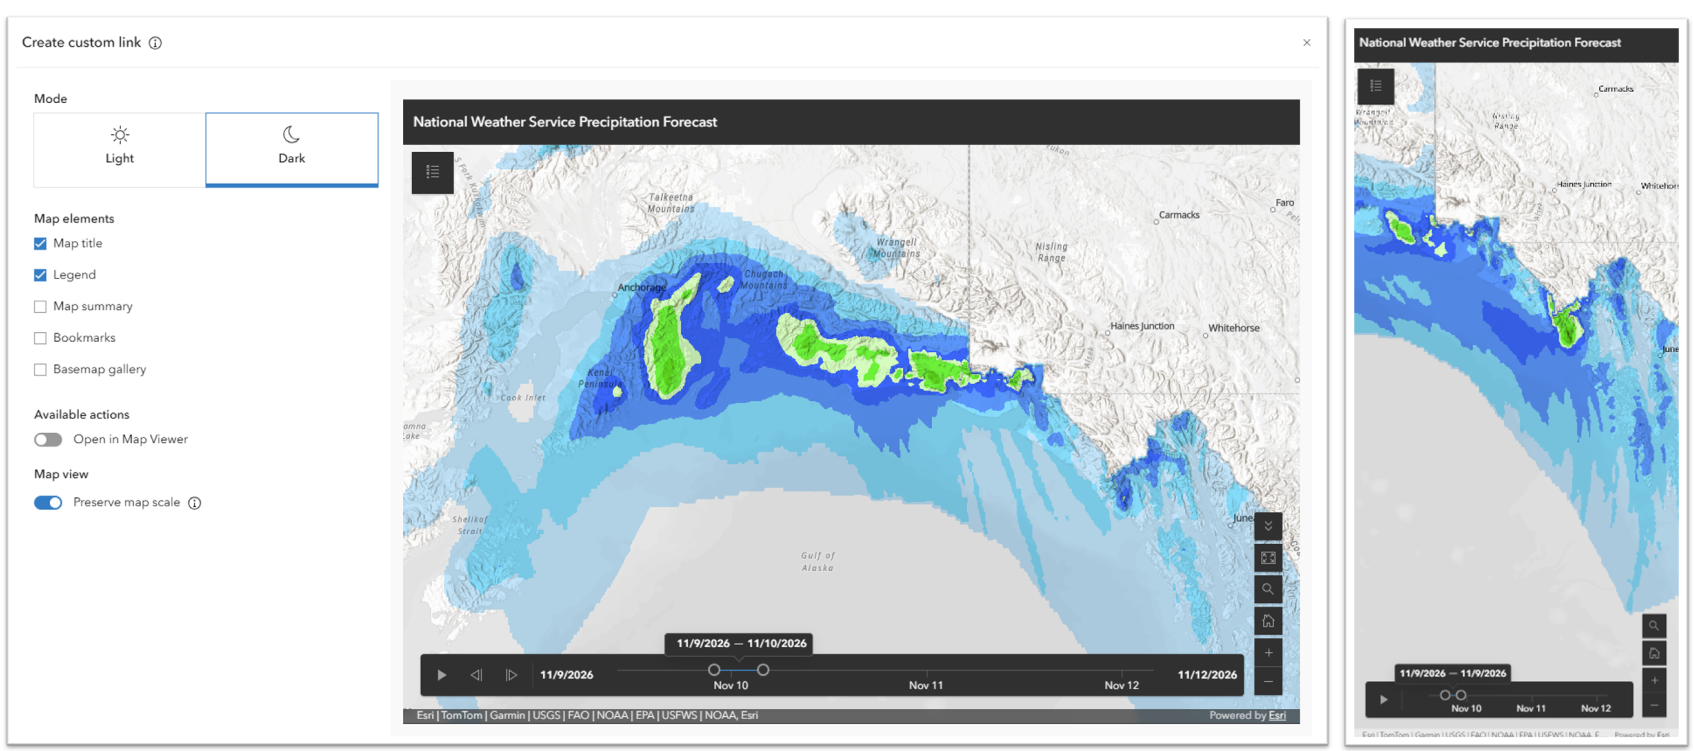
With the introduction of the new time slider component, Map Viewer has also added support for the time slider in its mobile and configurable views. If your web map is time-enabled, both the Embed map and Create custom link options will honor that configuration and display the time slider. Both take advantage of the responsiveness enhancements, ensuring the time information is well displayed on smaller screens. The mobile view of the Map Viewer application will also display the time slider.
Time-enable layers directly from Map Viewer
Another major enhancement with this release is the ability to enable time on any layer with a date field directly from Map Viewer.
Until now, only the original owner of a map layer could enable time on a layer with a date field in ArcGIS Online. With this update, anyone can now directly enable or disable time on layers with date fields. This works for feature layers, feature services, knowledge graph layers, GeoJSON, and CSV layers, with more support coming soon.
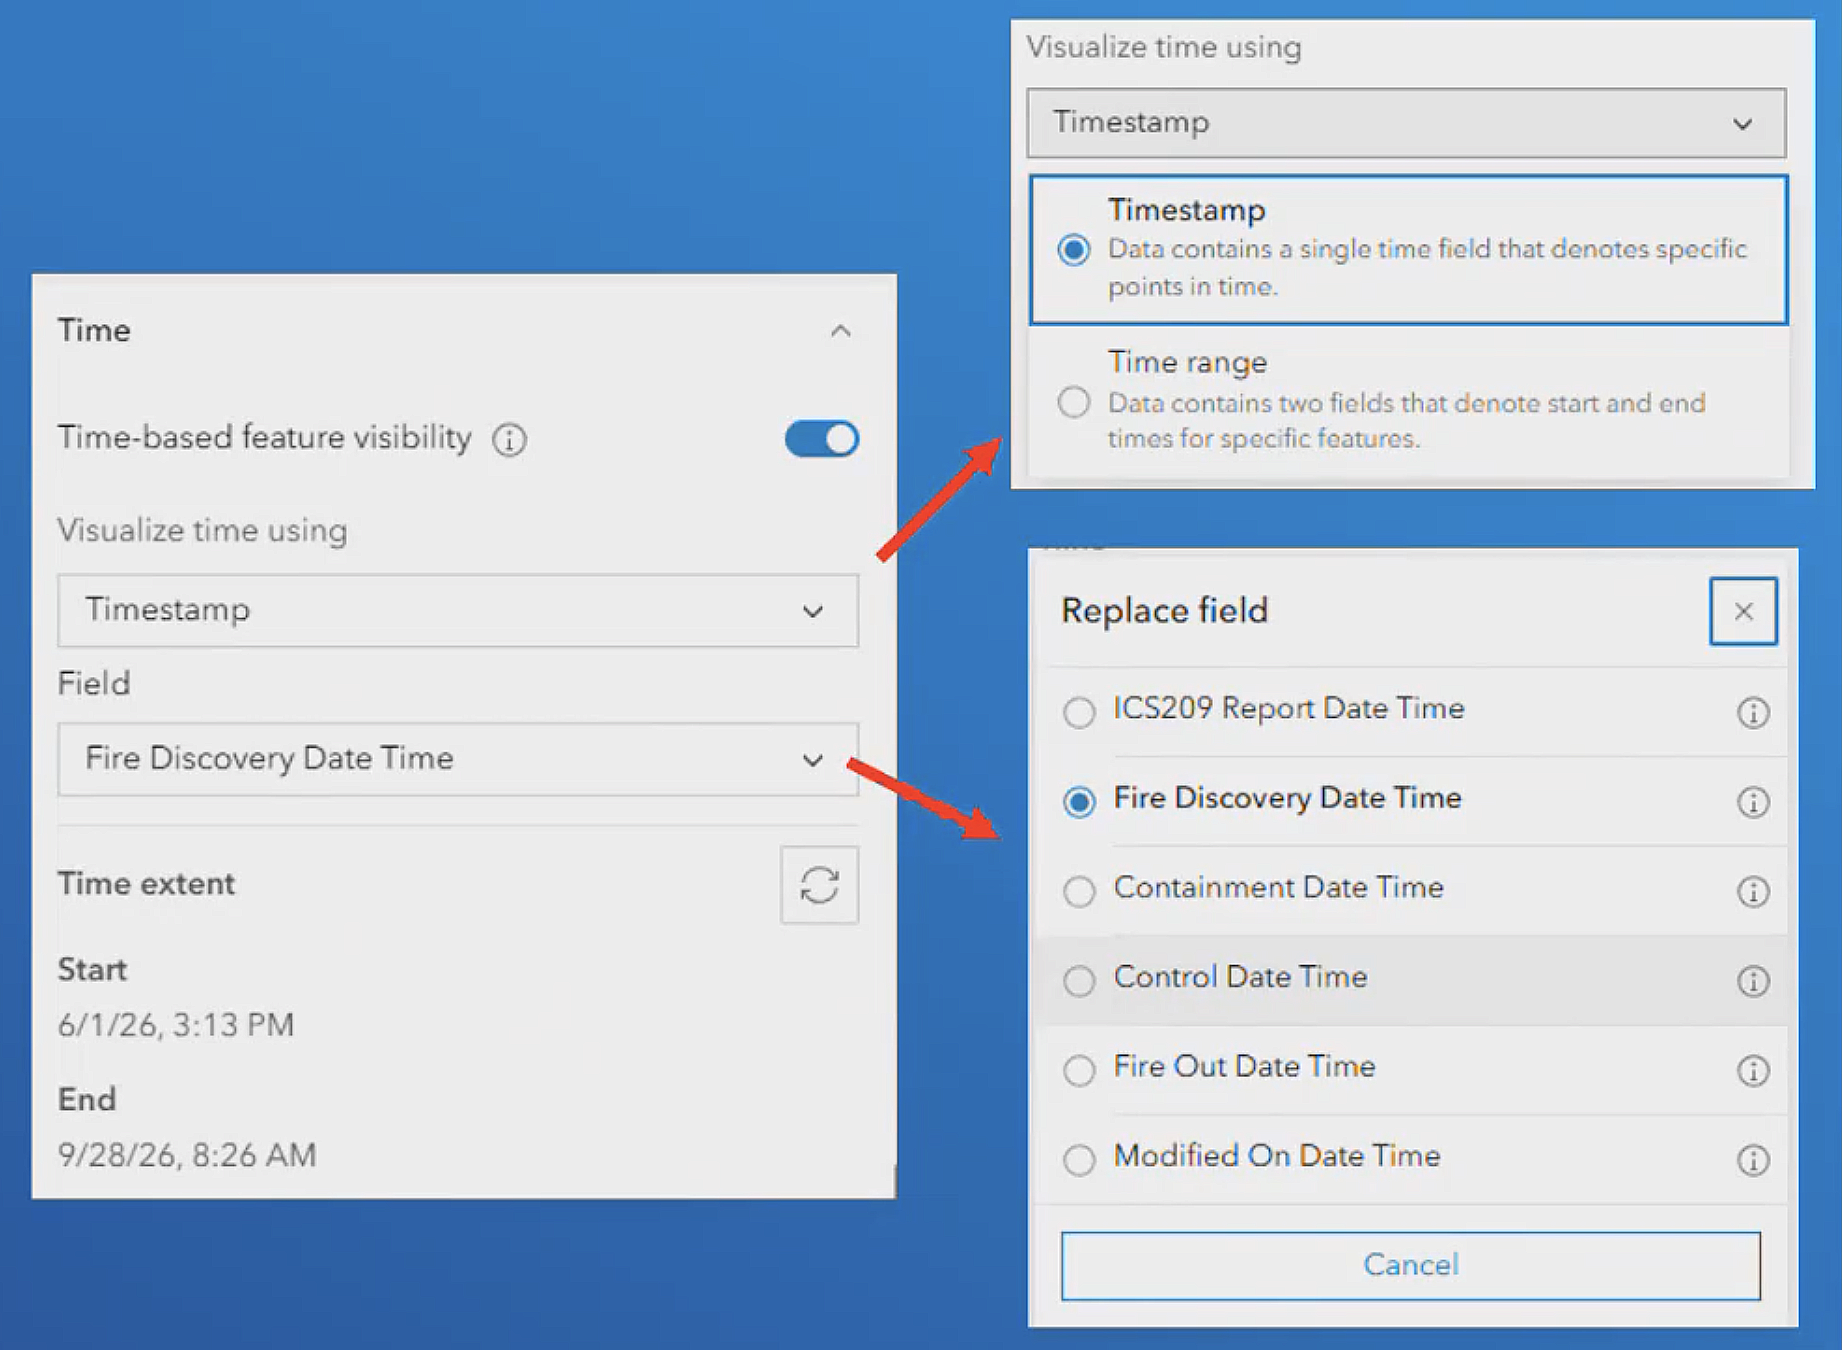
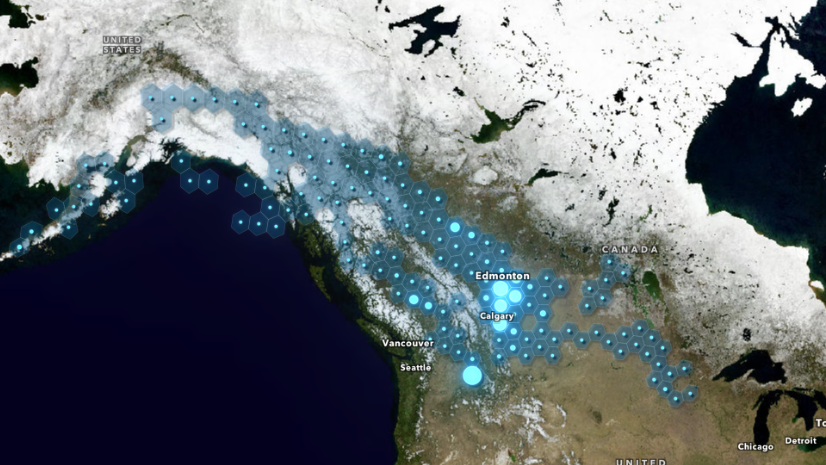
Even better, it can be configured directly from Map Viewer. Simply open the properties pane for your layer and, if it contains a date field, the the Time-based feature visibility option will be available. In the example below, the USA and Canada Current Wildfires layer from the Living Atlas was added to Map Viewer and was not time-enabled by default. It does however, contain multiple date fields. With this enhancement anyone can add this layer and then decide if they want to animate the incidents by date reported, start date, or containment date.
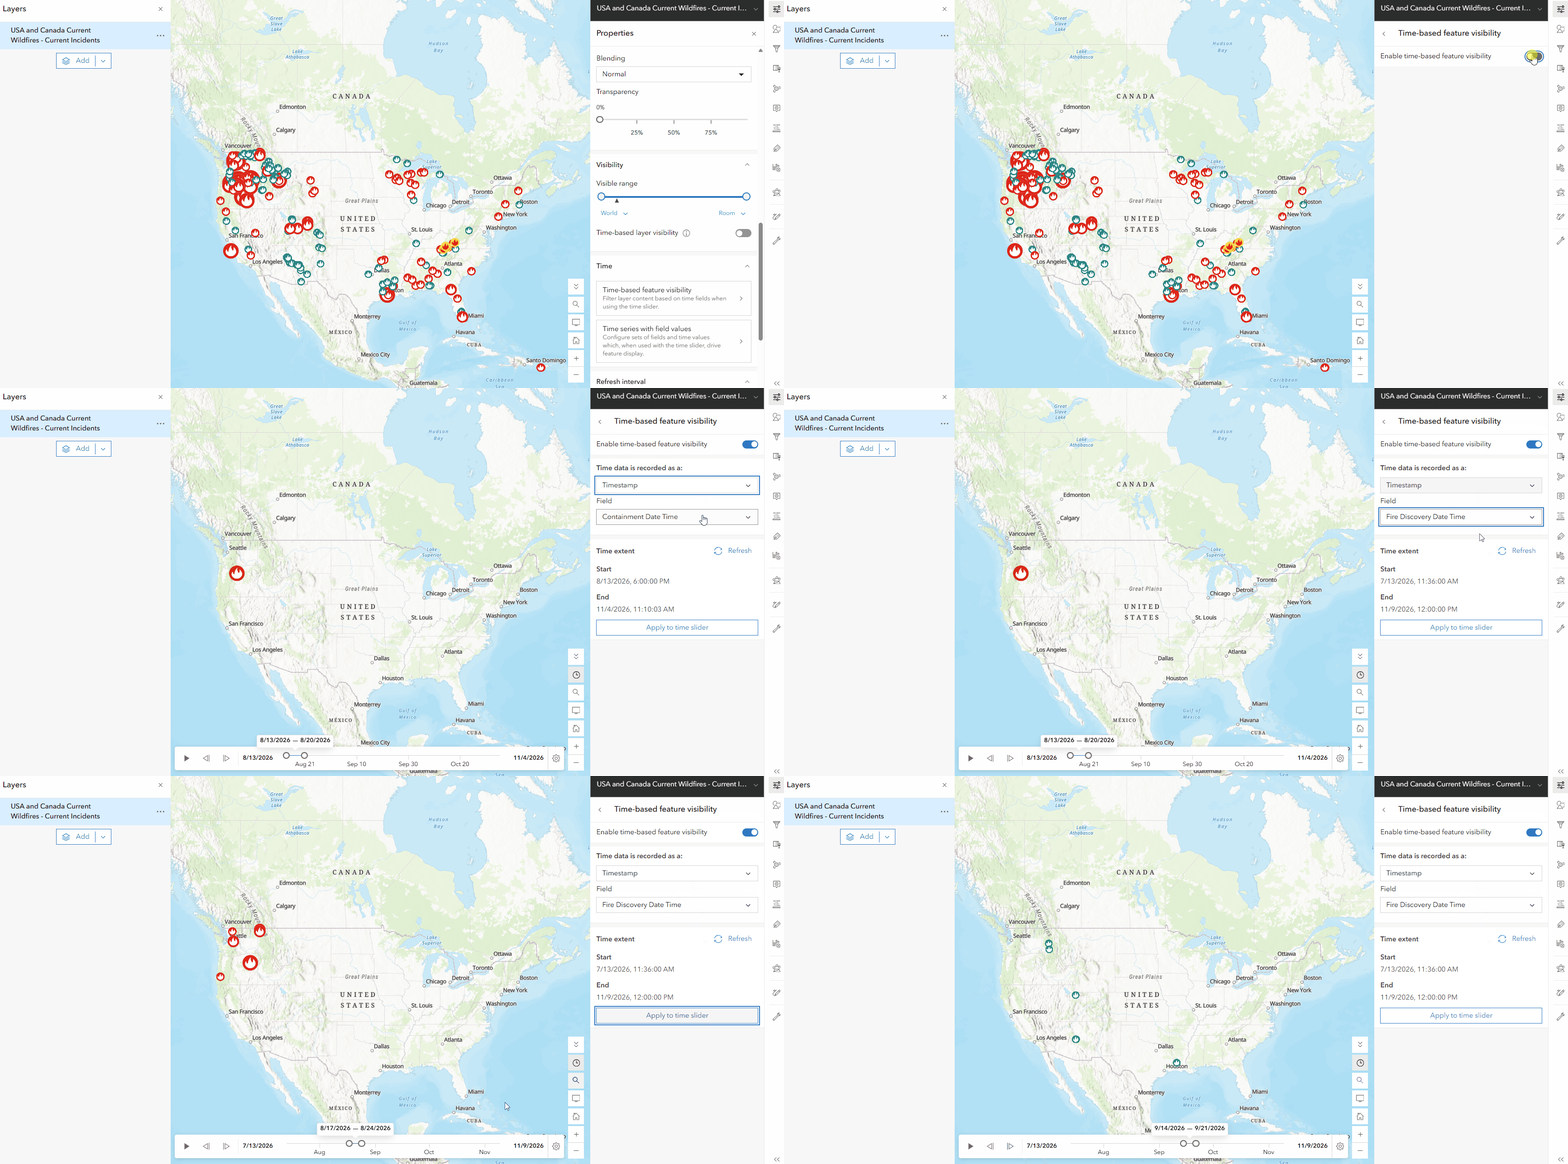
Even for the original item owner, enabling or disabling time directly in Map Viewer while authoring the map is a time-saver.
Of course, this doesn’t mean any and every map layer can be turned into an animation; it still needs to have a properly formatted and populated date field—in other words, it must contain data from more than one moment in time to animate through. For data configured differently, dig deeper into other options such as time-based layer visibility and time series in Warren’s fabulous blog post here.
Next Steps
Since not everyone has data with date fields, look for public maps and layers in both the Living Atlas and an ArcGIS Online search. Be sure to experiment with changing the playback properties (HINT: the gear icon on the right side of the time slider) so you can animate through either a single instance of time, reveal a progressive build-up of events (with certain appropriate kinds of data) or animate through an internal of time.



Article Discussion: