This blog article was originally published August 24, 2020. The previous update was August 28, 2023.
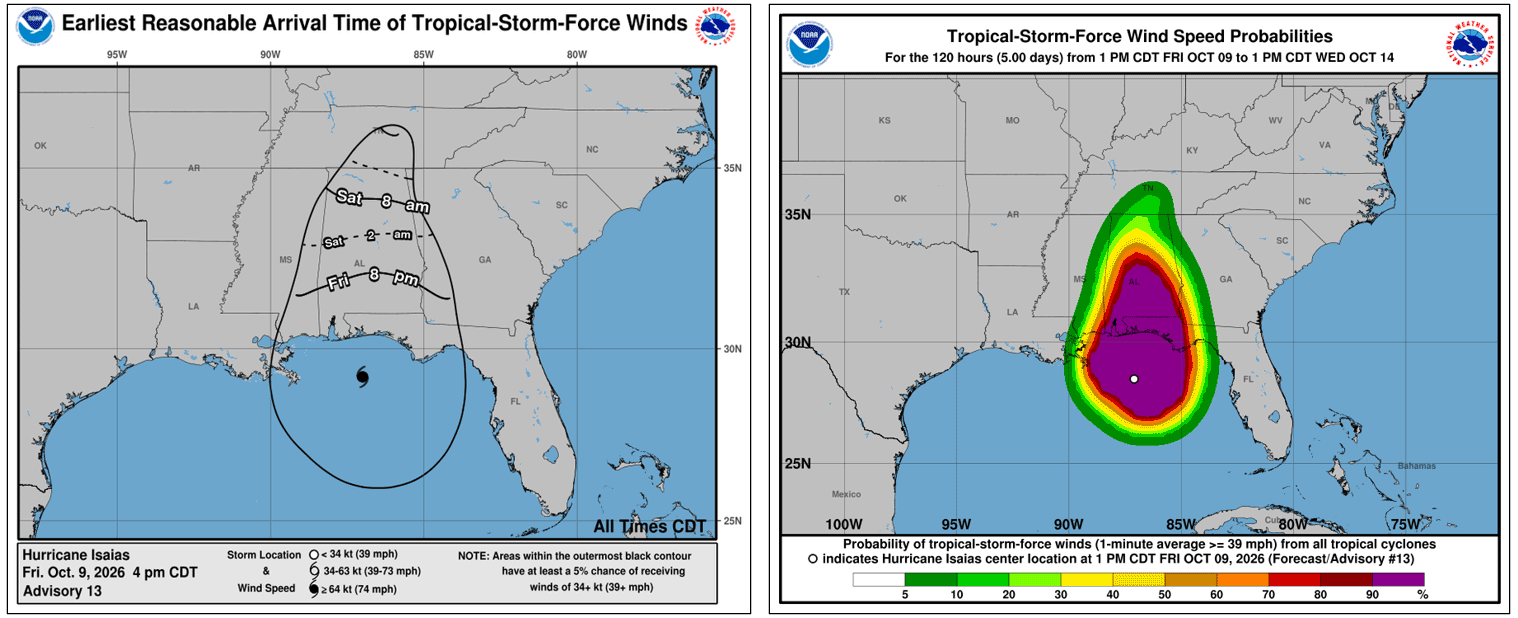
In the news: Isaias, the first hurricane in the Atlantic this hurricane season, is expected to reach landfall later this evening along the Florida panhandle. The storm has been continuing to strengthen and is now a Category 3 hurricane. Isaias is expected to bring damaging winds, torrential rain, and a significant storm surge to parts of the Gulf Coast.
In the Eastern Pacific, Hurricane Simon is currently a Category 2, forecast to become a Category 4, and is heading towards Manzanillo, Mexico. Also in the Eastern Pacific, Tropical Storm Rachel is headed towards Baja California with 60 mph winds. In the Western Pacific, Typhoon Koguma has sustained 100 mph winds, with Tropical Storm Nolo tracking nearby.
Make a hurricane map
ArcGIS Living Atlas of the World includes authoritative live feeds and other content that helps you learn more about active hurricanes, cyclones, and typhoons. Besides making your own map in under a minute using ArcGIS Online and ArcGIS Living Atlas content, you can use other applications that use the same live feeds to visualize and learn more about hurricanes.
Follow these steps to make your own hurricane map in a minute, maybe less. This tutorial will cover the following:
- Make an ArcGIS Online map using the ArcGIS Living Atlas Active Hurricanes live feed.
- Refine and finalize the map by changing the basemap and adjusting layers and styles (optional).
You can also try ready-to-use apps like Hurricane Aware and Hurricane Public Information Map.
Step 1 — Sign in to your ArcGIS account and open Map Viewer. There are two ways to add layers from the Content (dark) toolbar:
(1) Click Add, then Browse layers.
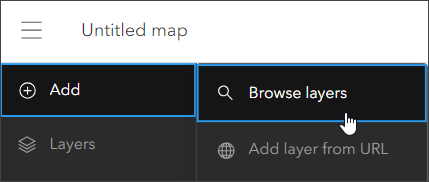
or (2) Click Layers, then Add.
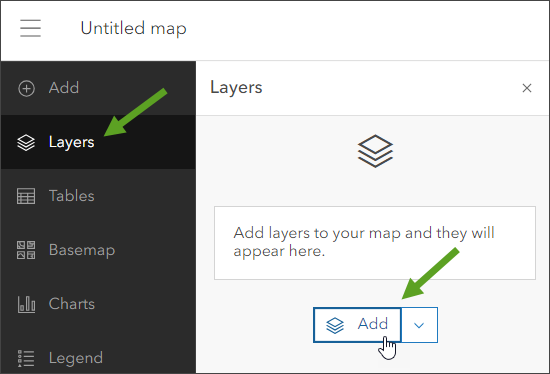
Step 2 — Choose Living Atlas from the Add layer drop-down.
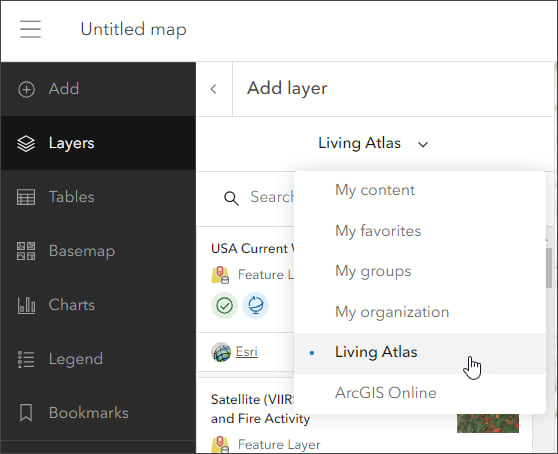
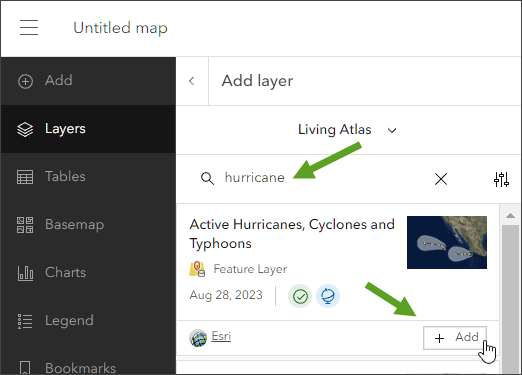
Step 3 — Enter “hurricane” in search to locate matching layers from Living Atlas. Locate the Active Hurricanes, Cyclones and Typhoons layer and click [+ Add] to add it to the map.
Tip: To learn more about any layer, click the layer card to view the item information, such as overview, description, and more. Click View item at the bottom to open the full item pages.
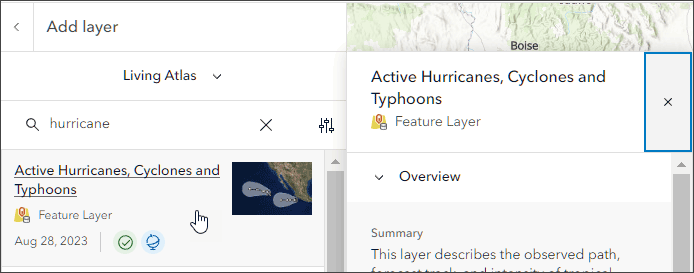
From the Active Hurricanes item details you will learn that the layer shows the observed path, forecast track, and intensity of tropical cyclone activity (hurricanes, typhoons, cyclones) from the National Hurricane Center (NHC) and Joint Typhoon Warning Center (JTWC). The source is checked for updates every 15 minutes using the aggregated live feed methodology.
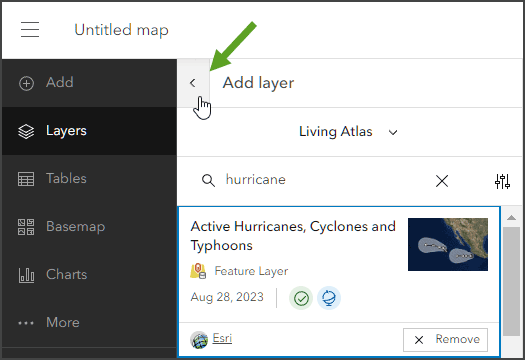
Step 4 — Click the left arrow to return to the Layers pane in the Contents (dark) toolbar.
Step 5 — Expand the Active Hurricanes, Cyclones, and Typhoons layer to view its sublayers.
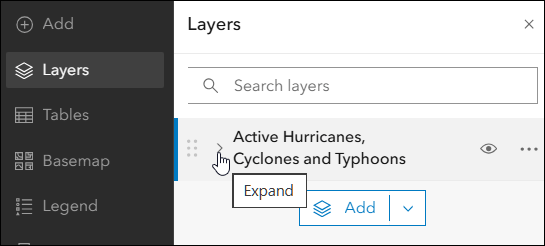
You can hide or show sublayers to display the hurricane information you want. Explore the map and click features to learn more about them. The hurricane map was created in less than a minute, but additional refinements can be made to customize the map to suit your tastes and needs. Use the Layer pane to toggle or select sublayers, use the Settings (light) toolbar to change layer style, effects, and other settings.
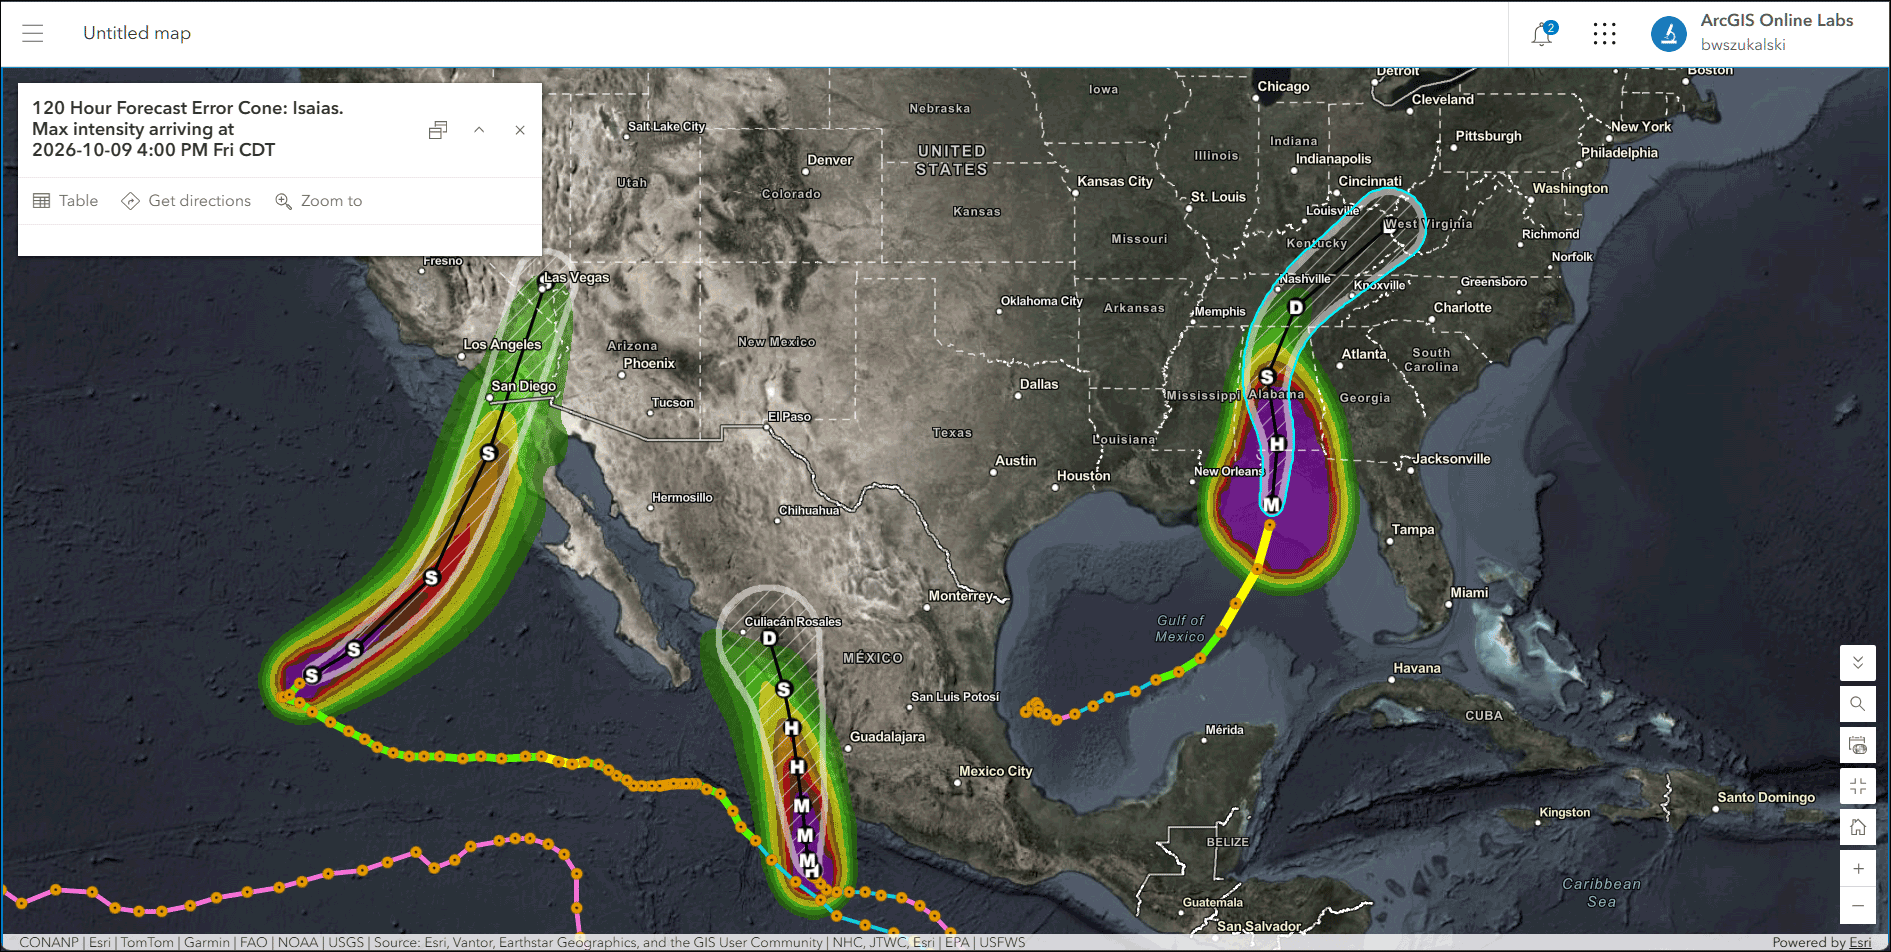
In the example below, several layers were toggled to show the current track, the forecast cone, and the predicted hurricane force winds with partial transparency. In addition, the basemap was changed to Firefly Imagery Hybrid.
Use Hurricane Aware
Hurricane Aware is a ready-to-use Living Atlas application that uses the same live feeds layer as above. The app also adds demographic information to help you learn more about impacted areas. Follow these steps to use Hurricane Aware.
Step 1 — Go to the ArcGIS Living Atlas website Apps tab and look for Hurricane Aware.
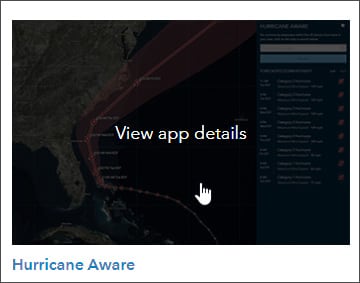
Step 2 — Open Hurricane Aware by clicking the thumbnail to View app details.
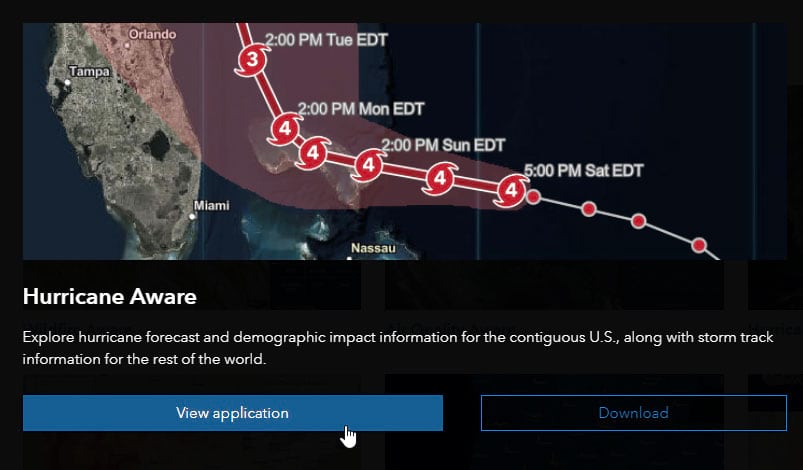
Step 3 — Click View application.
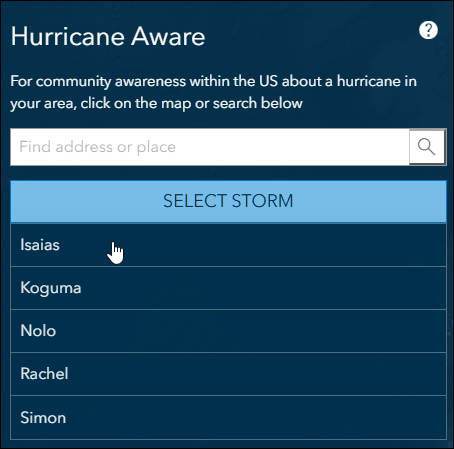
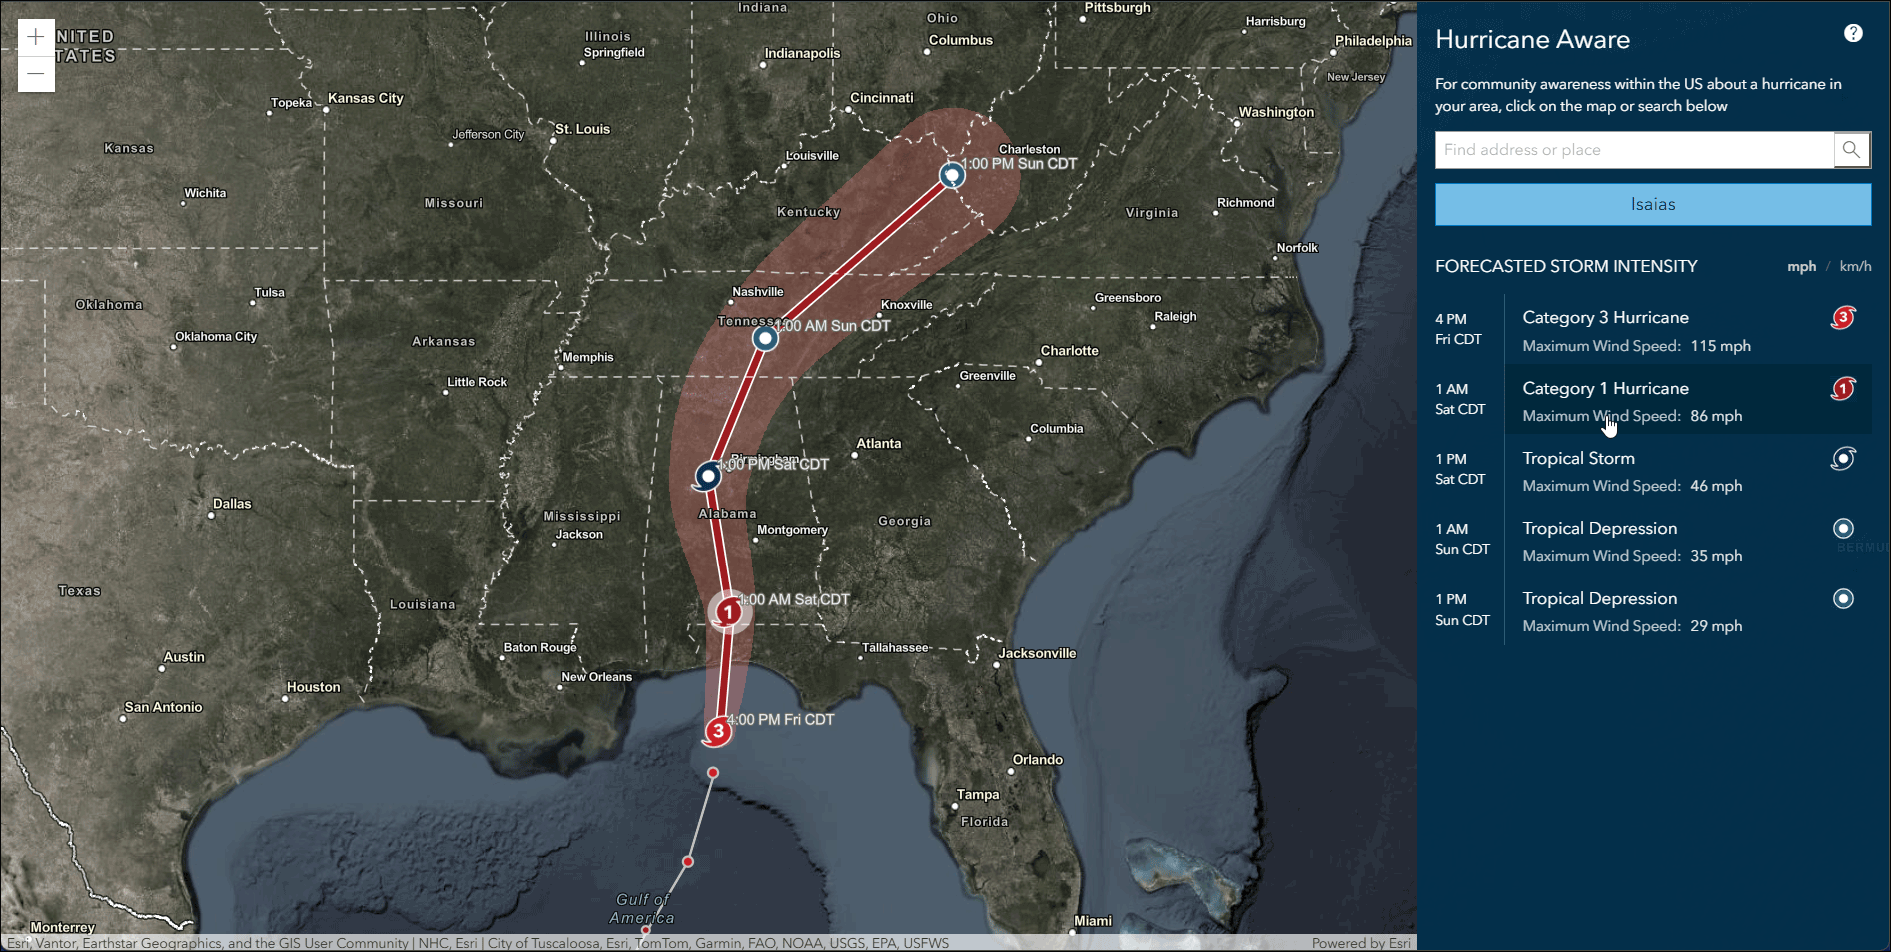
Step 4 — Click Select Storm and choose from the current active storms. Isaias was selected, showing it’s location as it approaches landfall along the Gulf Coast.
Step 5 — View the selected storm. The storm intensity forecast is displayed on the right, click an entry to zoom to the forecasted event.
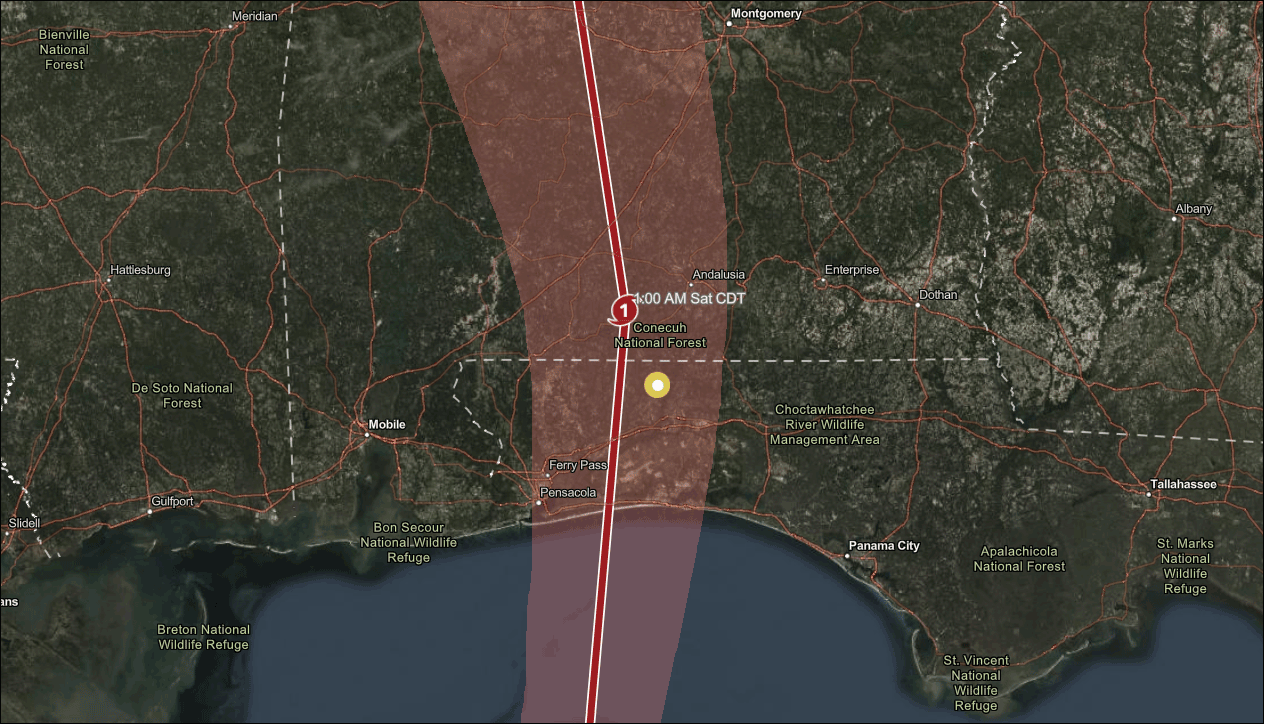
Step 6 — Click anywhere within the United States to learn more about local weather and community demographics. A yellow dot appears where you click.
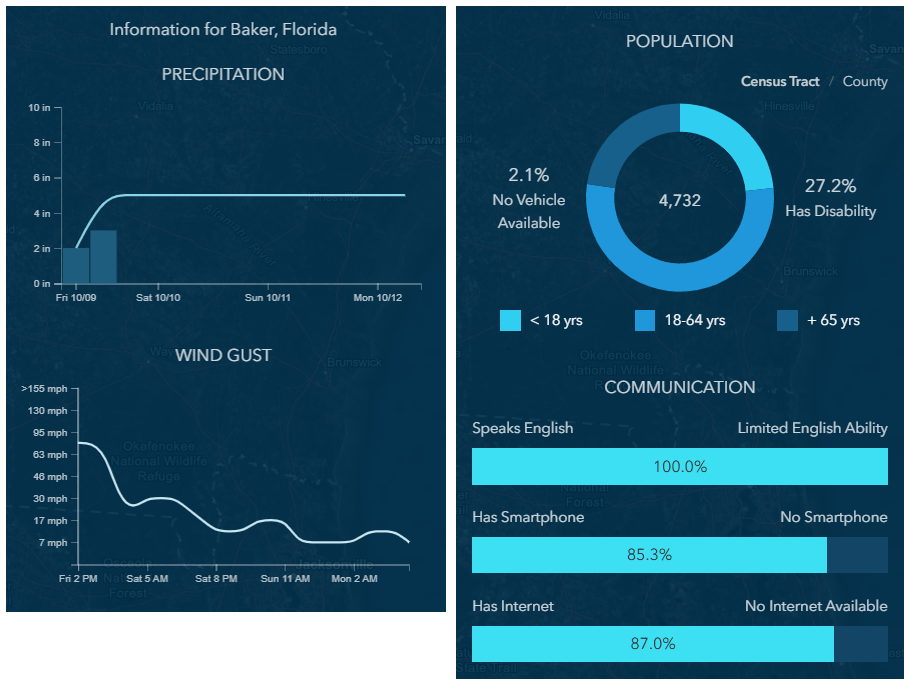
Scroll down in the side panel to see additional charts. The data shown is from Living Atlas using authoritative U.S. government sources. These include live feed National Weather Service forecasts for hurricanes, precipitation, and wind gusts. Demographic information is from the U.S. Census American Community Survey (ACS).
Hurricane Public Information Map
The Hurricane Public Information Map is built and maintained by the Esri Disaster Response Program. It uses ArcGIS Experience Builder, ArcGIS Living Atlas live feeds and basemaps, along with the Public Information solution template. To use the app, follow these steps.
Step 1 — Locate the app on the Esri Disaster Response Program website. Open the Disasters tab, then choose Hurricanes.
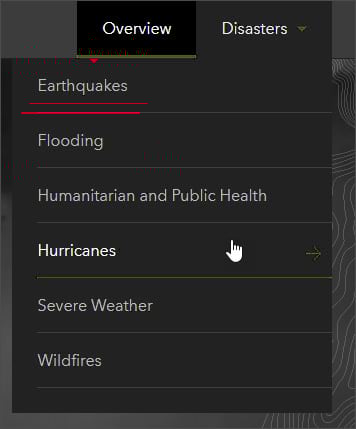
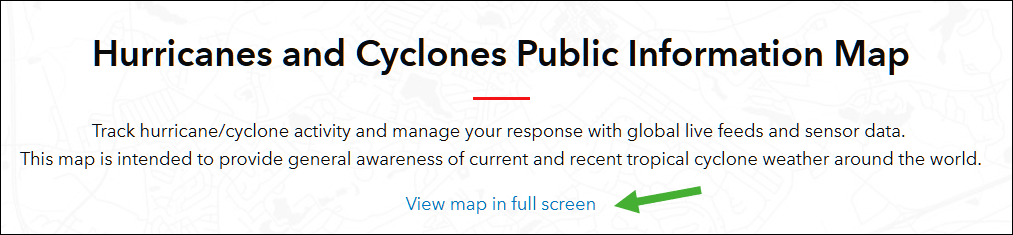
Step 2 — From the Hurricanes page click View map in full screen to open the app.
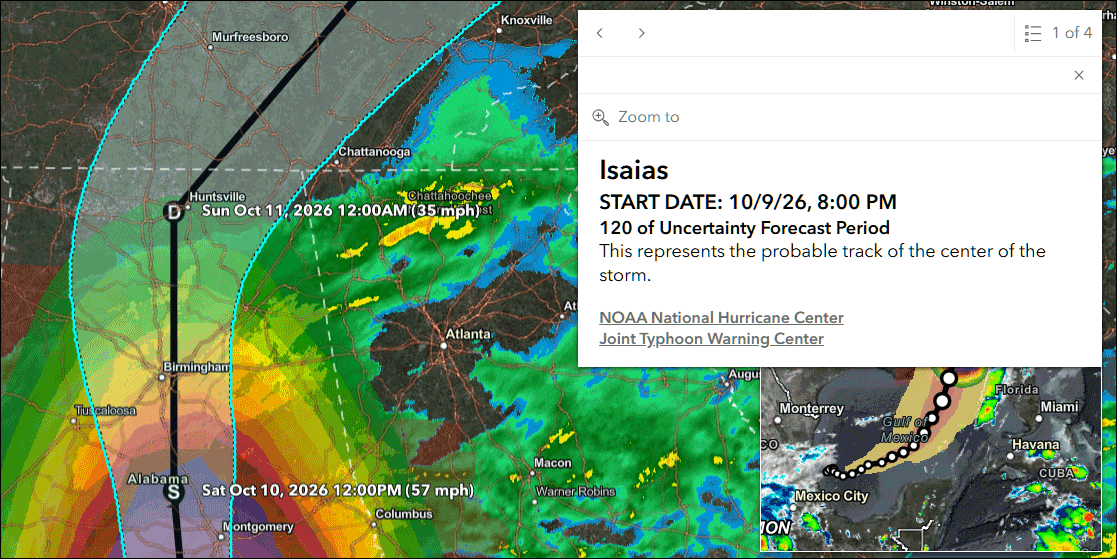
Step 3 — Explore the map using by zooming to areas of interest, or use the inset maps to choose a location. Click any feature to learn more about it.
More information
You can make a hurricane map using authoritative live feed sources in well under a minute using any of the options discussed above. For more information, see:

Commenting is not enabled for this article.