In this blog article you will learn about updates from the May 2020 Map Viewer release and will also gain an understanding of the difference between the Classic Map Viewer and the new Map Viewer. These differences include enhanced labeling, new and organized color ramps, dot density, scale-driven styling, and faster map feedback – even more reason to use the new beta!
What’s new?
Two major updates were added in the May 2020 release of Map Viewer: heat maps and clustering Arcade expression-driven styles and attributes. All Smart Mapping drawing styles are now available for you to symbolize your data using intelligent defaults.
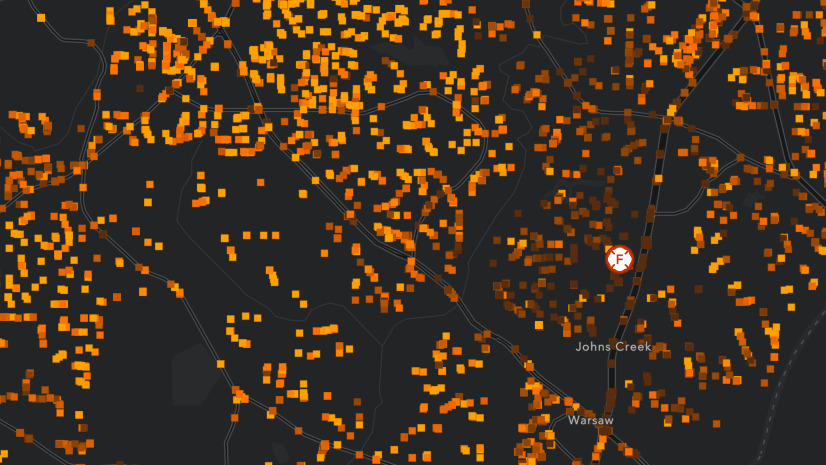
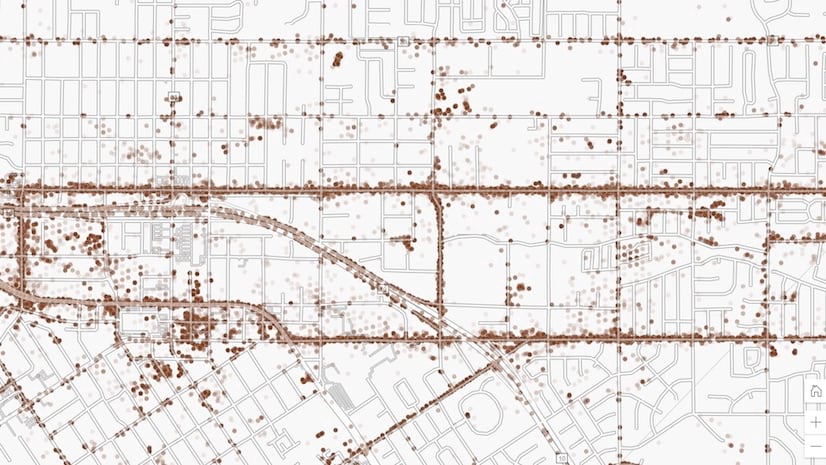
Heat maps
Use heat maps when you would like to show density, or when you have lots of overlapping points. Highlight areas with high activity with stronger colors that appear to glow hotter. You can visualize where there are lots of points or even locations of high and low values based on an attribute.

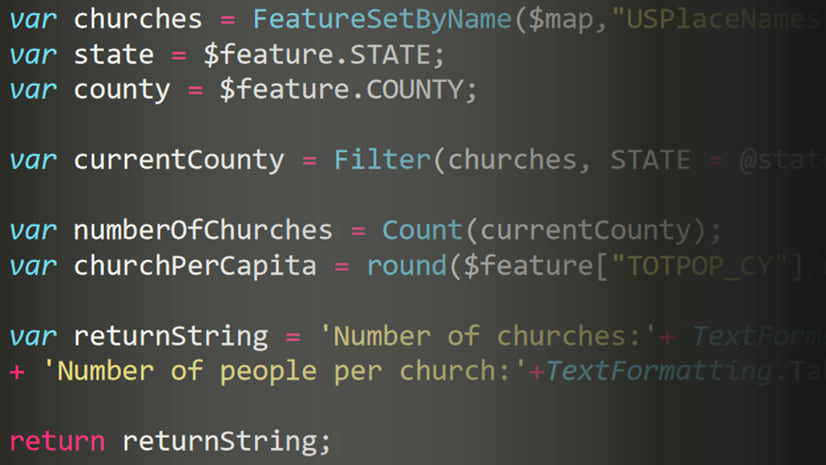
Clustering Arcade expression-driven styles or attributes
Another way to address overlapping points and large datasets is clustering. You can now cluster Arcade-driven styles such as predominance and relationship. You can also cluster layers with Arcade-driven attributes. Clustering in Map Viewer is a lot faster and can handle significantly more points compared to the 50,000-point limit in the Classic Map Viewer. Plus, you get a nice, customizable pop-up whenever you turn on clustering.

Why should I use Map Viewer Beta?
There are many reasons to use the new beta. Some of those include enhanced labeling, new and organized color ramps, dot density, scale-driven styling, and instant map feedback.
Enhanced labeling
Map Viewer includes numerous enhancements that will make your labels nicer than ever. Choose from over thirty new, decorative fonts and visualize your labels on multiple lines. You can even specify when each label class appears and disappears depending on your current zoom level. Rotate the map and your labels will nicely rotate with it. To get the label placement just right, use the horizontal and vertical offsets to nudge the labels in any direction you want.

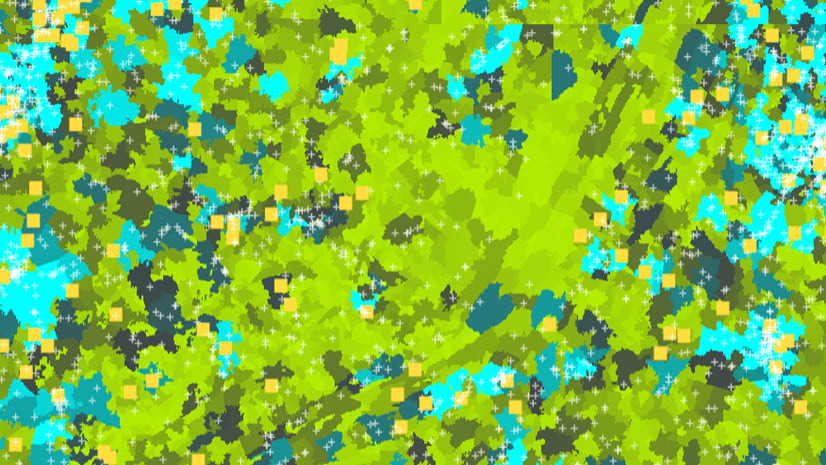
New and organized color ramps
Easily explore the hundreds of new color ramps with categories such as colorblind-friendly, bright, blues, greens, purples, and best for dark backgrounds. Map Viewer detects what color basemap you are using and suggests an optimal default ramp that goes well with whatever basemap you select. Tip: Check out the Above and Below theme for additional ramp options…and a more meaningful map!

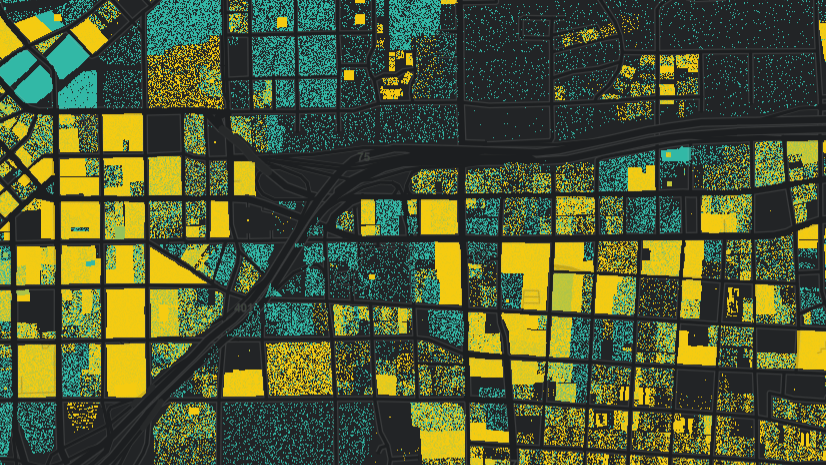
Dot density
The dot density style is only available in Map Viewer. This mapping style makes your data and story more personal by representing a count of something or someone with an individual dot. Common topics that work well with dot density include Census data, vital statistics, incidents and accidents, crime, and product sales. Edit the dot value, legend, and colors. The new blend overlapping colors option reveals where more than one category is present in an area.

Scale-driven styling
The Classic Map Viewer only supports automatically adjusting polygon outline widths and graduated symbols by scale. Map Viewer now provides the option to adjust point and line widths by scale. Scale-driven styling ensures your layers look great at any zoom level.

Instant map feedback
Experience fast visual updates with every click whether you are changing colors, modifying labels, editing pop-ups, or filtering. These quick updates help you explore and symbolize your data with greater ease and freedom to try new things.

Give Map Viewer a spin!
Join the Map Viewer GeoNet community for discussions, updates, and blogs.


You know what the worst thing is about ArcGIS Enterprise if you put upgrades and DR aside for a moment? The delta between the latest capabilities in ArcGIS Online and those in ArcGIS Enterprise. MapViewer Beta is a great example of that.
It would be really great if ESRI could allow MapViewer Beta to be registered with ArcGIS Enterprise as an external app and used internally. Some functionality might need to be turned off in doing this as dependencies might not be available in your current enterprise deployment but maybe a good amount would not.
Hey John, please check out this ArcGIS Enterprise post on the ArcGIS Online Map Viewer Beta GeoNet page: https://community.esri.com/message/892886-add-to-arcgis-enterprise
Good work but waiting for group layers.
Hi Robert, this is a very popular request that is coming soon. Here is the Map Viewer Beta Roadmap that shows layer grouping for this summer: https://community.esri.com/docs/DOC-14311-map-viewer-beta-roadmap
We are clustering car crash locations. Is there a way to have the cluster symbol be a certain size/shape/color if the cluster contains at least one fatality? There might be 30 crashes in the cluster, but if only one of them resulted in a fatality, the cluster is styled with the ‘fatality’ symbology (“severity” is an attribute of each crash record).
Hi Tom, the team is working on the ability to add a label on the cluster based on the attributes. The cluster could have two lines: the one on top would show “x fatalities”, and the second line on the cluster could show the total number of crashes in the cluster.
Please feel free to share your idea with the team in this clustering poll: https://community.esri.com/polls/3160-how-much-control-do-you-want-on-cluster-labels
I see some of the items mentioned in the Map Viewer Beta roadmap are present. How is the “Group Layers” functionality coming along? On the roadmap it exists as a ‘before Summer 2020’ item and is the most asked about feature of the past few years on ESRI Ideas.
Hi Simon, this is a high priority capability that we aim to complete this summer. Please stay tuned!
Is this still a Beta? If i make adjustments in the Beta viewer they aren’t visible after publishing. When will the adjustments in the Beta viewer back-end will become visible in the front-end?
Hi Yves, although it is still technically in beta, any map you create in beta is now an item in ArcGIS Online and can be shared and used in any app. The adjustments you make are visible after publishing and can be shared privately, just in your organization, or publically/with everyone.
Looks great! Keep up the good work!
Morning Jennifer
What is the time line for this functionality to be applied to Enterprise ? Your previous comment to John Dye, doesn’t really help as all that link says is mid2020, or after general release on AGOL, but ultimately not known I think.
I have been complaining about the slowness of updated functionality from AGOL to enterprise for about 3 years, and I don’t think it has actually improved. I don’t quite understand why something you don’t pay for is updated before something you do pay for. Why is this ?
Regards.
Jeremy.
Hi Jeremy,
Map Viewer Beta will be released as an optional add-on to ArcGIS Enterprise 10.8.1 alongside the release of the 10.8.1 software itself. Stay tuned for the announcement blog when 10.8.1 goes out within the next couple of weeks.
We generally release ArcGIS Enterprise twice a year and include a large number of new apps and features with every new version. Many times you will have seen much of that functionality in ArcGIS Online given its faster release cycle (typically four time per year) and because there is no software upgrade required before the new functionality is available to everyone. That’s the beauty of the SaaS model! Of course, once a new version of ArcGIS Enterprise is released it still up to each organization to choose when and whether to adopt a new version given the work required to plan for and execute an upgrade of the software.
Because of the nature of ArcGIS Enterprise being installed in customers’ own infrastructure, sometimes running for years between upgrades, we have a deliberate policy of only including production-ready functionality (no beta features). In this case, we recognize that Map Viewer Beta represents a significant leap forward in terms of both user experience and capabilities and there’s large demand for it as a result. This is why we are releasing Map Viewer Beta as a separate add-on on top of ArcGIS Enterprise 10.8.1. This will make Map Viewer Beta available to ArcGIS Enterprise customers ahead of its first non-beta release in a way that doesn’t introduce beta applications into the core software.
Hi Jennifer. The capabilities of the new map viewer are pretty cool. I have some services in my standalone server, which I casually bring to the regular map viewer through their REST address using “Add Layer from Web”. How can I do this in the new map viewer? Thanks!
Hi Johanna, we’re glad you like the new map viewer. The option to add layers from the web is something the team is working on, but until this feature is available, I recommend opening the layer in the current map viewer, saving the map, then opening the map in the new map viewer.