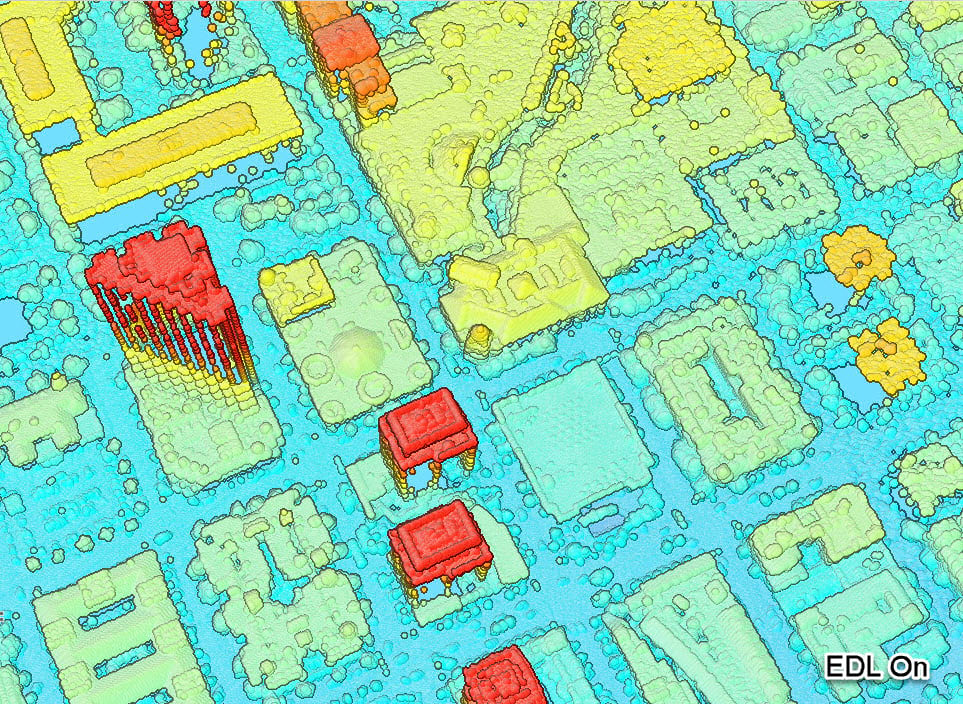
Eye-Dome Lighting (EDL), a technology that improves depth perception of point cloud, was implemented into ArcGIS Pro 2.4.
The lack of depth perception in the previous releases made it difficult to interpret point cloud data. Some renderers could provide contextual information like RGB and intensity to help users to interpret data. Most renderers, however, do not provide such information. Therefore, users have to look at their data from different perspectives and distances in order to differentiate various objects and perceive their details.
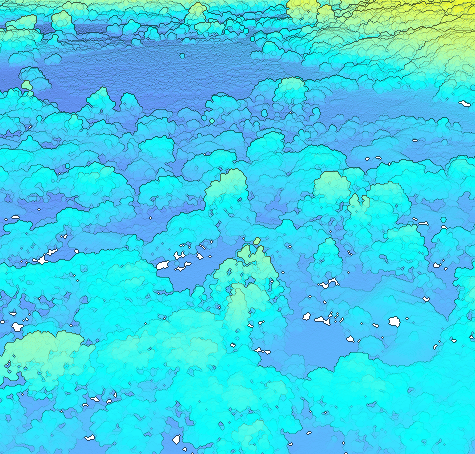
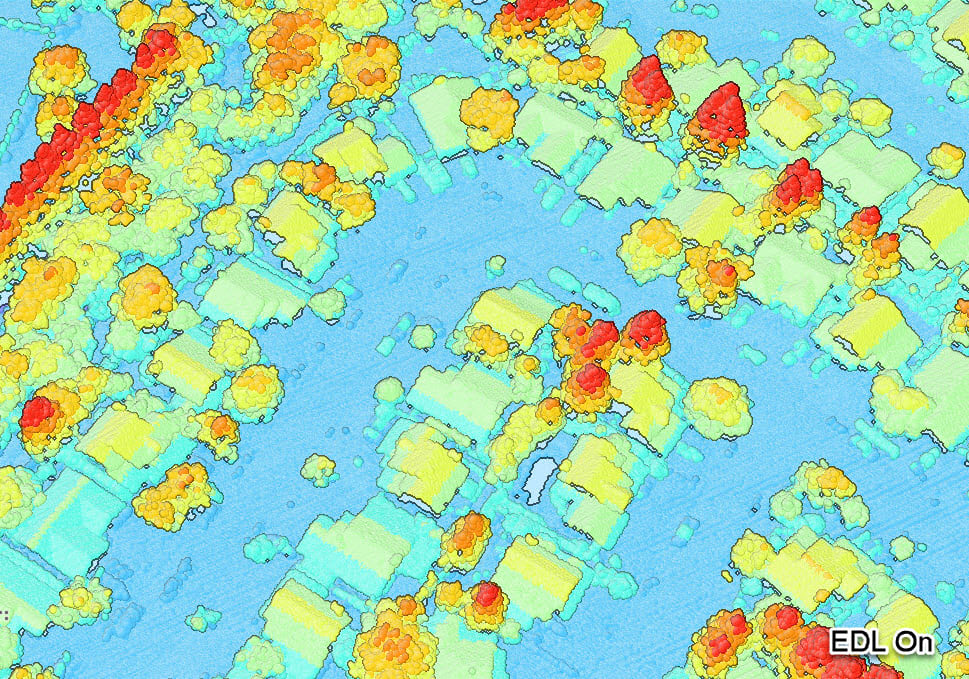
EDL could effectively improve the depth perception of point cloud and therefore improve the data interpretation. The technology was first proposed by Christian Boucheny in 2009 and became more and more popular in recent years due to the increasing power of the GPU. The points are symbolized using circles in ArcGIS Pro. Then, EDL darkens the areas where the depths change significantly. With the help of this enhancement, users could easily see the boundaries and details of the objects.
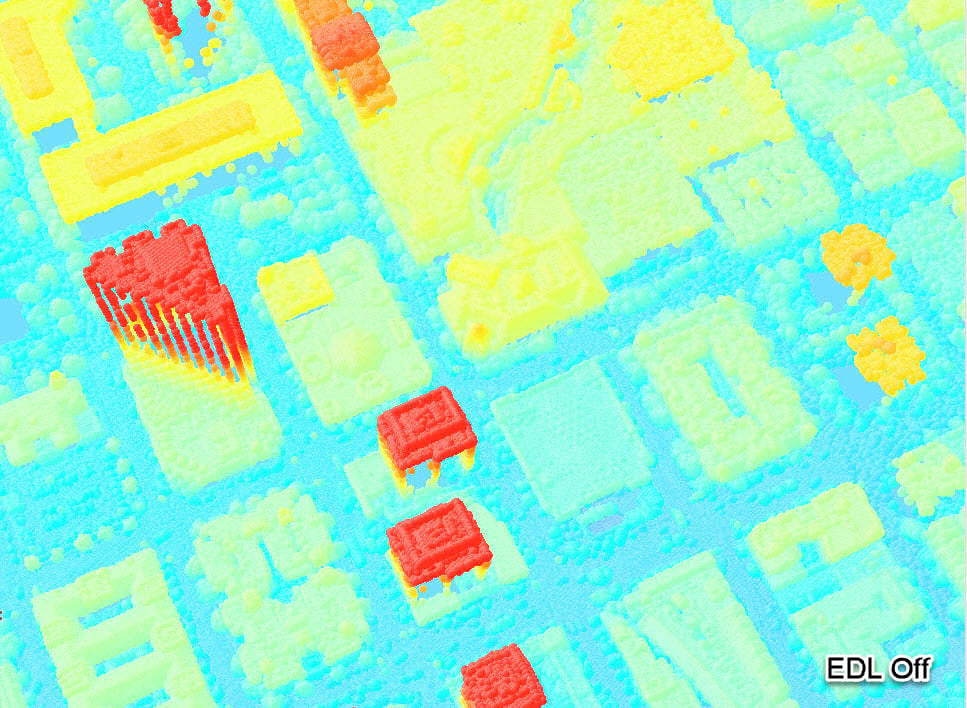
Point cloud is usually rendered using geometric primitives such as camera-facing squares or circles due to their simplicity and low memory consumption. To achieve the effect of a continuous surface, the primitives are rendered with different screen sizes to fill the gaps among points. If we choose to use the same color to draw all the points, the resulting image (figure 1) will not show us any meaningful information.

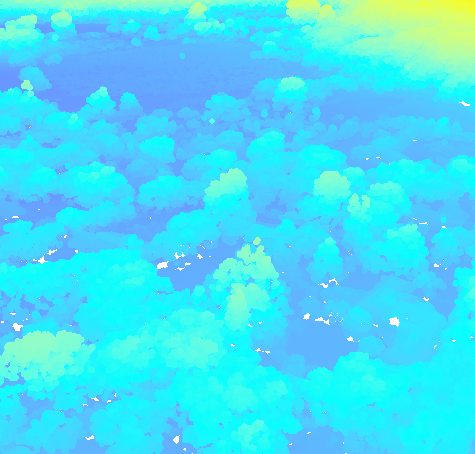
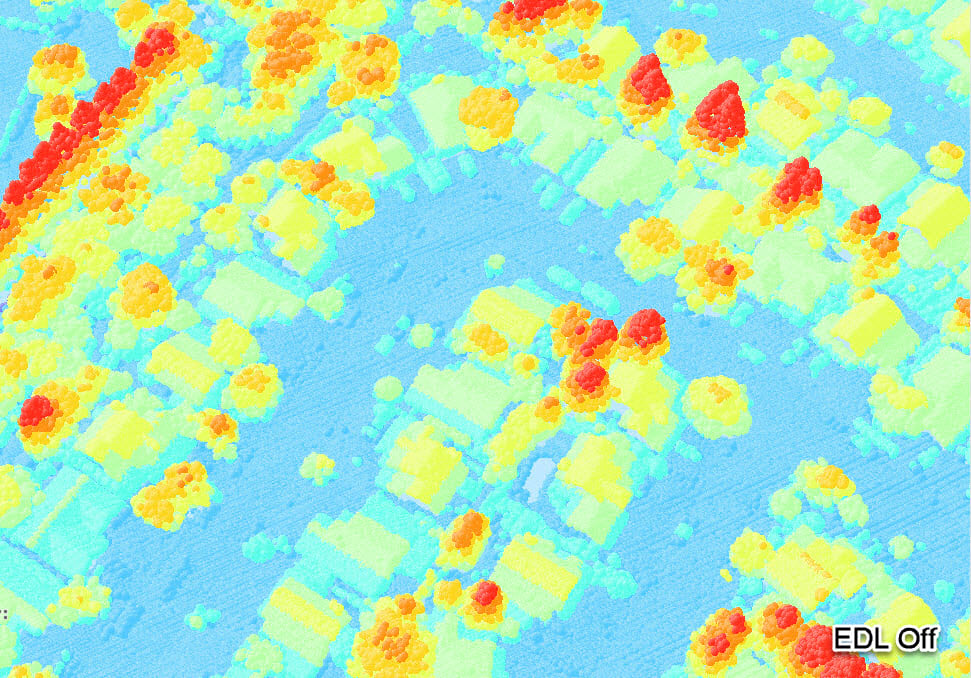
To solve this issue, we could draw points using different colors based upon attributes like elevation. The resulting image (figure 2) looks improved as it displays more detailed features. However, the issue still occurs at areas where same or similar colors are being used.
In other words, the viewer loses perception of depth. Unless the original point cloud data includes RGB color or intensity information, the rendering result would always have this problem. To increase depth perception, we can darken the area where depths change significantly. This is a similar task of ambient occlusion, where surfaces that are close to each other appear darker. The most popular ambient occlusion technique is Crytek’s screen-based ambient occlusion and its variants. However, this technique requires surface normal information, which point cloud data does not usually have.
On the other hand, EDL is a screen space technique that does not require normal data. Besides creating a color image (figure 2) of the scene it also generates a depth image (figure 3) as well.
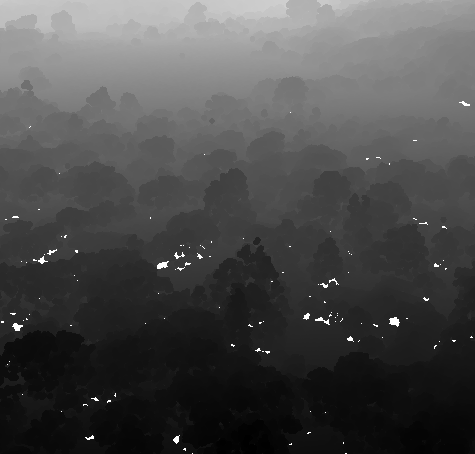
The depth image contains the information about the distance of all the points to the viewer. The distance from the point to the viewer is represented as a floating number, normalized between 0.0 and 1.0. The darker the depth color, the closer the pixel (of the point) to the viewer. EDL algorithm then takes the depth image as the input data and decides where to darken the color. The final color of a pixel whose surrounding depth values are bigger will get darkened. The bigger the difference of the depth values, the darker the color. Figure 4 shows the final EDL enhanced image. Clearly, we can see much more detail.
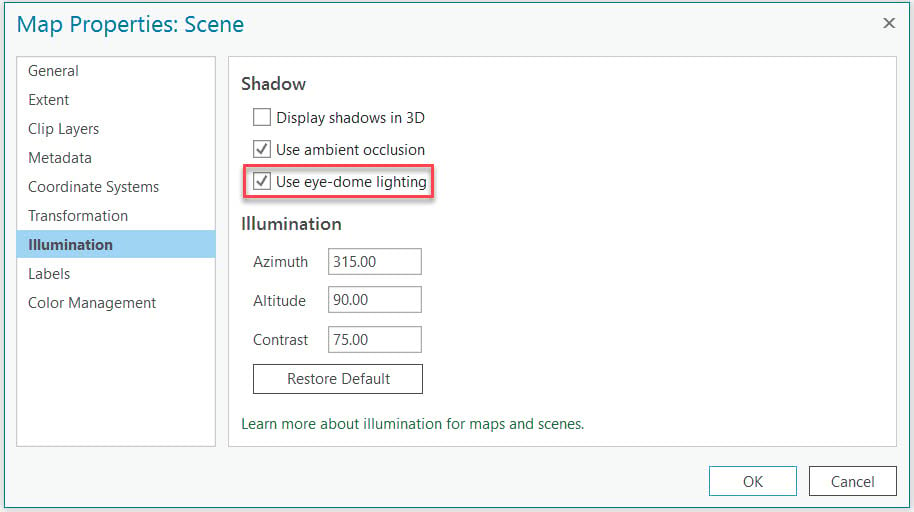
In ArcGIS Pro, EDL is implemented at both local and global scene views. It is currently available at LAS dataset layers and point cloud scene layers. EDL can be set at two places, either at the layer’s ribbon (figure 5) or the scene’s illumination page (figure 6). The settings at the layer’s ribbon are only for the current layer. The settings at the scene’s illumination page are for the scene and will overwrite the layer’s setting.

To toggle the EDL on or off and change its strength and width for a LAS Dataset layer:
- Select the LAS Dataset layer at the Contents pane. The LAS Dataset Layer tab will then appear.
- Under the Appearance tab, find Eye-Dome Lighting inside the Lighting and Shading group. You can toggle it on or off, and adjust its strength and width.
EDL strength adjusts the intensity of the resulting effects. You can adjust its value between 0% and 100%. EDL is disabled when the value is set to 0%. The default value is 50%. A larger value will give you a stronger perception of the depth.
EDL radius controls the width of effects. Its values range between 1 and 5. The default value is 2 pixels wide. However, a larger radius will slow down the performance.
Data Credit: City of San Diego (for San Diego data) ; NASA Grant NNX13AP69G, the University of Maryland, and the Sonoma Vegetation Mapping and LiDAR Program (for Petaluma data).
References:
- Christian Boucheny, 2009, Visualisation scientifique de grands volumes de données: Pour une approche perceptive
- Christian Boucheny and Alejandro Ribes, 2011, Eye-Dome Lighting: a non-photorealistic shading technique
- Markus Schütz, 2016, Potree: Rendering Large Point Clouds in Web Browsers

Commenting is not enabled for this article.