For every infrastructure project, the engineers, analysts, construction teams, and more must understand the ground they are building on. This blog article explains how GIS enables project teams to collaboratively gain this understanding. Learn how geotechnical engineers and GIS analysts can jointly analyze subsurface data using their familiar tools. See how sharing the combined analysis to the web expedites assessments for project decision-makers, without requiring them to evaluate 100-page PDF reports of boring logs or relying on specialized software.
Before we dive in, let’s look at the connected geotechnical workflow that provides the context for the more detailed sections of this blog.
Connected geotechnical workflow
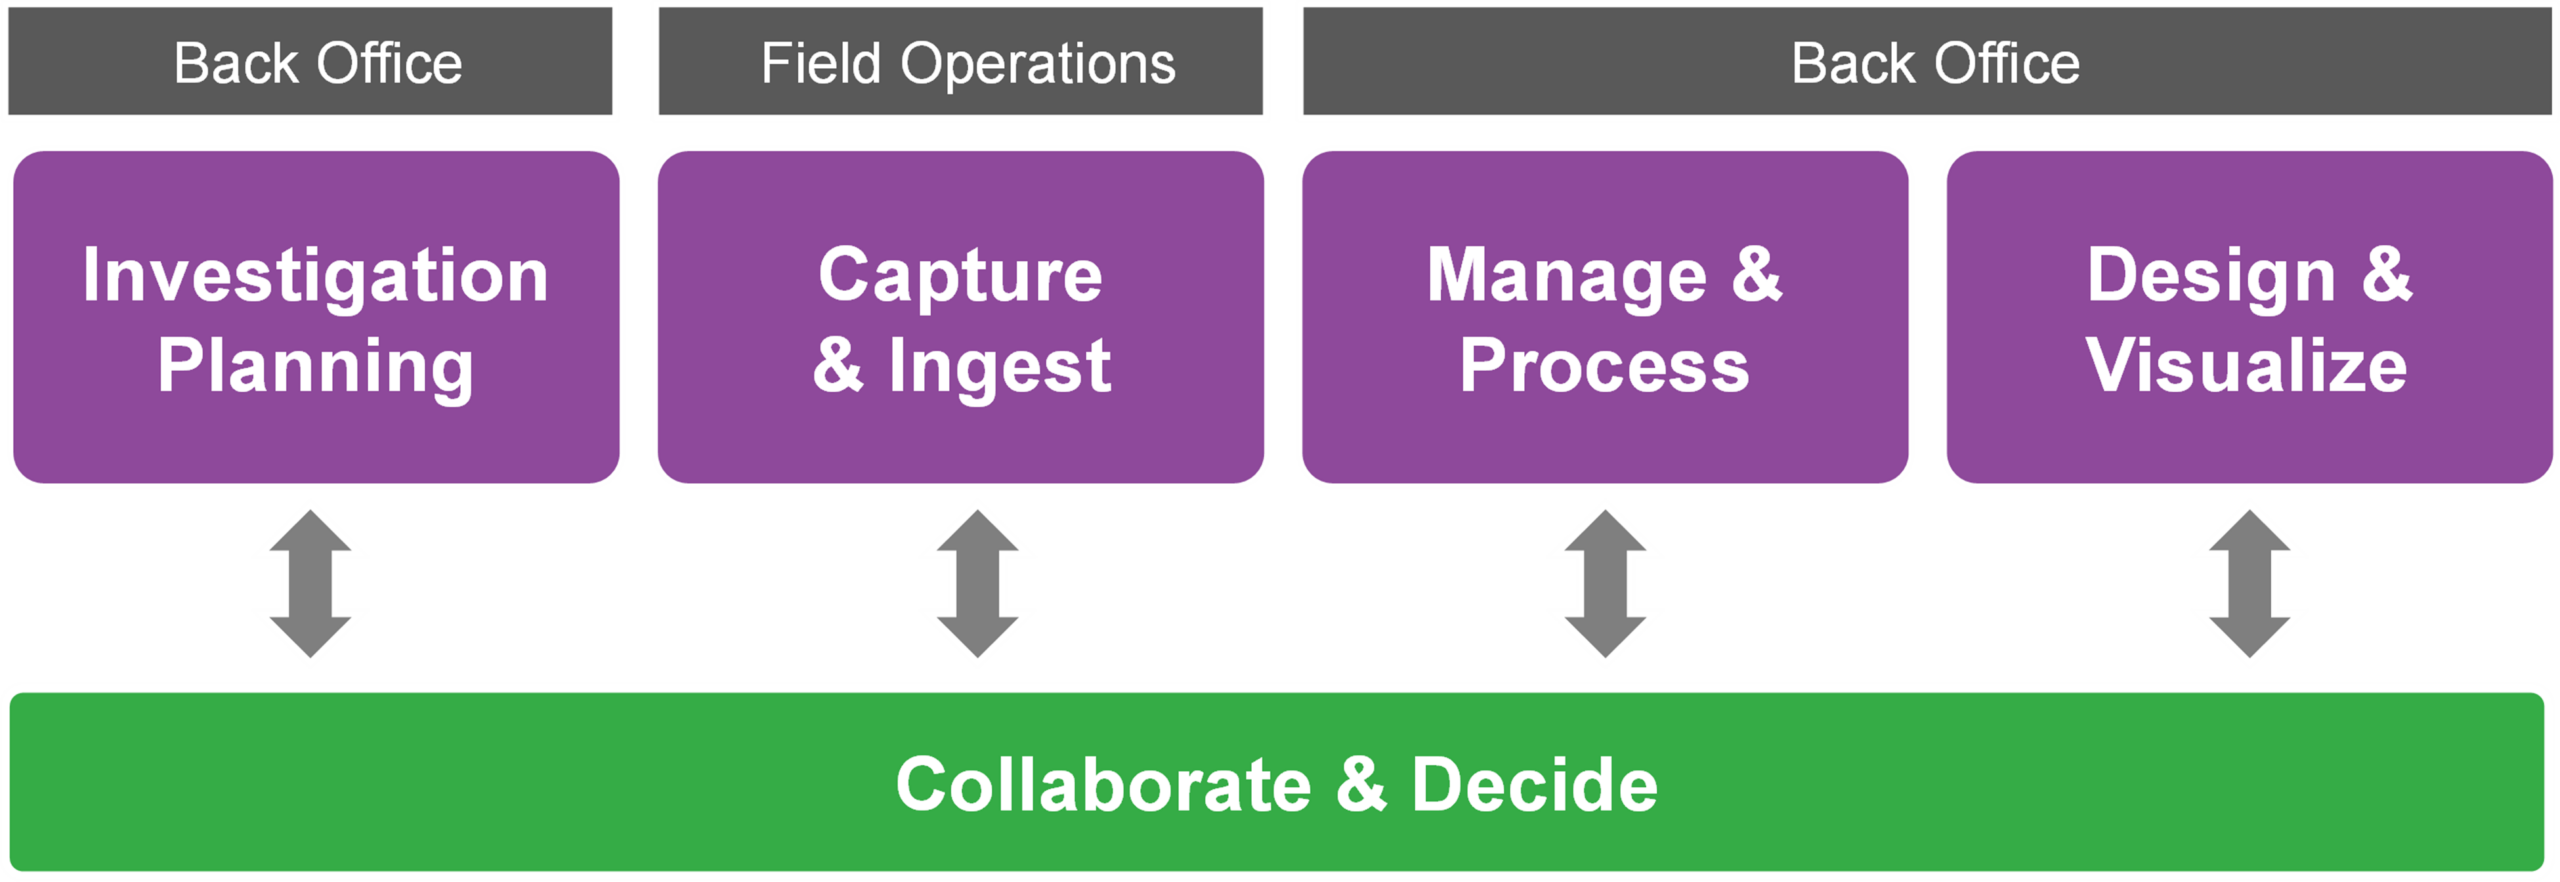
Geotechnical workflows are not confined to a single engineer working in a specialized application. Instead, they involve collaboration among multiple disciplines across several stages:
- Investigation planning—This stage involves planning and prioritizing subsurface investigations. Teams identify data requirements, drilling locations, and sampling strategies needed to reduce project risk and uncertainty.
- Capture and ingest—Field crews carry out investigations through boreholes and laboratory tests, then make the data available to back-office teams for further analysis.
- Manage and process—Here, the data is analyzed and interpreted to create reliable subsurface models and representative geotechnical engineering datasets.
- Design and visualize—This stage focuses on producing 2D and 3D visualizations that help stakeholders understand subsurface conditions in context. These visualizations also enable engineers to begin sizing foundation members.
The workflow is not a clean, left-to-right progression, but is dynamic and iterative. Efforts and data continuously shift between back-office teams, field crews, and decision makers, rather than remaining with a single discipline or software tool.
GIS acts as the connective layer across the geotechnical workflow, linking people, data, and systems through a common spatial framework. By bringing field observations, geotechnical analysis, and design information together, GIS helps teams collaborate, iterate, and make decisions based on a shared understanding of subsurface conditions.
In the following, we’ll take a deeper look at what happens after the field team captures and processes an initial round of collected site data.
Scenario: Roadbed replacement
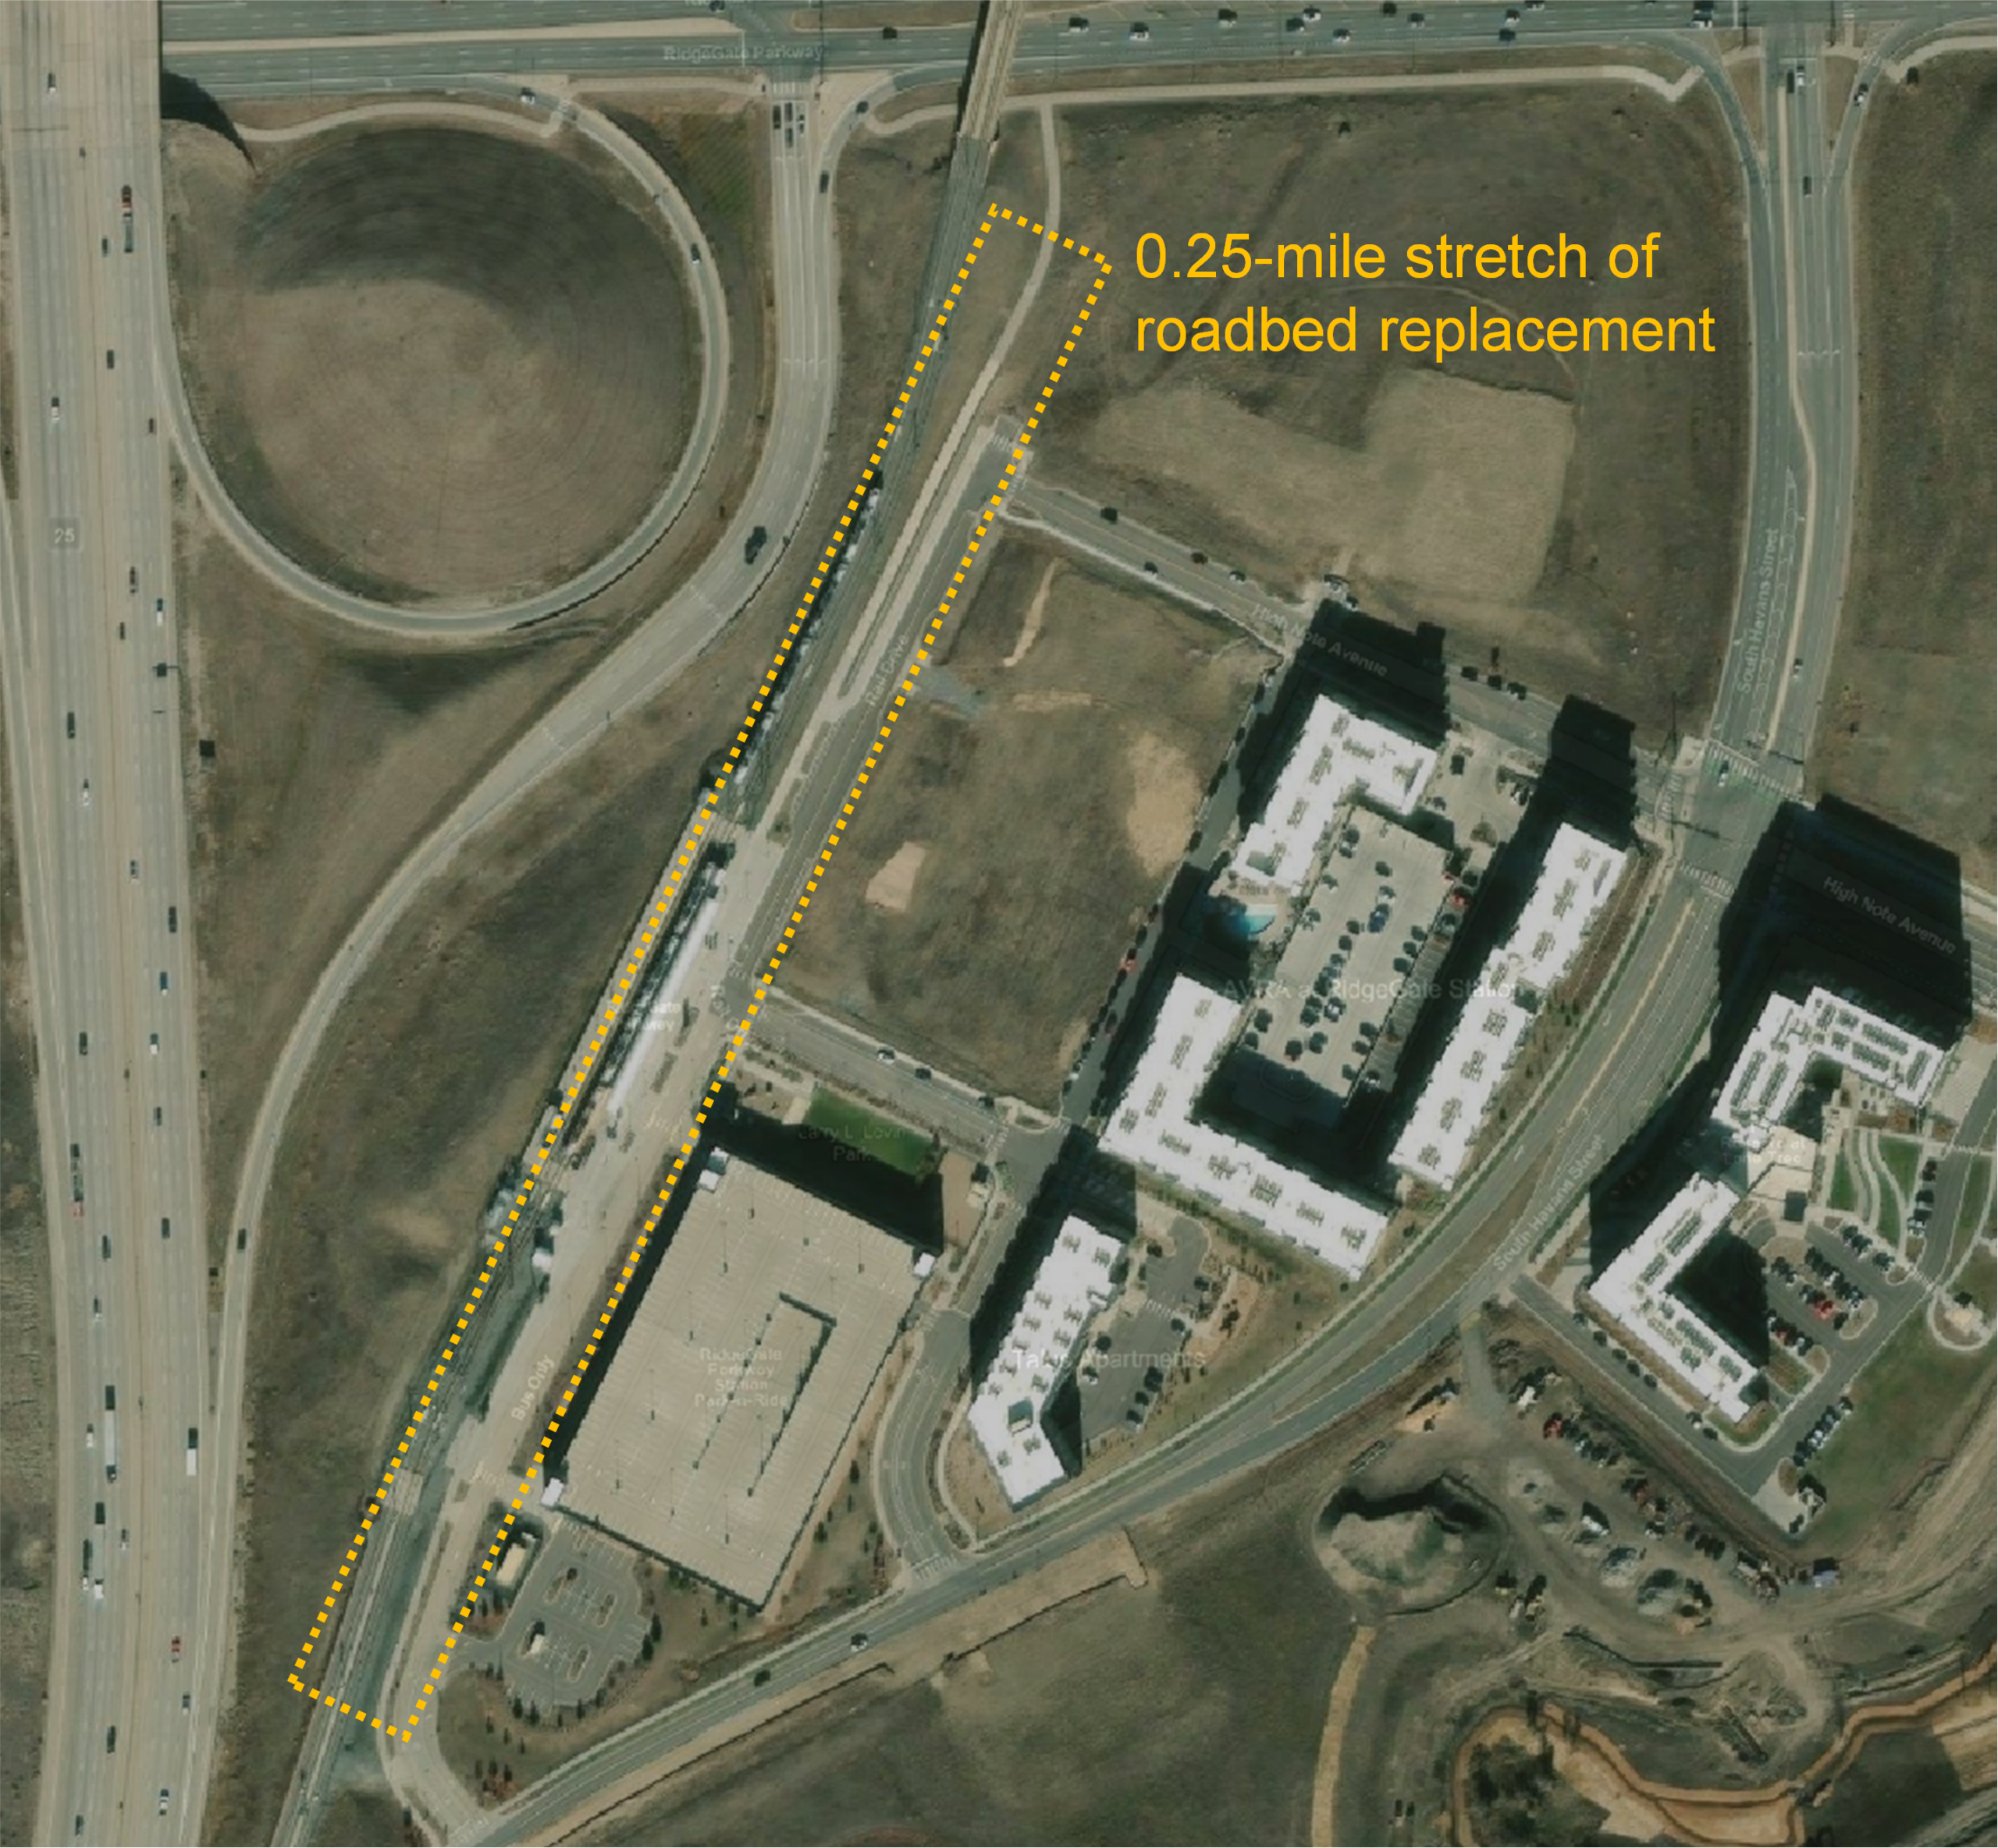
Consider a scenario in which a 0.25-mile stretch of roadbed needs to be replaced. The overlying roadway runs between a rail line and a commercial building. The adjacent, active infrastructure motivates the need to minimize site visits while adequately characterizing the subsurface.
Subsurface analysis in spatial context
Subsurface analysis is a cost-effective way to assess spatial variability of soil and rock properties based on available physical data. It also serves to identify zones where uncertainty remains high, warranting additional site data collection before detailed engineering design or construction begins. But geotechnical data is often difficult to manage. Drilling outcomes, in-situ (CPT) measurements, soil sample lab results, and expert interpretations in borehole logs may be scattered or incompatible. This makes the use of specialized geotechnical software important (for example, GeoDin).
Where samples were collected, where boreholes were drilled, how soil strengths vary, and where uncertainty remains high are all spatial questions. Using GIS, the specialized geotechnical database can be combined with the other disparate information (such as CAD files) and the spatial context that GIS provides, unlocking a comprehensive subsurface analysis.
This leads to a shared understanding that engineers, GIS analysts, project managers, and field teams can use to make better decisions. The following puts these ideas to work.
Interpolate surfaces from soil, rock, and lab data
The project team needs to determine whether enough site data has been collected to characterize the site’s subsurface before moving into the detailed foundation design that precedes construction. The geotechnical engineer initiates this effort by creating interpolated surfaces using the collected boring, in-situ (such as CPT), and lab results from soil samples while working in their preferred software. For example, using GeoDin® Ground, the engineer can work with the collected subsurface data, analyze it, and create interpolated soil and rock TIN surfaces (and volumes) from within Autodesk® Civil 3D®.
In this video, the geotechnical engineer adds field-collected data and creates surfaces for soil and rock layers using GeoDin Ground in Civil 3D.
After creating the surfaces, the engineer provides the drawing containing boring locations and interpolated subsurface data directly to a GIS teammate, who will perform geostatistical analysis using ArcGIS Pro. The engineer can also share selected Civil 3D content through feature services, including boring locations and boring logs as attachments, allowing stakeholders to stay informed through web maps. From there, the GIS analyst takes over.
Bring geotechnical data into context through scene authoring
This is where GIS enables the next step: Authoring a scene that ingests and enriches the work the geotechnical engineer has already done.
The GIS analyst incorporates geotechnical data from the Civil 3D drawing into an ArcGIS Pro scene, in preparation for enriching the subsurface analysis and sharing the combined results with project decision-makers. This provides a common 3D spatial context for integrating and visualizing the different subsurface data, allowing for further analysis, and decision-making.
To author the scene, the analyst uses the Create Terrain from BIM geoprocessing tool to create terrain datasets representing the top and bottom boundaries of each soil and rock layer. Other content added to the scene from the Civil 3D drawing includes cylindrical multipatch representations of probed locations and through-depth, layering information from site measurements.
In this video, the GIS analyst adds Civil 3D TIN surfaces for the soil and rock layers to a scene.
Subsurface data managed in geotechnical software, such as through-depth site measurements as well as the attached reports from GeoDin, integrates with ArcGIS and is readily incorporated into the scene. For any historical boring logs locked away in PDF files, the GIS analyst supplements the collection of through-depth measurements, as point features, using a deep learning package.
Prepare subsurface data, enrich with geostatistical analysis, and share results
Next, the GIS analyst carries out geostatistical analysis in ArcGIS Pro that combines with and enriches the Civil 3D content provided by the geotechnical engineer. This consists of two steps:
- Identifying which through-depth measurements (3D point features) lie within each soil and rock layer
- For a property of interest, quantifying the spatial variability throughout each soil and rock layer
A specific use case may require one of several approaches to carrying out these steps in ArcGIS Pro. For example, point features containing elevation values as attributes may need to be processed using Feature To 3D By Attribute. One illustrative approach to scene authoring is provided below that includes working with 3D point features.
Identify 3D point features bounded by each soil and rock layer
By default, a TIN surface layer underpins each terrain dataset in the scene. For each (physical) soil or rock layer of interest, the GIS analyst identifies the “upper” TIN surface representing the top boundary and the “lower” TIN surface representing the bottom boundary.
The GIS analyst runs the Add Surface Information geoprocessing tool twice, supplying the through-depth points as input features. The first call attributes the through-depth points with spot elevations interpolated from the upper TIN surface (for example, Z_Top). The second call attributes spot elevations with respect to the lower TIN surface (for example, Z_Bottom).

Next, the GIS analyst filters and exports those 3D points bounded between the physical top-and-bottom of a given soil or rock layer. For example, the analyst runs Select By Attributes and writes an SQL query operating on the Z_Top, Z_Bottom attributes. Running Export Features creates a new point feature class containing only those points that lie within a given soil or rock layer.
Perform geostatistical analysis to characterize spatial variability
Having prepared the subsurface data, the GIS analyst uses the available point measurements to estimate and visualize the spatial variability of a property throughout the 3D soil and rock layers. This includes areas where measurements are not directly available.
The project team identified undrained shear strength as a property of interest for designing the roadbed foundation. Physical measurements of this property are stored among the attributes of the through-depth points. Accordingly, the GIS analyst uses geostatistical tools in ArcGIS Pro to interpolate from physically available data and characterize the spatial variability of undrained shear strength throughout the soil and rock layers.
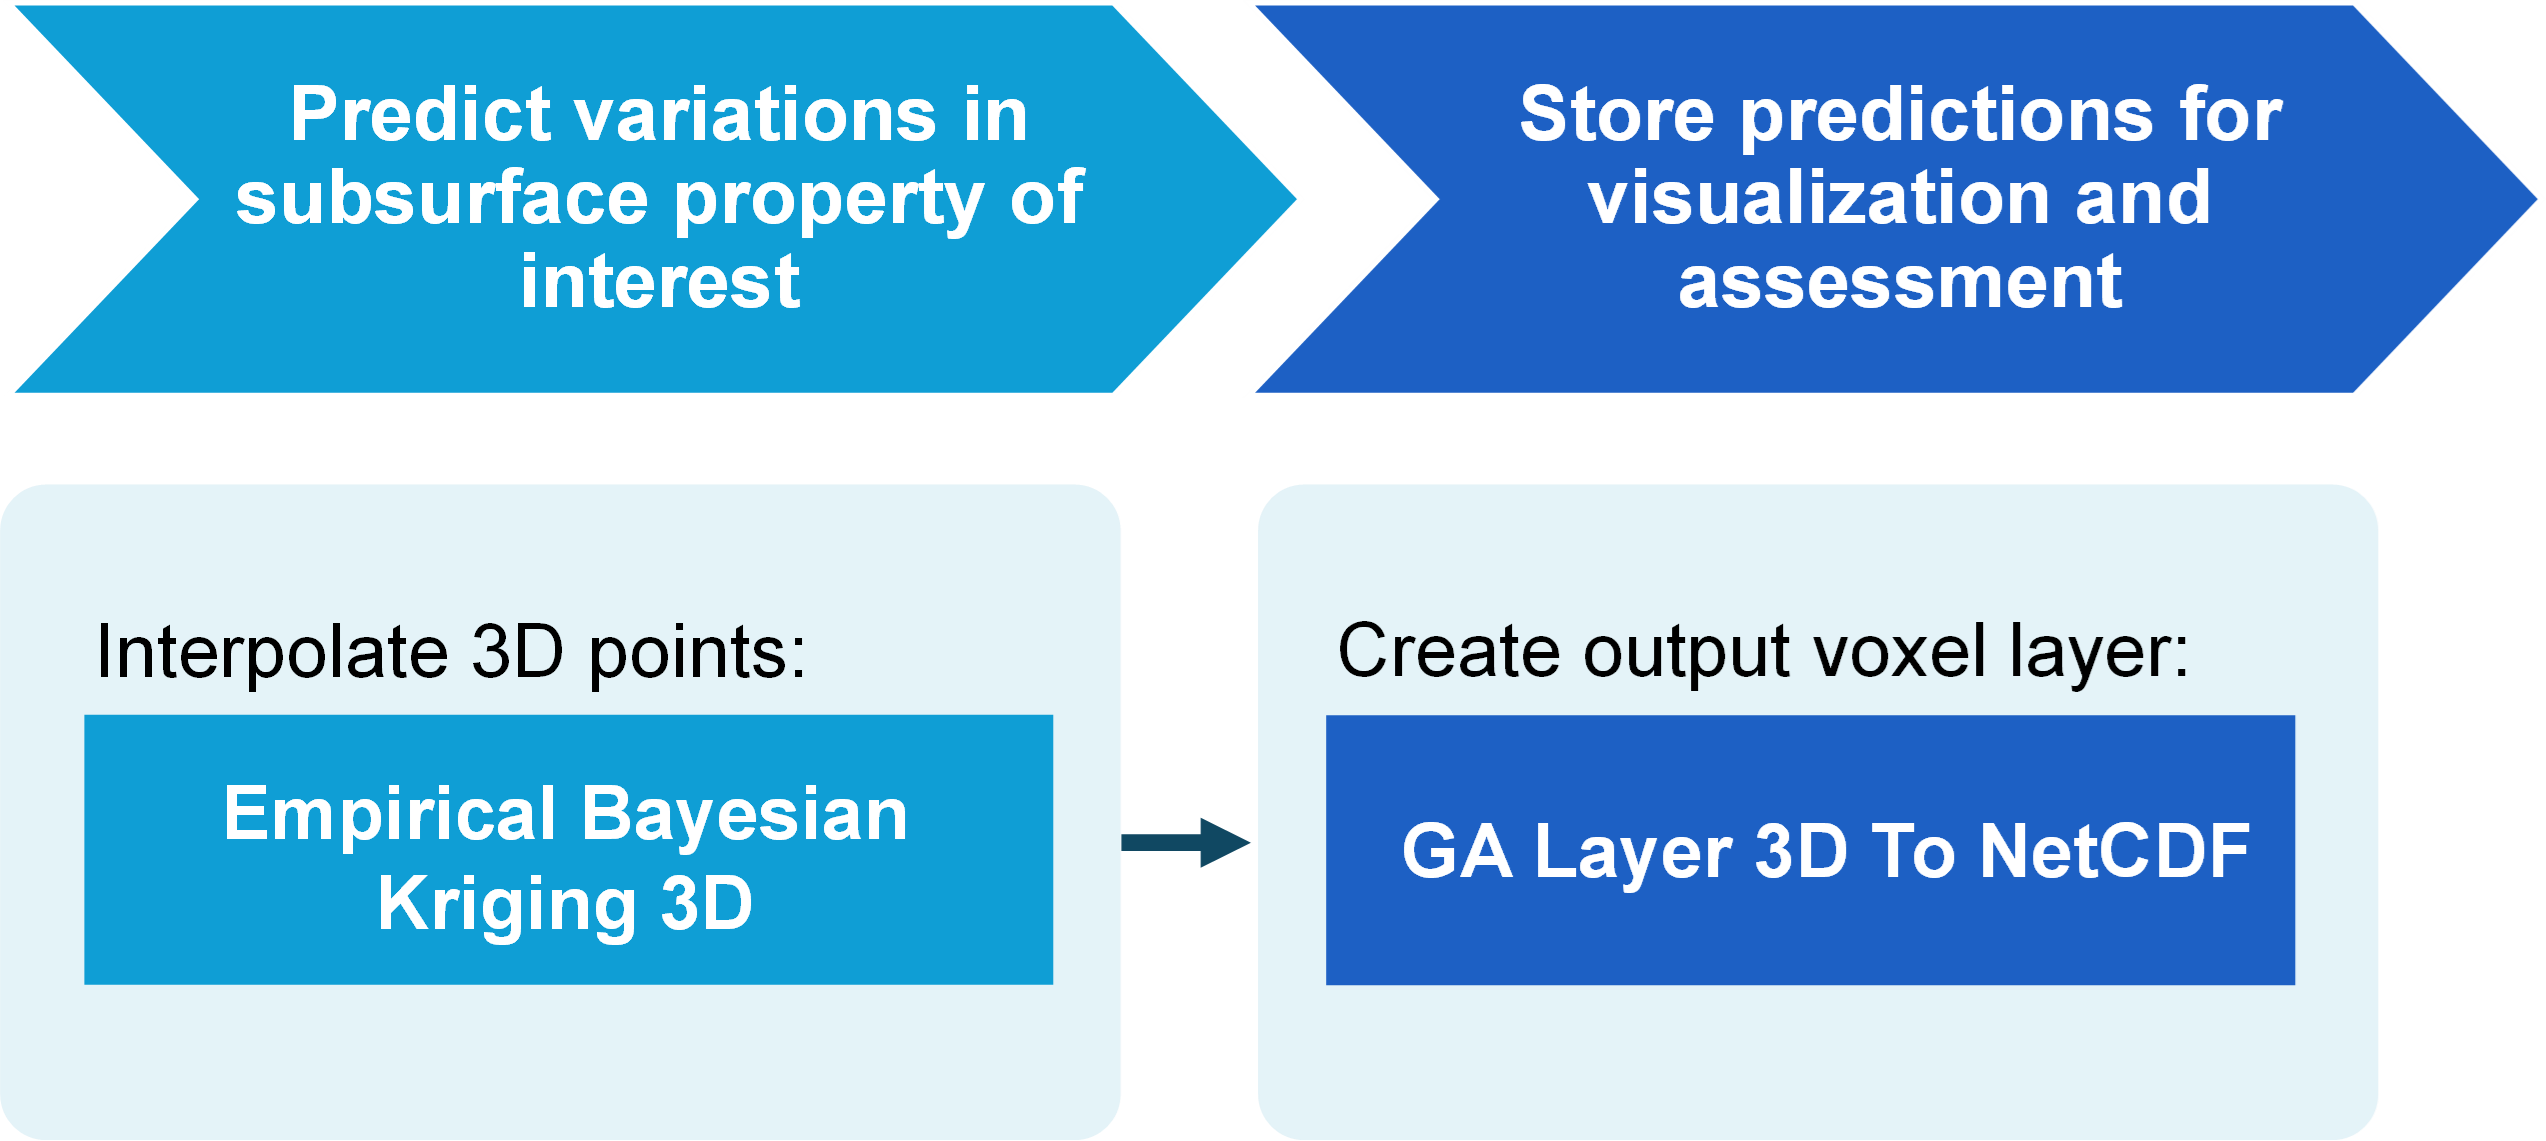
This involves, for example, calling two geoprocessing tools for each 3D point feature layer that lies within a given soil or rock layer. First, Empirical Bayesian Kriging 3D quantifies the spatial variation of undrained shear strength throughout the physical soil or rock layer. Then, GA Layer 3D To NetCDF outputs the interpolated data for visualization and assessment as a voxel layer. Optionally specifying a polygon when running GA Layer 3D To NetCDF ensures that the plan-view boundary of the voxel layer conforms to the project site.
If working with densely sampled 3D points, the GIS analyst might alternatively consider creating voxel layers using inverse distance weighting. Either way, elevation rasters can also be specified when creating the voxel layers so that they conform to the desired shapes.
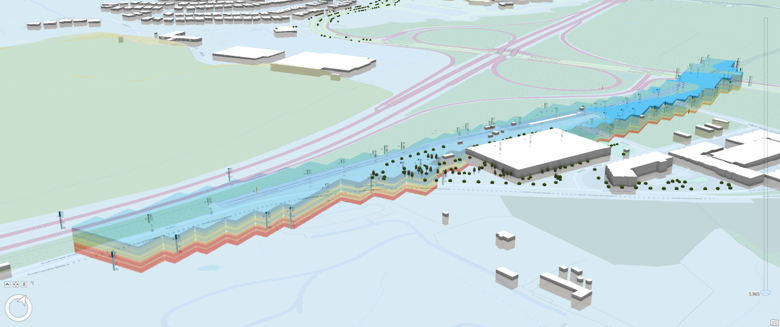
The GIS analyst further contextualizes the scene before sharing with other project stakeholders. This can include the use of 3D basemaps and engineering content such as the roadway corridor once it becomes available.
Share for project decision-makers
Sharing the scene to the web gives project decision-makers a convenient resource for assessing whether sufficient site data has been gathered to move forward with designing the roadbed. The project manager navigates the web scene, readily spotting any under-sampled subsurface zones. This includes visual assessment of the variations in undrained strength throughout the soil and rock layers. It also includes a review of the interpolated surfaces.
In this video, the project manager browses the web scene to assess spatial variations of soil and rock strength and to identify zones where additional subsurface data needs to be collected.
Using ArcGIS, the project manager decides whether to collect additional site data quickly, without having to pore over a 100-page PDF report of boring logs.
As the effort progresses, new borings may be taken, prompting the engineer to make incremental updates to the surfaces. The GIS analyst, in turn, uses ArcPy to automate the corresponding feature updates in the scene and web scene.
See BIM-GIS integration, geotech, and more in action at Autodesk University 2026
Join Esri and its partners at Autodesk University 2026 to learn about current and future directions for BIM-GIS integrations. We’ll explore how organizations connect BIM, CAD, and GIS to create a shared understanding of the built and natural world, both above and below ground.
From integrating design models with site context to managing geotechnical investigations in the field, these sessions highlight future directions and practical approaches for connecting project teams and workflows.
- When BIM and GIS Stay Connected: Esri and Autodesk’s Path to True Cloud Interoperability
- From Borehole to Building: Advanced Ground Modeling Directly in Civil 3D with GeoDin Ground
Acknowledgement
Thank you to GeoDin for the use of the geotechnical dataset. GeoDin develops software for capturing, managing, and visualizing subsurface data, including GeoDin Ground for building ground models directly in Autodesk Civil 3D and Esri ArcGIS. Get in touch with the GeoDin team to connect your borehole and geotechnical data to BIM and GIS workflows.





Article Discussion: