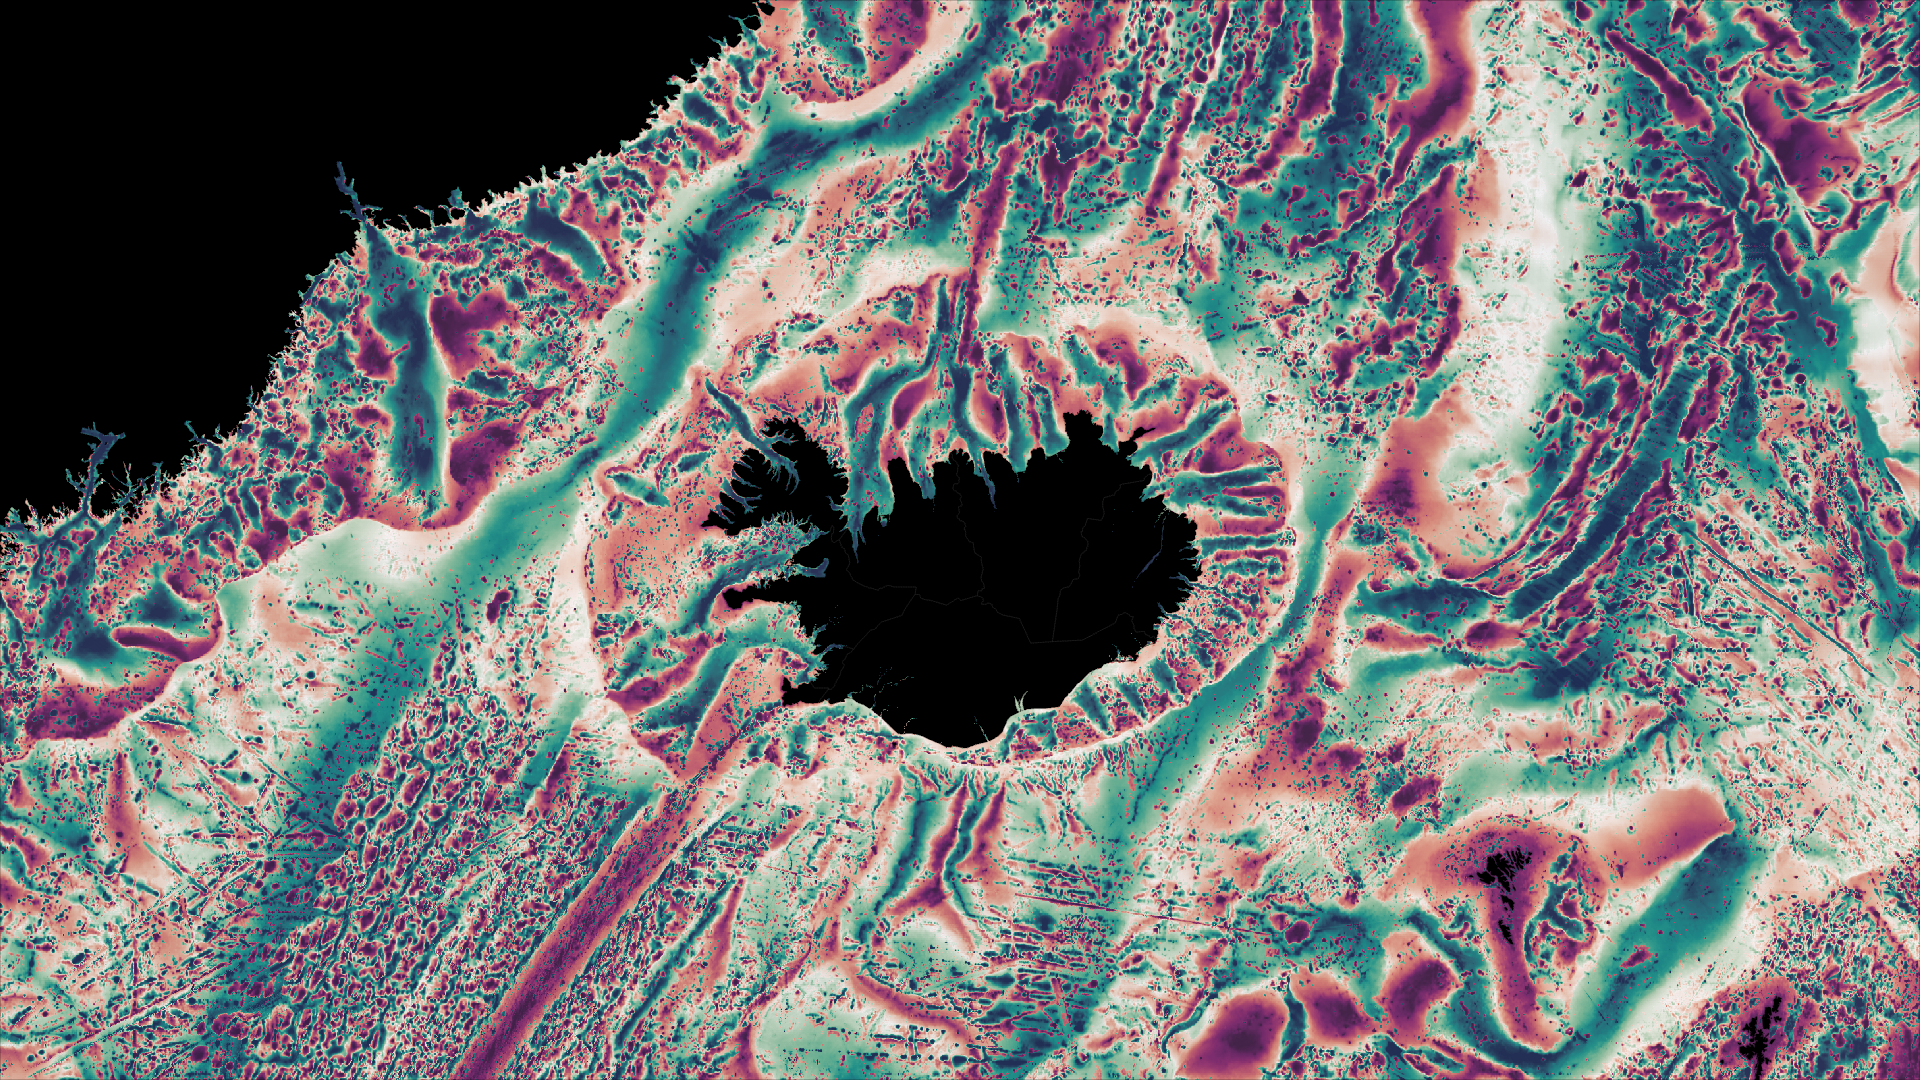
Understanding Ocean Processes Through Context and Scale
Climate, fisheries and deep-sea ecosystems all depend on the movement of heat, oxygen and nutrients throughout the global ocean. Yet these processes are not controlled uniformly across the seafloor. Instead, they are often regulated by relatively small but strategically important features such as straits, sills, ridges and channels that act as choke points in ocean circulation. These locations influence where deep water is ventilated, where oxygen reaches the abyss and where ecosystems can persist as environmental conditions change.
Identifying these control points is challenging because they rarely exist as isolated features. Their significance emerges through their relationship to the surrounding landscape and often becomes apparent only when examined across multiple spatial scales. Traditional single-scale analyses can overlook these relationships, leaving important oceanographic processes hidden within the complexity of the seafloor.
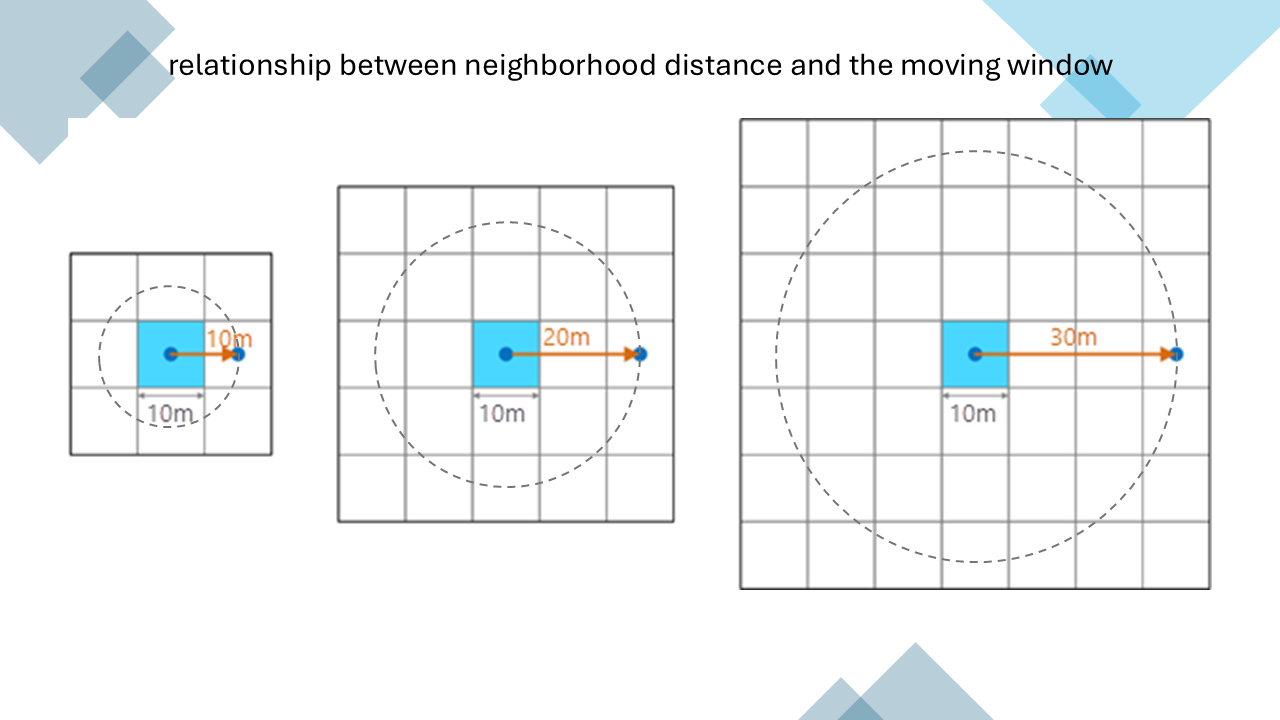
Recent multiscale surface analysis capabilities in ArcGIS Pro provide a new framework for exploring these relationships. By evaluating how features compare to their surroundings across a range of neighborhood distances, analysts can identify locations where the seafloor exerts disproportionate influence on ocean circulation and ecosystem dynamics.
The following three case studies illustrate how multiscale analysis can move beyond descriptive mapping and help reveal the underlying processes that shape the ocean.
Case Study 1: Identifying Multiscale Ocean Control Corridors
The Denmark Strait, located between Greenland and Iceland, serves as one of the primary gateways connecting the Arctic Ocean and the North Atlantic. Dense, cold and oxygen-rich waters flow through this passage before descending into the deeper Atlantic basin, contributing to large-scale ocean overturning circulation and deep-ocean ventilation.
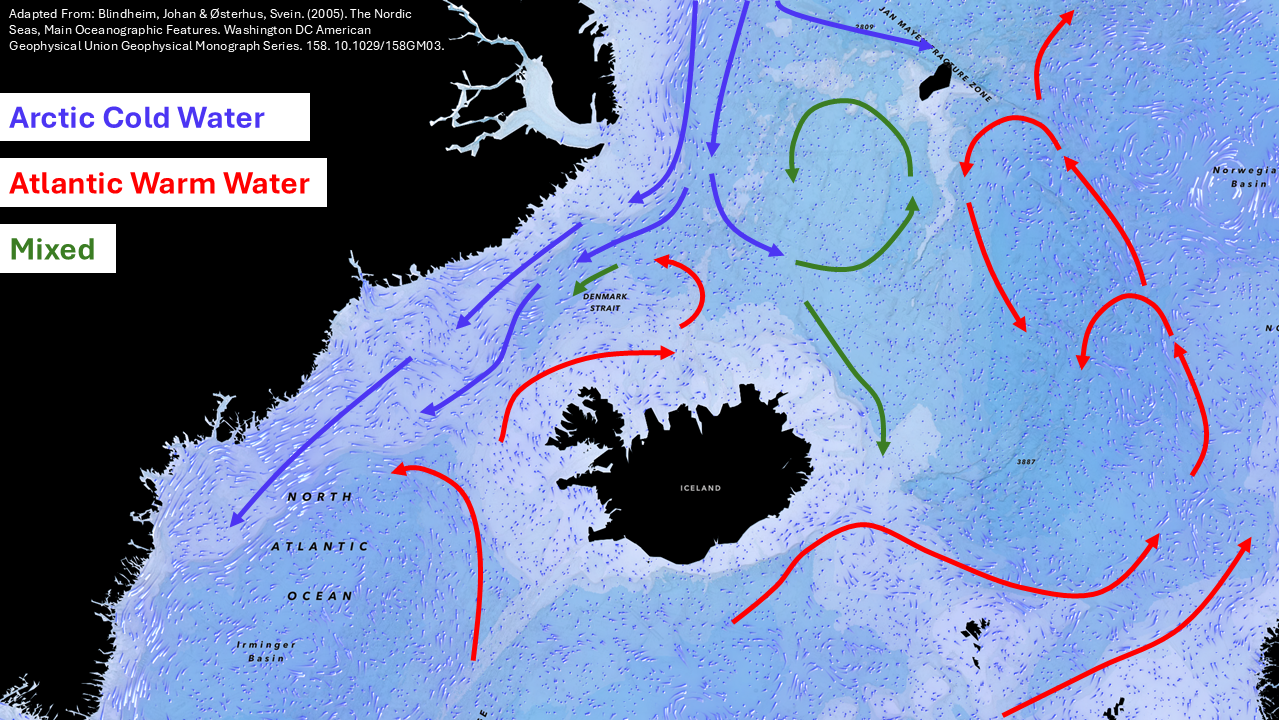
A common assumption is that these exchanges occur at a single geographic bottleneck. In reality, the controlling structure extends across a network of sills, depressions and channels that operate at multiple spatial scales. Understanding this larger system requires an analytical approach capable of identifying features that stand out relative to their surroundings, regardless of the scale at which they emerge.
Using the Multiscale Surface Percentile tool in ArcGIS Pro, bathymetric values were evaluated across a range of neighborhood distances. At each scale, the tool calculates the percentile rank of each cell relative to neighboring cells and preserves the most extreme result observed across all scales. This approach identifies locations that are unusually high or low compared with their surroundings.
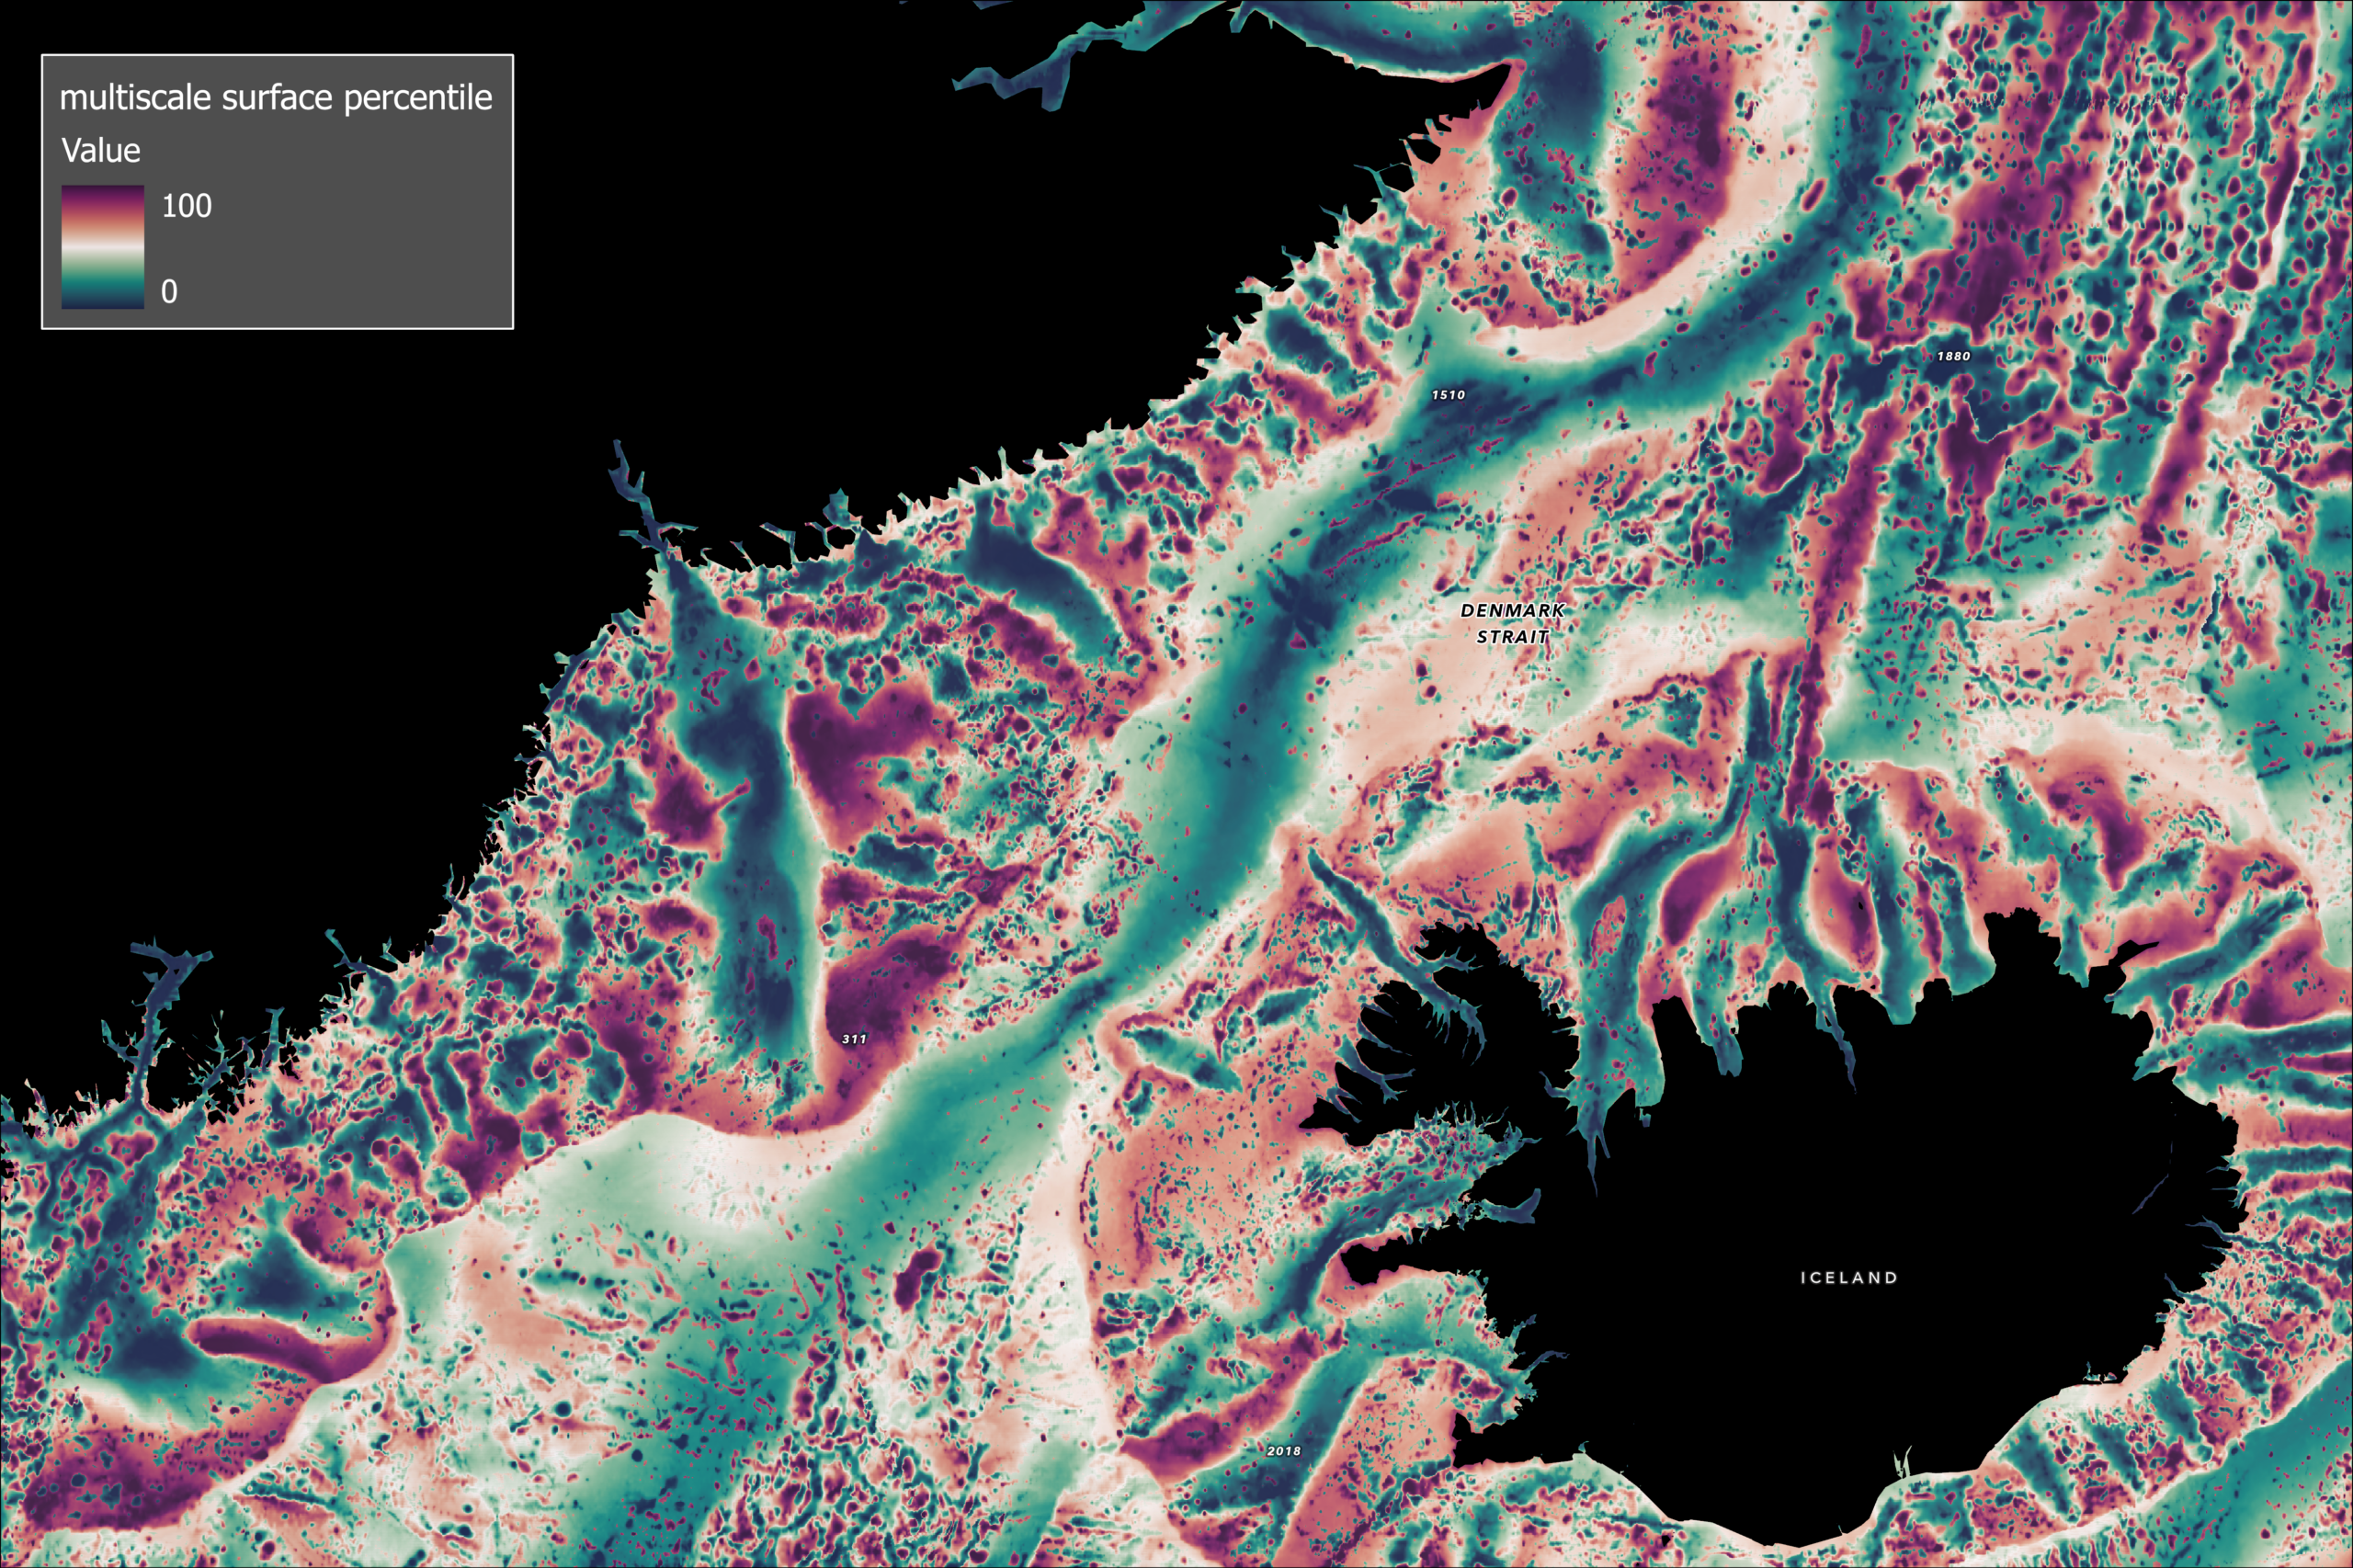
The resulting map reveals a connected pathway of bathymetric features extending through the Denmark Strait. Rather than highlighting depth alone, the analysis identifies portions of the seafloor that become dominant features when viewed within their broader spatial context. The sill-and-channel system emerges clearly as a multiscale control corridor that regulates water exchange between ocean basins.

When compared with the Strait of Gibraltar, a very different pattern emerges. While Gibraltar also functions as a gateway, the analysis reveals a more homogeneous and less complex structural signature. This comparison demonstrates how multiscale percentile analysis can distinguish fundamentally different oceanographic settings based on the relationship between local features and their surrounding environment.
The key insight is that important oceanographic features are often defined not by their absolute values, but by how unusual they appear relative to their surroundings. Context creates significance.
Case Study 2: Revealing Where the Seafloor Forces Ocean Circulation
While the first case study identifies where seafloor features stand out, the next question is whether those features influence ocean movement.
To explore this relationship, the same bathymetric surface was analyzed using the Multiscale Surface Difference tool. Rather than ranking values, this tool measures how far a location differs from the local average at each scale and records the greatest difference observed across all evaluated neighborhoods.
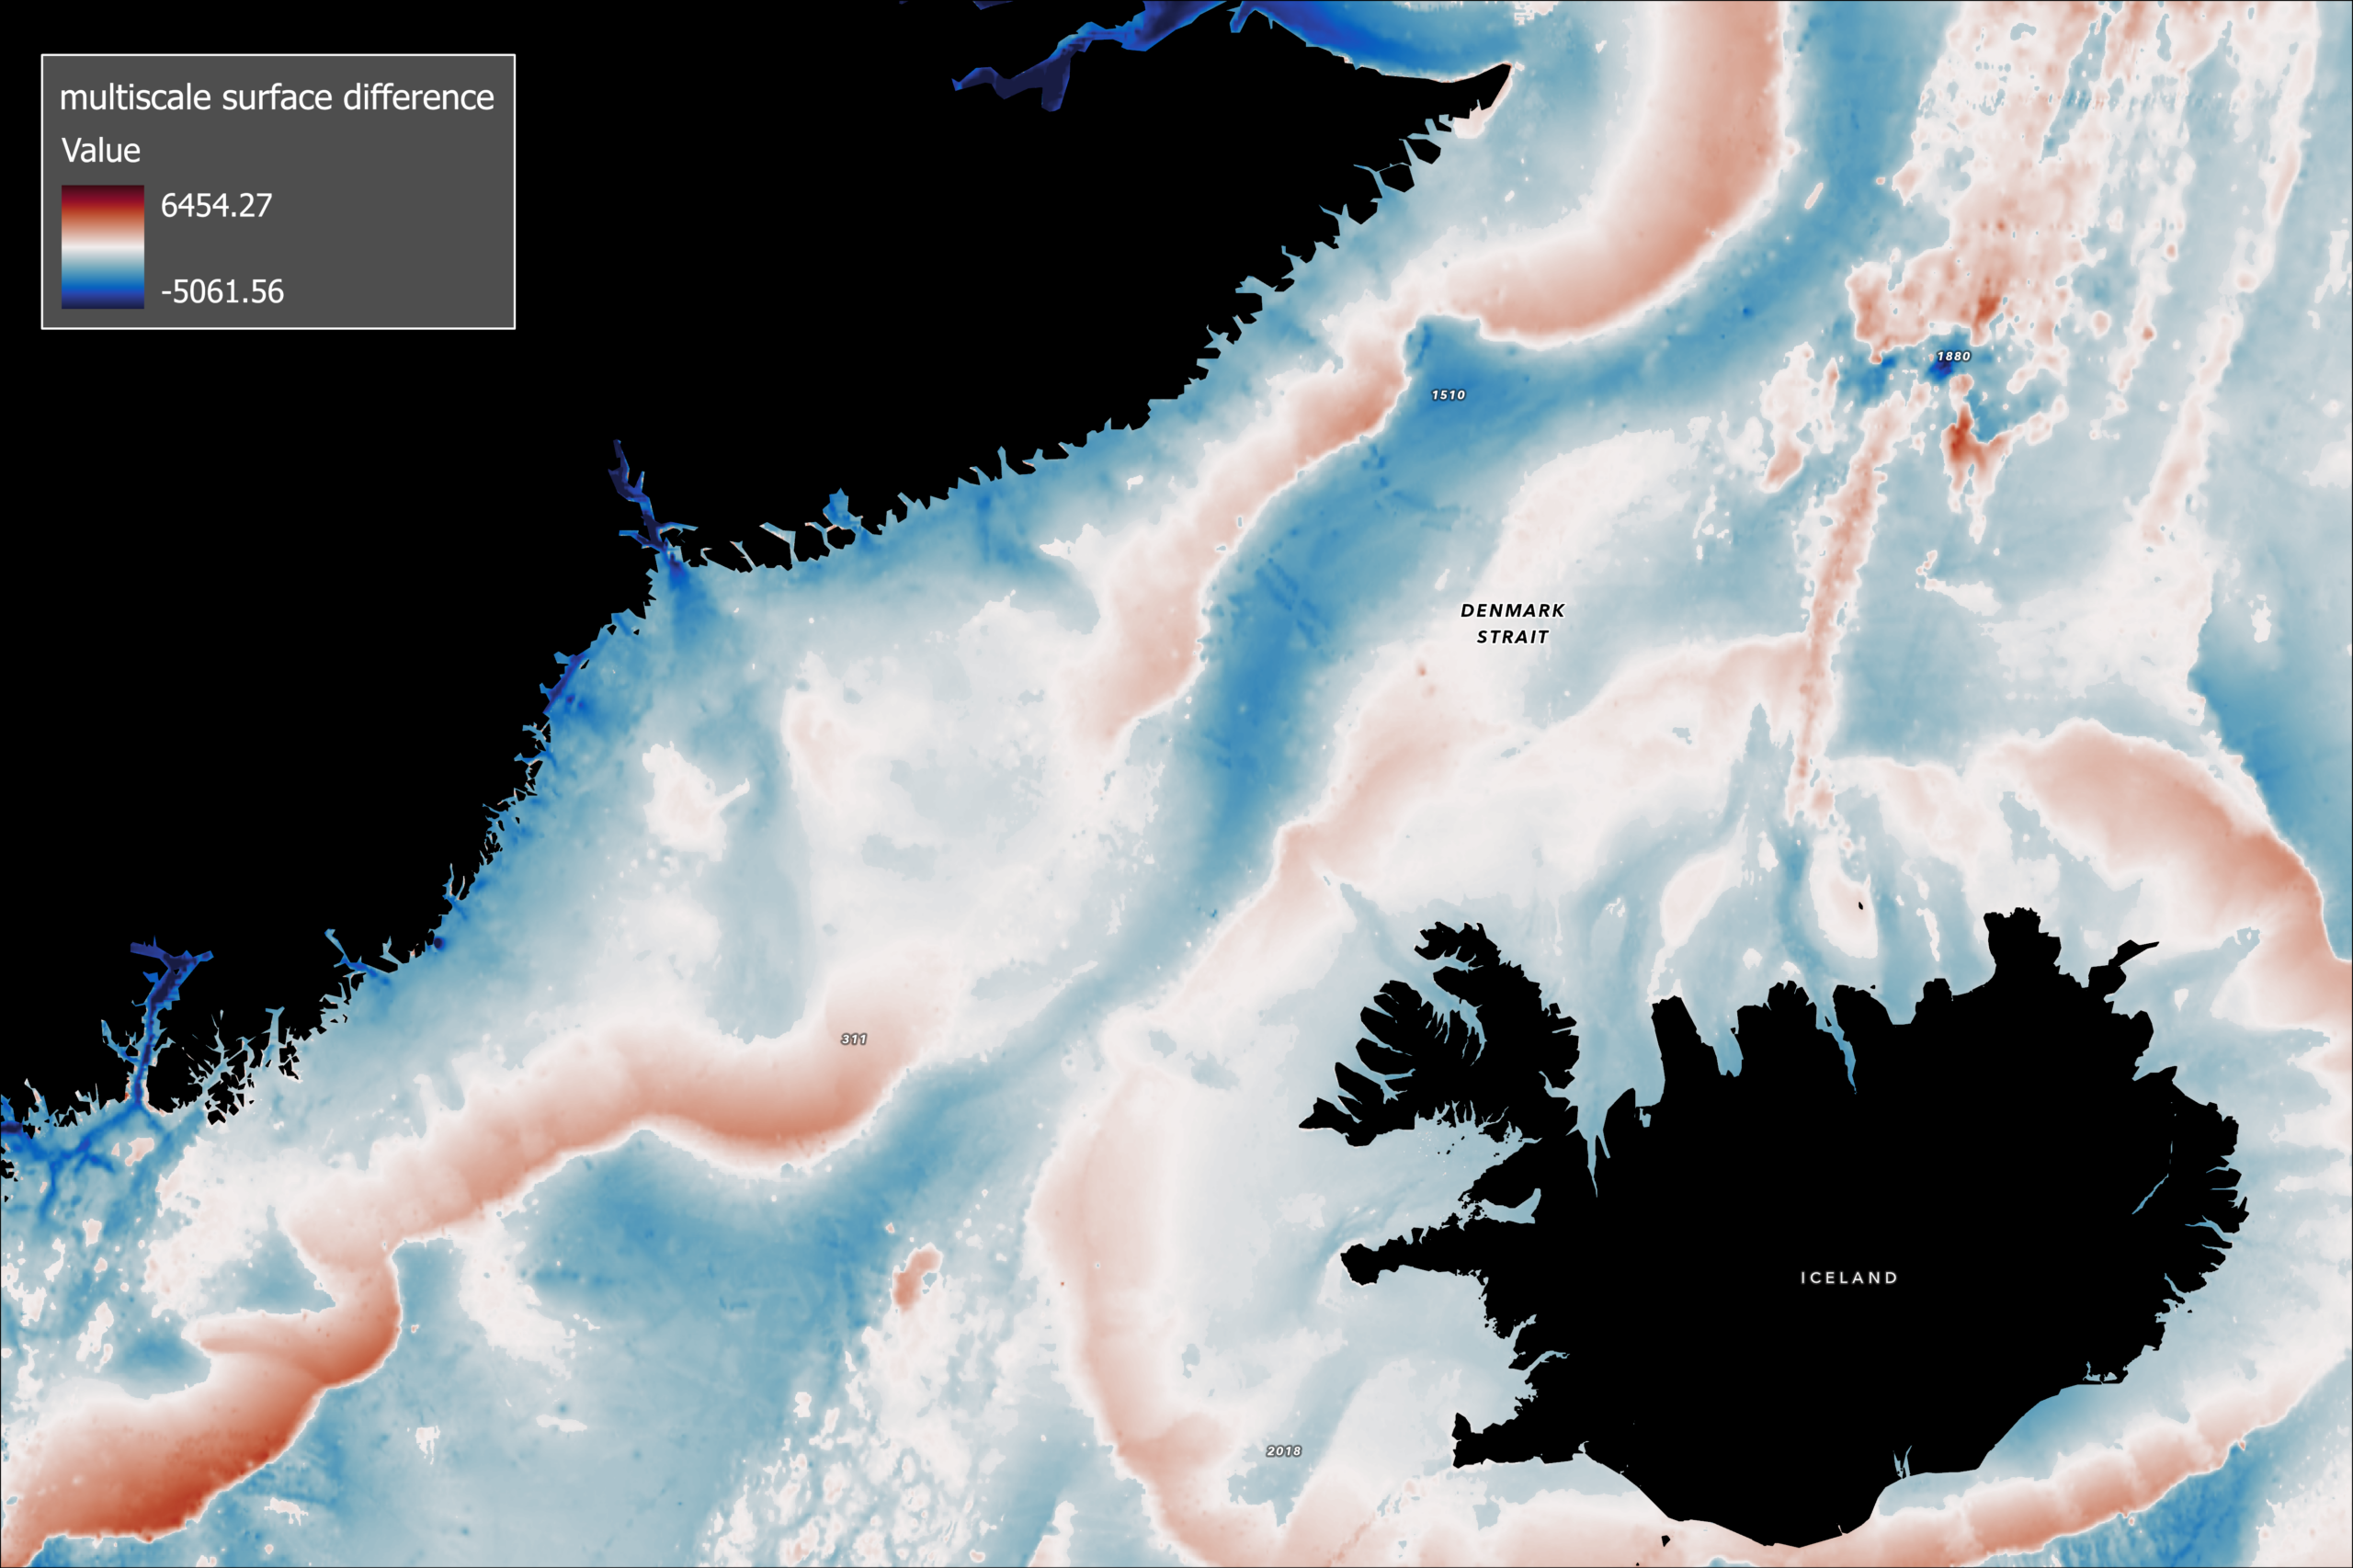
The resulting surface highlights areas of strong bathymetric contrast. In the Denmark Strait, these contrasts correspond to steep slopes, channel systems and sill structures that strongly influence the movement of water masses. Areas where dense Arctic waters accelerate, descend and mix with surrounding waters become immediately apparent.
Viewed through this lens, the output is no longer simply a map of depth. Instead, it can be interpreted as a map of potential hydraulic forcing. The analysis reveals locations where the shape of the seafloor contributes to the acceleration, redirection and concentration of ocean flow.
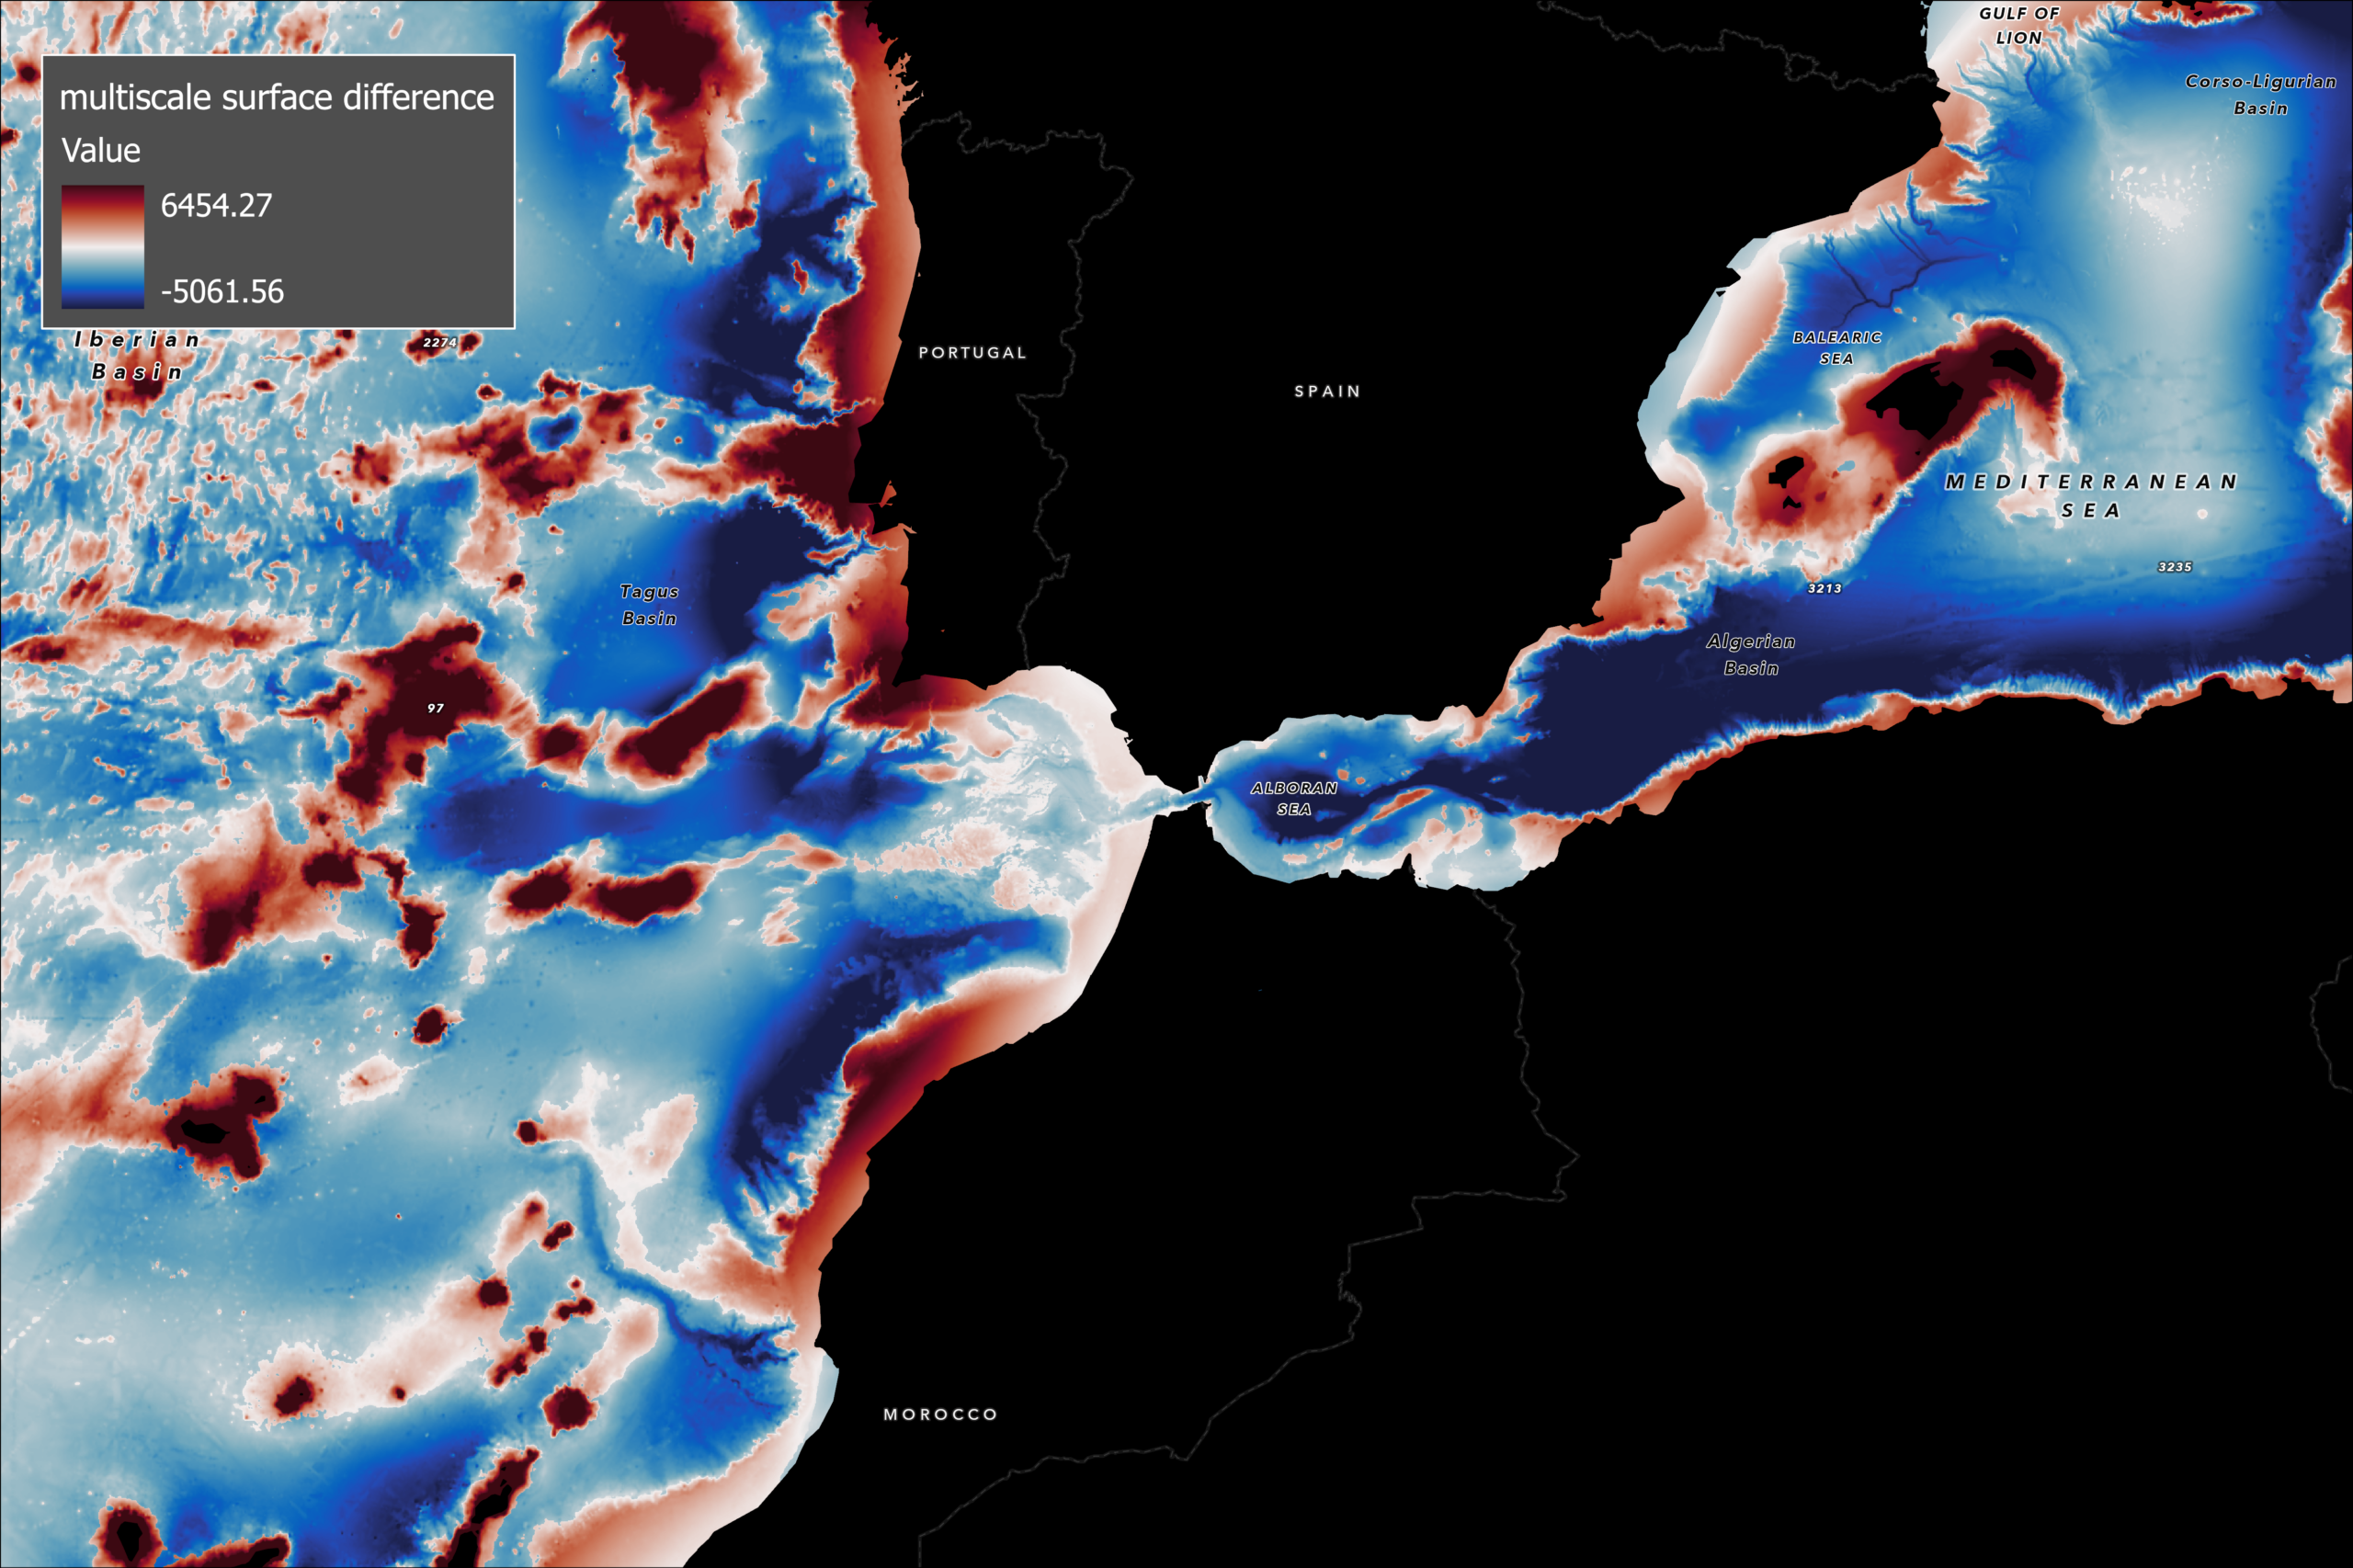
Once again, comparison with the Strait of Gibraltar demonstrates how different ocean gateways produce different forcing patterns. Whereas the Denmark Strait is characterized by deep overflow and pronounced topographic forcing, Gibraltar exhibits a more complex exchange of water masses at intermediate depths. Despite these differences, both locations reveal controlling structures that become visible only through a multiscale perspective.
Together, the first two case studies demonstrate a progression from identifying important seafloor structures to understanding how those structures influence physical ocean processes.
Case Study 3: Linking Seafloor Structure to Deep-Ocean Ventilation
The first two analyses focused on geomorphology. The third case study shifts attention to the environmental consequences of those physical structures.
For this analysis, a global bottom-water oxygen dataset from BioOracle was examined using the Multiscale Surface Deviation tool. Oxygen is a fundamental indicator of deep-ocean health and plays a critical role in sustaining benthic and pelagic ecosystems. Without periodic replenishment, oxygen levels in deep basins can decline as biological processes consume available dissolved oxygen.
The Multiscale Surface Deviation tool identifies locations where values differ significantly from both the neighborhood average and the expected variability within that neighborhood. By standardizing differences relative to local variability, the tool reveals locations where environmental conditions behave unusually relative to their surroundings.
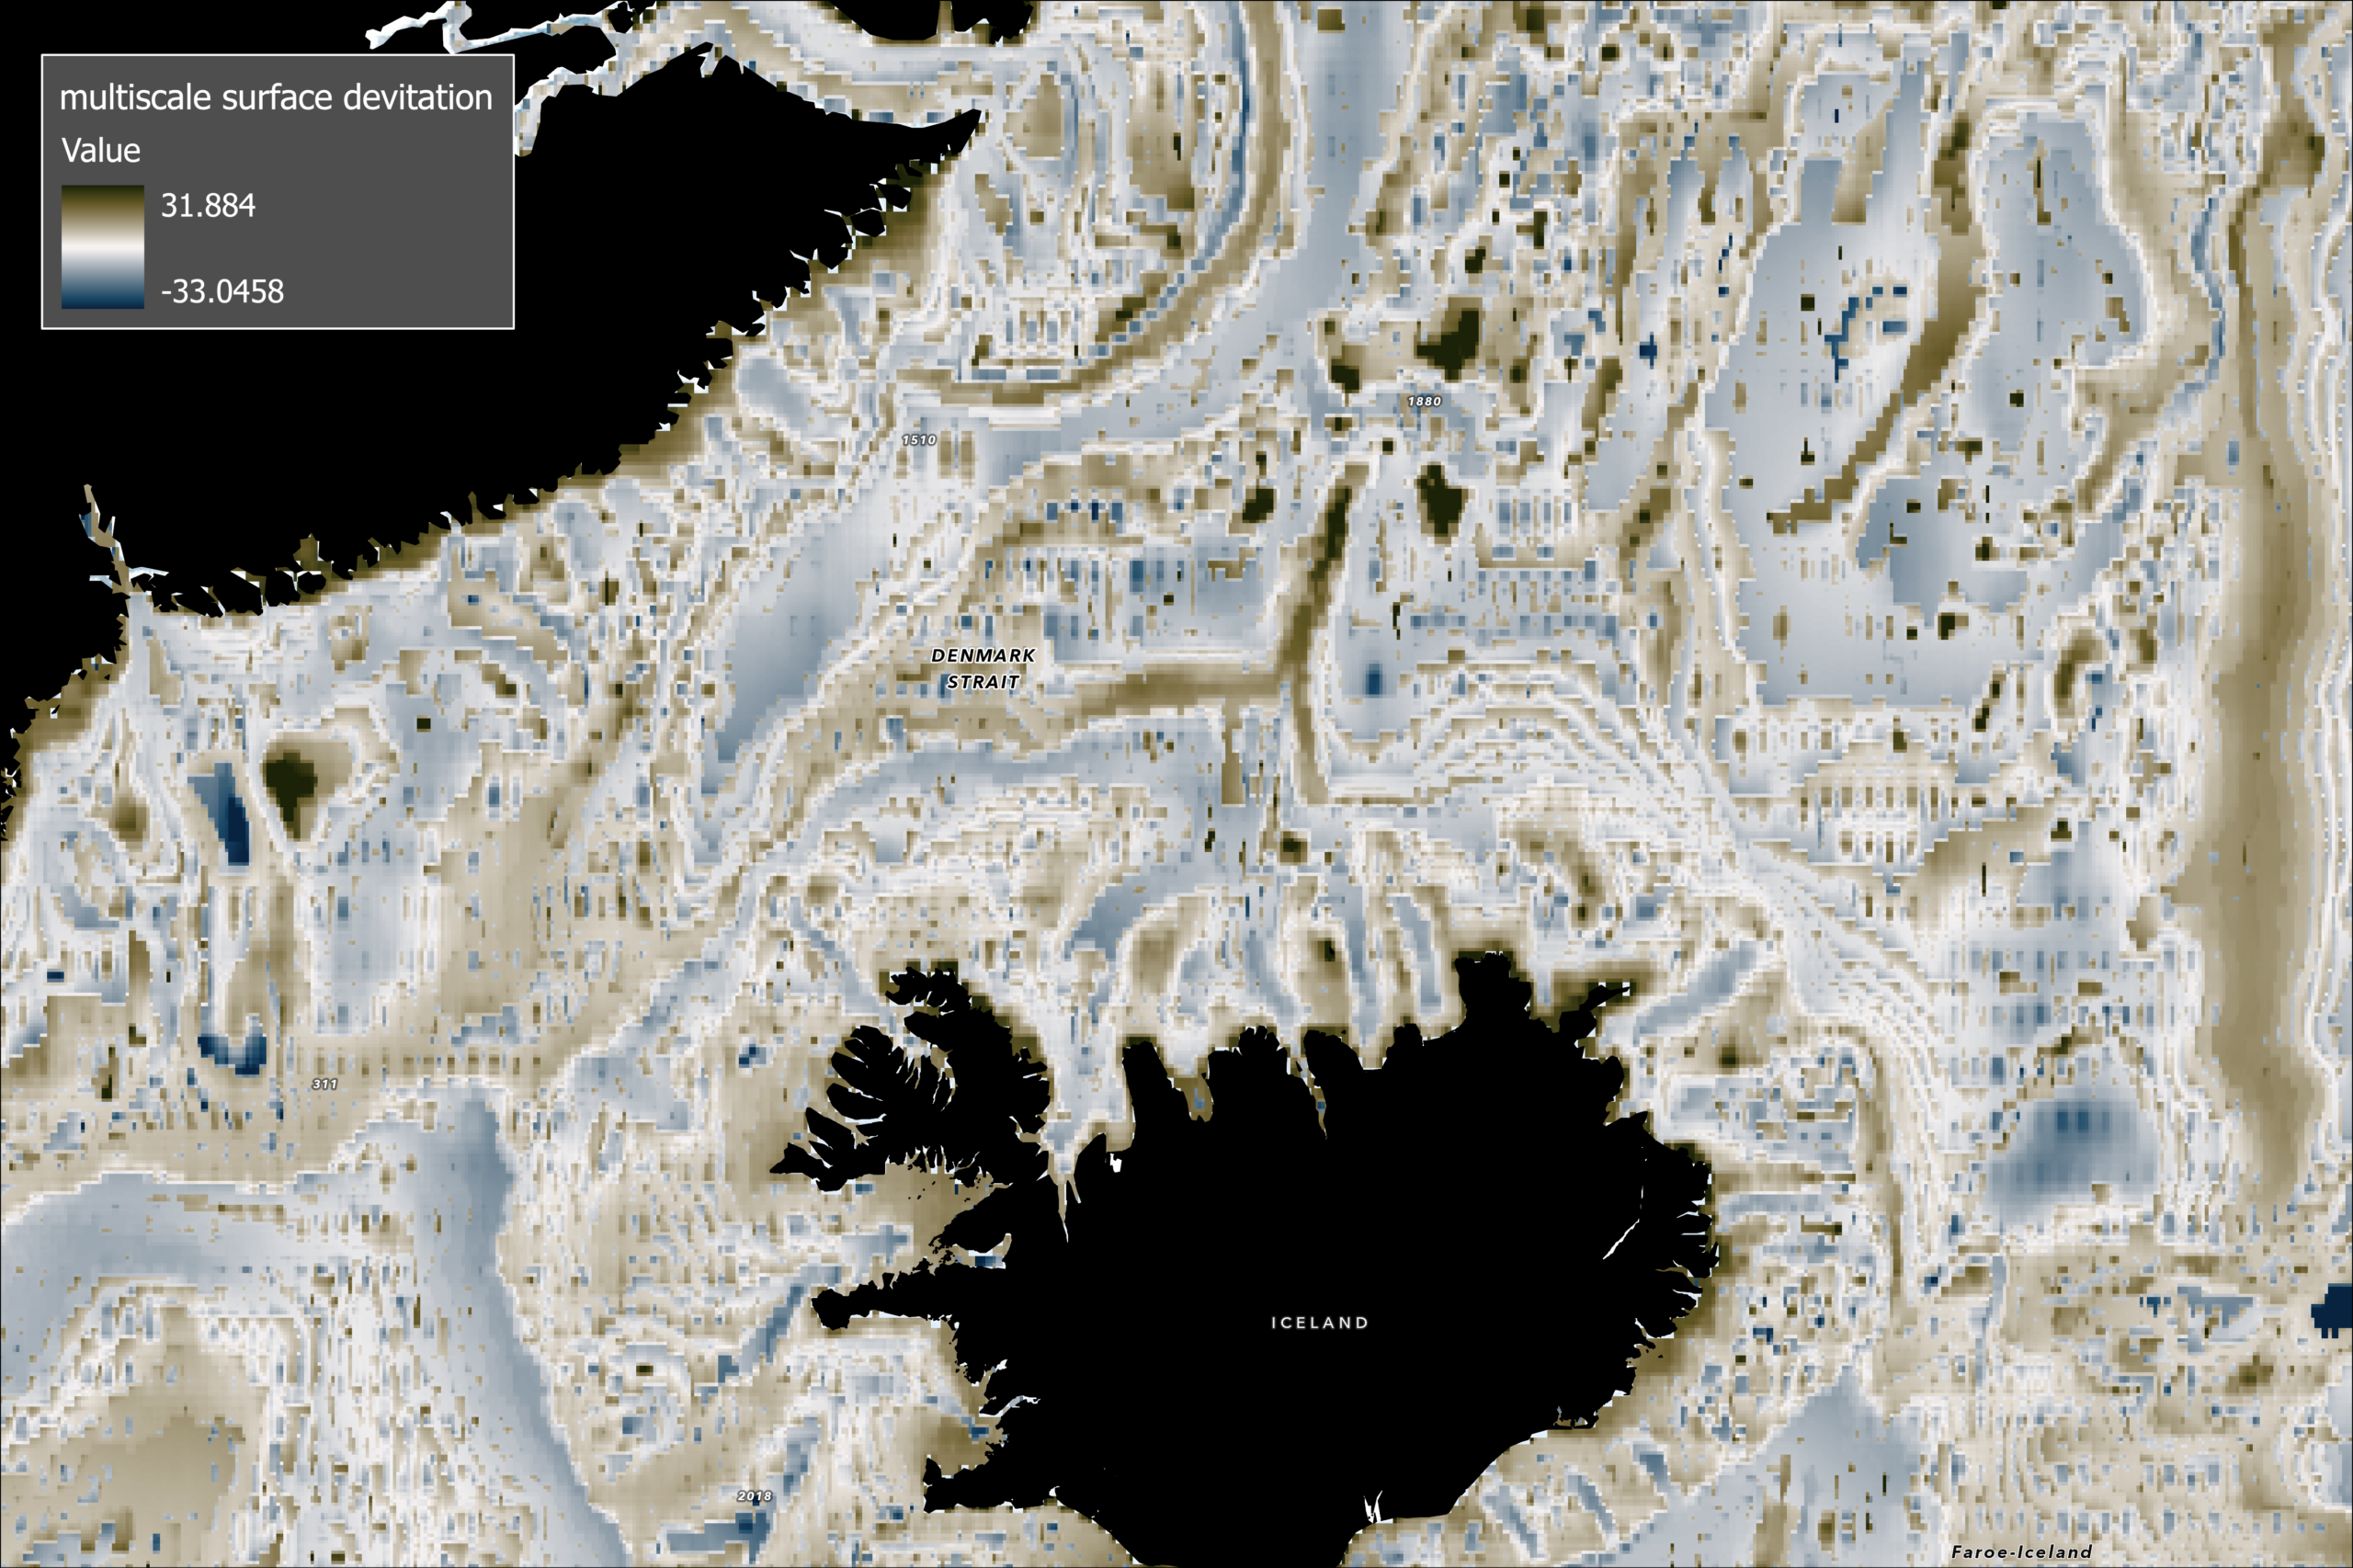
Applied to bottom-water oxygen, the analysis highlights distinct ventilation pathways downstream of the Denmark Strait. These pathways correspond to areas where oxygen-rich Arctic waters appear to be injected into deeper portions of the Atlantic Ocean. Instead of simply mapping oxygen concentrations, the analysis helps reveal the mechanisms through which oxygen is distributed throughout the deep ocean.
The results also provide an important ecological perspective. Areas that receive periodic injections of oxygen-rich water can support biological communities that would otherwise be constrained by declining oxygen availability. In this sense, the same geomorphic features identified in the previous case studies may also help shape patterns of ecosystem distribution and resilience.
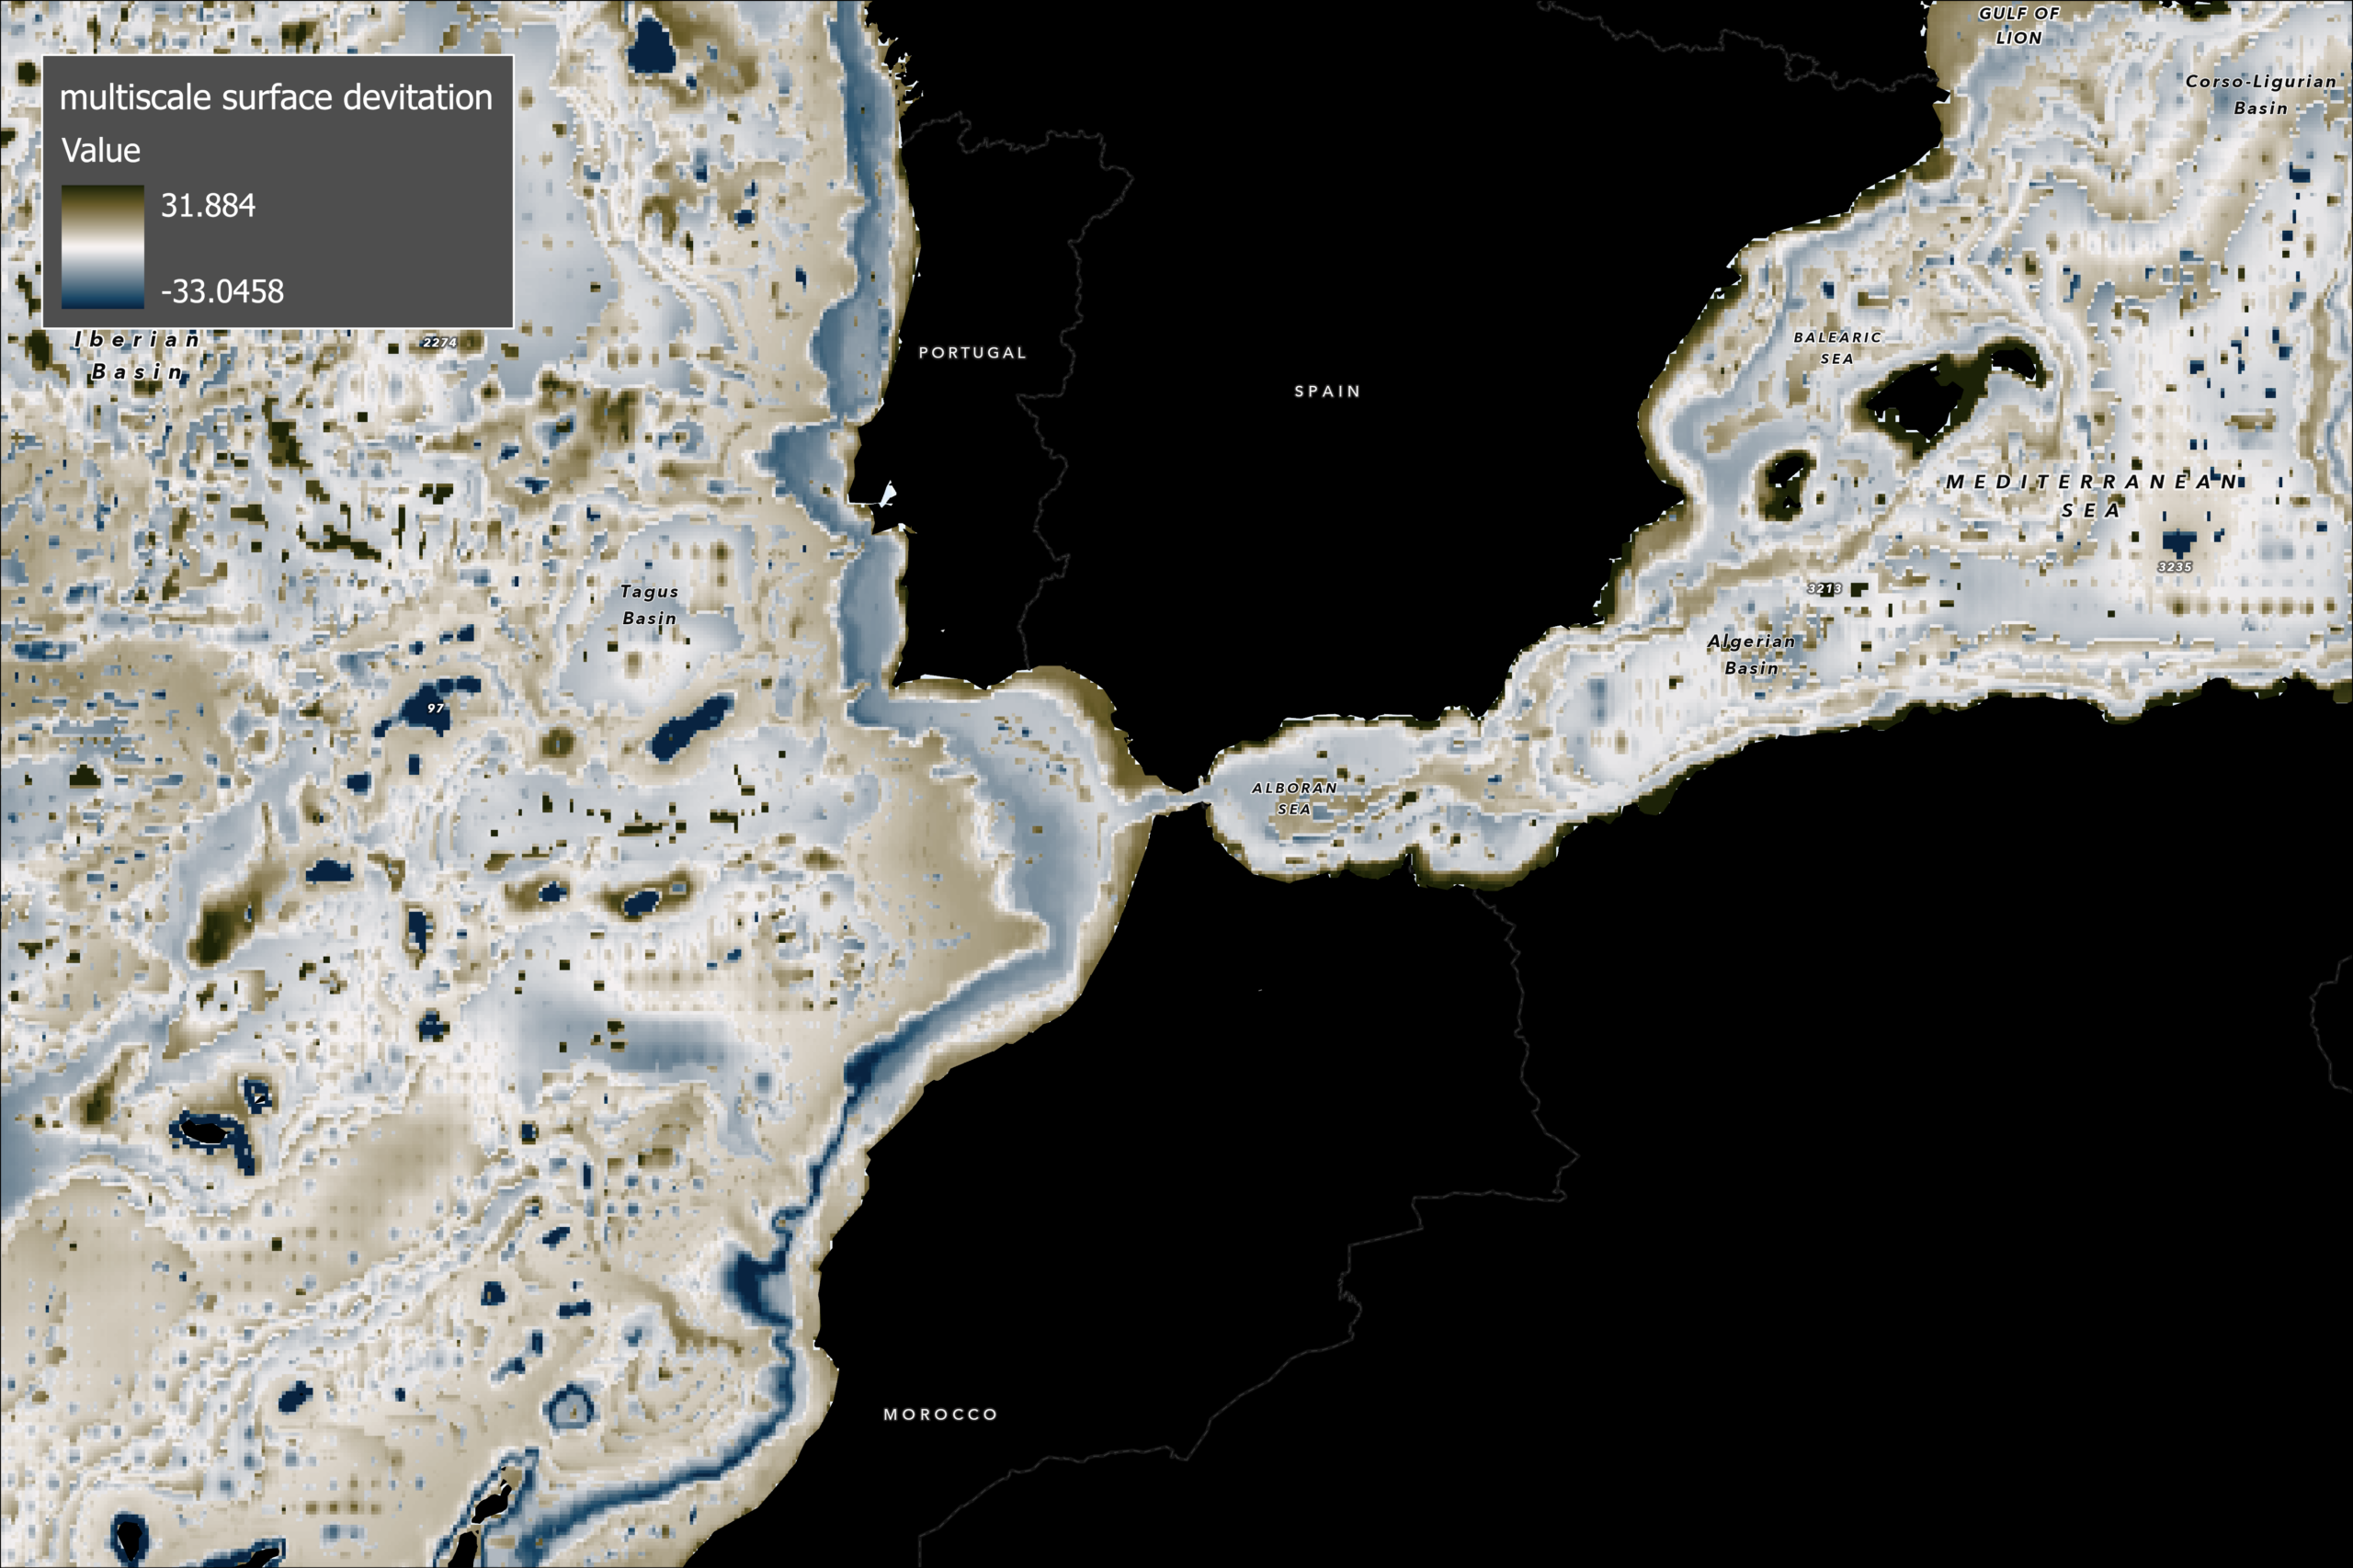
When compared with the Strait of Gibraltar, the oxygen patterns appear substantially more uniform. Although Gibraltar remains an important ocean gateway, the variability in oxygen distribution is less pronounced than in the Denmark Strait system, further emphasizing the unique role played by deep-water overflow processes in the North Atlantic.
This final case study demonstrates how multiscale analysis can connect physical structure to environmental function, revealing processes that would be difficult to detect using conventional approaches.
From Seafloor Structure to Ocean Understanding
Taken together, these three case studies illustrate a progression from structure to process.
The first case study identified where seafloor features become significant relative to their surrounding context.
The second revealed where those features influence ocean circulation.
The third showed how that circulation pathways affect environmental conditions that are critical to deep-sea ecosystems.
More broadly, the analyses demonstrate the value of examining data across multiple spatial scales rather than selecting a single analysis distance. Many environmental processes are inherently multiscale, and their controlling mechanisms often emerge only when viewed within the appropriate spatial context.
Although these examples focus on oceanography, the underlying approach is applicable far beyond marine environments. Similar multiscale methods can be used to investigate terrain, weather, ecological systems and urban landscapes—any setting where context and scale influence patterns and processes.
As geospatial analysis continues to evolve, the goal is no longer simply to map where things are. Increasingly, the objective is to understand why systems behave the way they do. Multiscale surface analysis provides a powerful framework for making that transition, helping analysts move from visualization toward explanation and from patterns toward process.
References
Evaluating metrics of local topographic position for multiscale geomorphometric analysis: https://www.sciencedirect.com/science/article/abs/pii/S0169555X18301508
Bathymetry (SRTM) layer reference: https://topex.ucsd.edu/WWW_html/srtm15_plus.html
BioOracle for oxygen: https://www.bio-oracle.org/downloads-to-email.php

Article Discussion: