Understanding the complexity of a terrain surface is essential in wildlife habitat suitability modeling, and rugosity indices are useful to measure it. While custom script tools have filled this gap in the past in the ArcGIS community, ArcGIS Pro 3.7 now provides a built-in solution: the new Surface Area Ratio tool in the Spatial Analyst toolbox enables you to calculate rugosity indices directly from any input surface raster; no custom scripting required.
What you can do with the Surface Area Ratio tool
The tool calculates a surface area ratio by dividing the 3D surface area by the planar area at each input cell location. The 3D surface area for each cell is determined using the triangular approach in Jenness, 2004.
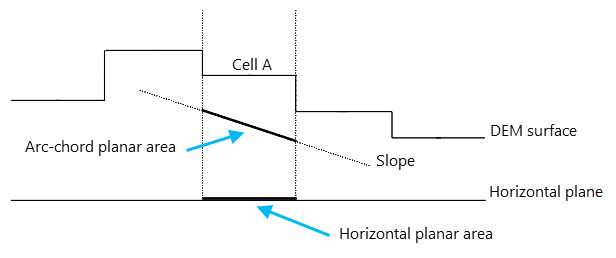
You can choose between two types of planar area, the horizontal planar area and the arc-chord planar area, through the Planar Area Type parameter. With the horizontal planar area type, the planar area is the cell area of the input raster on a horizontal plane. With the arc-chord planar area type, instead of using the cell area on a horizontal plane directly, it projects the cell area on the local slope of a 3 by 3 neighborhood. Thus, the output surface area ratio removes the effect of the local slope, which is known as the arc-chord ratio rugosity index (Du Preez, 2015).
The following figure is a cross-section view of a DEM surface, centered at Cell A. It shows how the horizontal planar area and arc-chord planar area of Cell A are determined in a 3 by 3 neighborhood, and what their differences are.
Besides the Input Surface Raster and the Planar Area Type parameters, don’t forget to specify the Z Unit parameter to ensure the correct calculation of the 3D area for each cell—if you don’t specify, the tool by default assumes meters.
The optional Output Surface Area Raster parameter allows you to save the 3D surface areas at each cell location as a separate raster.
An example: bathymetry data
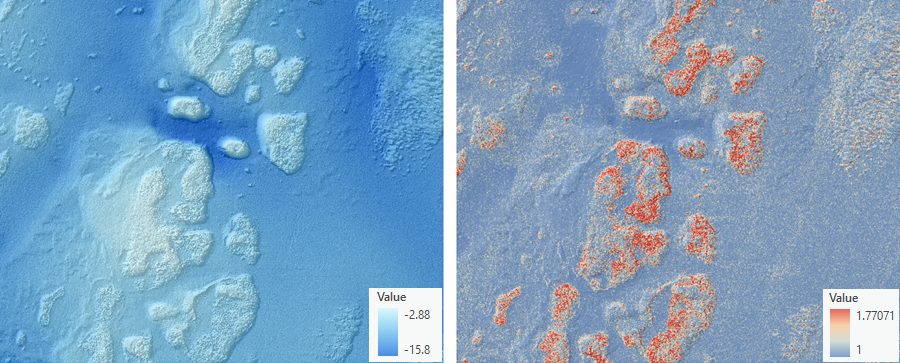
A common application of rugosity is in the ocean sciences to measure the complexity of the surface of the seafloor in bathymetric data. Below are examples of the input bathymetry data (left) and the output rugosity raster layer (right) created by the tool using the arc-chord planar area type. The bathymetry data is in a 1-meter resolution representing the seafloor terrain near the Florida Keys area. On the output raster layer, blue color represents smooth areas (with cell values near 1). The orange to red color represents areas of higher rugosity, with values greater than 1. Higher rugosity points to areas with coral reefs, which are an important habitat for marine wildlife.
Learn more
For more information on how the tool works, visit How Surface Area Ratio works.
References
Jenness, Jeff S. 2004. Calculating landscape surface area from digital elevation models. Wildlife Society Bulletin 32 (3): 829-839
Du Preez, C., 2015. A new arc–chord ratio (ACR) rugosity index for quantifying three-dimensional landscape structural complexity. Landscape Ecology, 2015, 30, 181–192.
U.S. Coastal Lidar Elevation Data – Including The Great Lakes And Territories, 1996 – Present. Office for Coastal Management, 2026. https://www.fisheries.noaa.gov/inport/item/48242.


Article Discussion: