When building elevation-derived hydrography workflows, knowing exactly where channels and dams sit on the landscape is critical—ArcGIS Pro 3.7 now gives you a direct way to find them.
The new Top Hat Transform tool, added to the Surface toolset in the Spatial Analyst toolbox, extracts these structures straight from an elevation raster. It applies top hat transformations (Rodriguez et al, 2002) on the input surface raster and creates an output raster that records the height or depth of the spatial structures at each cell location.
Extract ridges and valleys
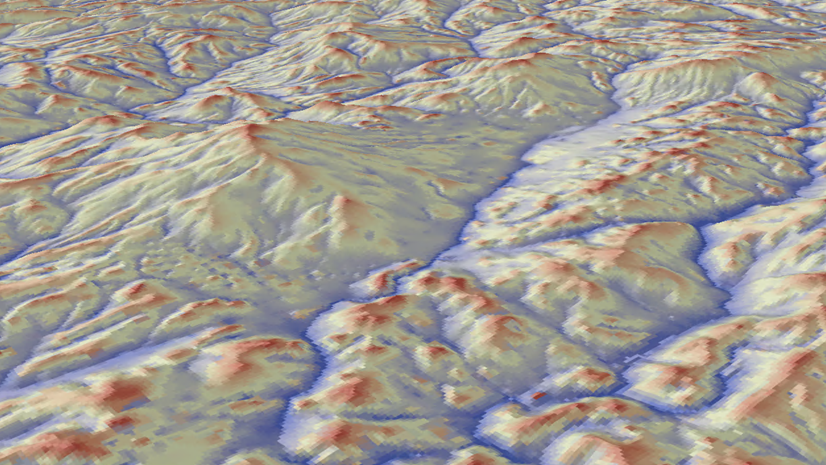
Ridges and valleys are common landforms on elevation surfaces. On high-resolution (such as 1-meter cell size) digital elevation models (DEMs), various hydrographic features, such as dams, small streams, and water channels, are also captured in precise detail. The following is a 3D view of a 1-meter resolution DEM near the Congaree National Park in South Carolina, showing various landforms along with the hydrographic features:
The Top Hat Transform tool supports extracting two types of structures, which correspond to the two options in the Analysis Type parameter—Ridge and Valley. With the Ridge analysis type, the structures that are taller than their surroundings (such as mountain ridges, dams, and bridges) are extracted. With the Valley analysis type, the structures that are lower than their surroundings (such as narrow channels and valleys) are extracted.
Control the size and width of the spatial structures
You can control the shape and size of the structures that the tool will detect by defining the input neighborhood. In general, the size or width of the objects detected by the tool is smaller than the size of the input neighborhood. By specifying a small input neighborhood (such as 3 by 3 or 9 by 9), the tool will not only run fast but also identify narrow structures (such as channels or dams) to represent the positions of the hydrographic features.
An example with hydrographic features
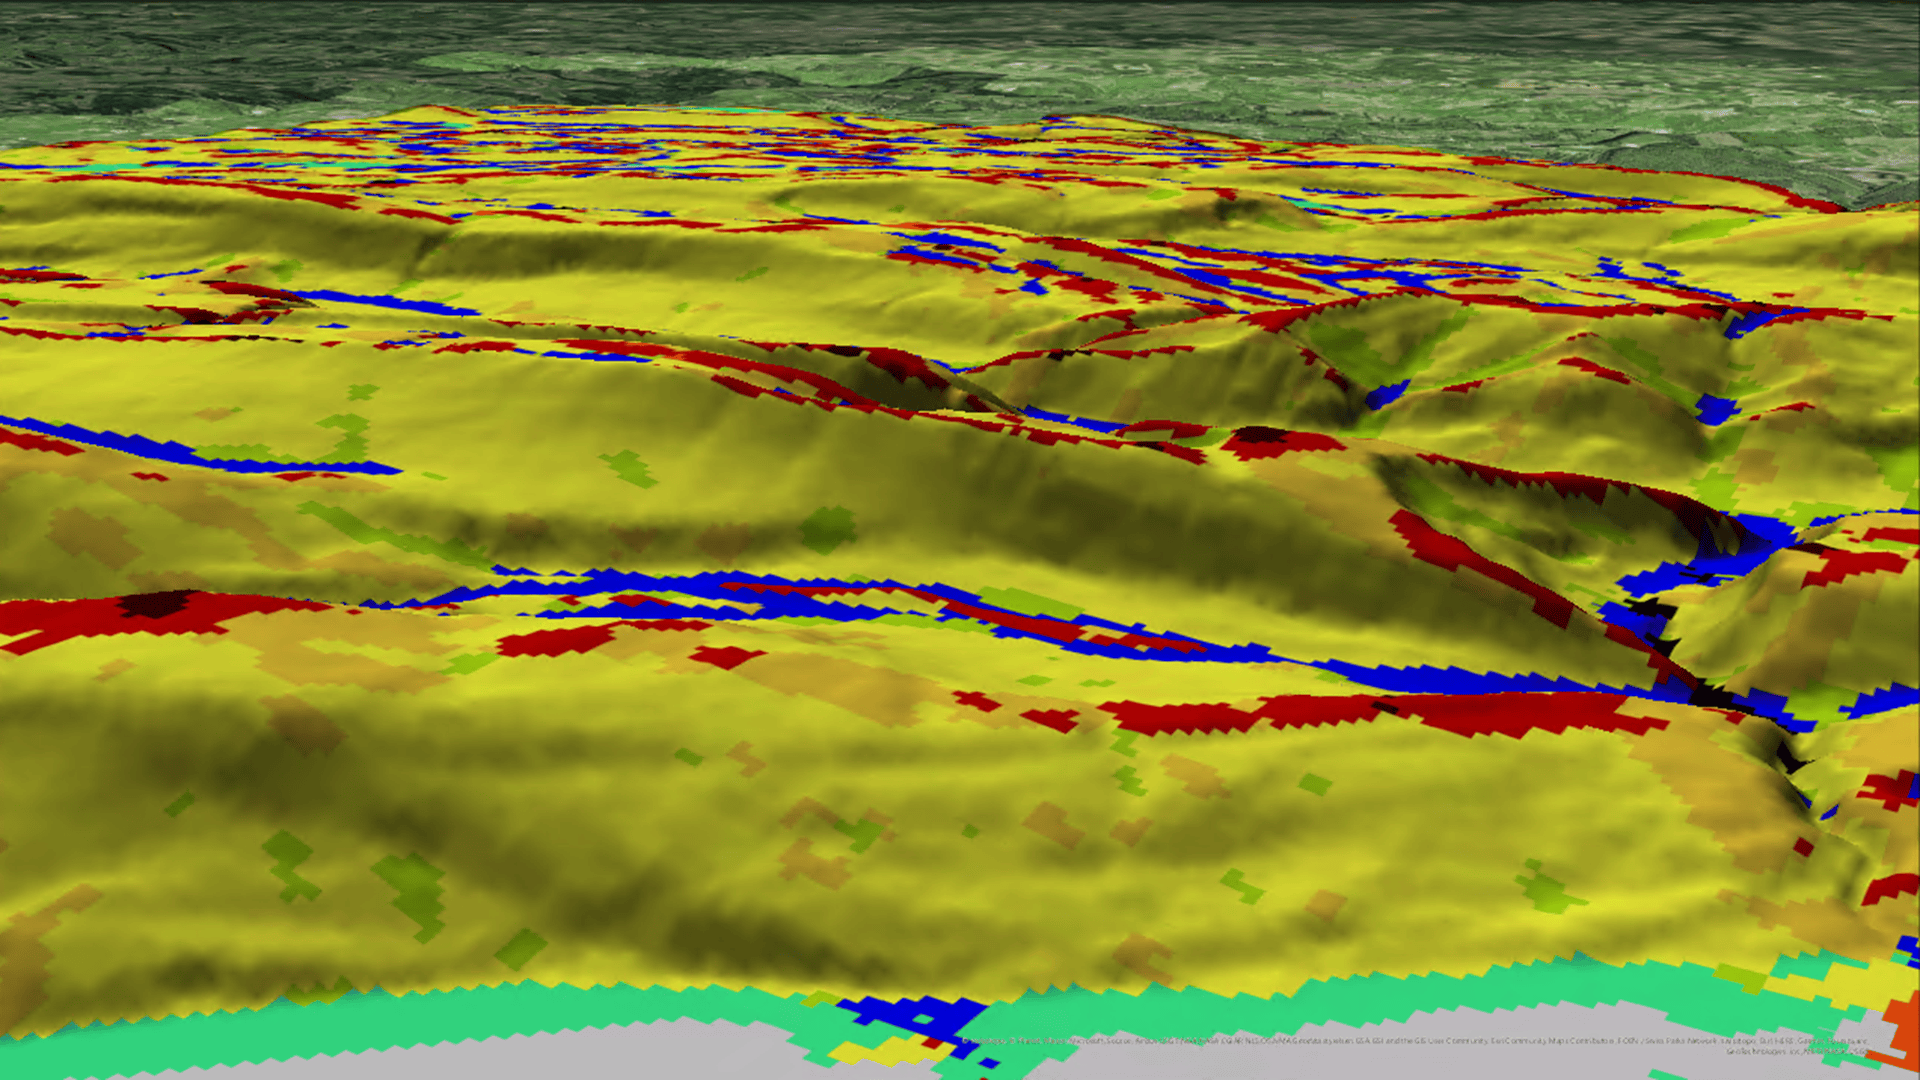
Using the 1-meter resolution DEM near the Congaree National Park as input, the results created by the Top Hat Transform tool highlight the hydrographic features, as shown in the following figure: (a) the input surface raster with 1-meter resolution. (b) the output raster created by the Ridge analysis type with an input rectangular neighborhood of 9 rows and 9 columns, where the dams and bridges are highlighted. (c) the output raster created by the Valley analysis type using the same input neighborhood, where the water channels are highlighted.
Since the output raster from the Valley analysis type contains the depth information, it can also be used in estimating the volume of incised materials in a channel (Rodriguez et al, 2002).
Learn more
For more information on how the Top Hat Transform tool works, visit How Top Hat Transform works.
Reference
Rodriguez, F., E. Maire, P. Courjault-Rade, and J. Darrozes. 2002. The Black Top Hat function applied to a DEM: A tool to estimate recent incision in a mountainous watershed (Estibere Watershed, Central Pyrenees). Geophysical Research Letters 29(6): 9.1–9.4.


Article Discussion: