As a GIS student since my undergraduate days, it has always been my dream to work with people who makes a greater impact on the society using spatial analysis. During the summer of 2018, I got the opportunity to intern with the Spatial Analyst team at Esri. Interning here has been quite a different experience than what I was expecting at the beginning of this summer, when I joined. Over these 3 months, I not only got the opportunity to participate in the daily routine job and learn from the team, but also participated in fun activities with other interns, like Hackathon, Hollywood sign hiking, potlucks and pot painting activities, and attended the Esri User Conference. However, the most exciting and challenging part of my internship was to come up with a proposal for an independent project that I was interested in. I was thrilled!
While I was thinking about my proposal, it occurred to me that a technological gap exists, which if addressed can bridge spatial analysis and meteorological model outputs, a major type of data used by atmospheric scientists on daily basis. Most meteorological output have sigma coordinate, which is a common coordinate system used in computational models for oceanography, meteorology and other fields where fluid dynamics are relevant. Creating a tool that could convert this coordinate into a 3D structure will benefit the users with a better understanding of the data and to interpret what is really happening with the weather and climate right now.
I viewed this problem as a two-step process:
First the Z-value for each grid point needs to be calculated and then interpolated to its desired height. To achieve this, I have created a python script toolbox — Create Multidimensional Data Toolbox that has two tools in it:
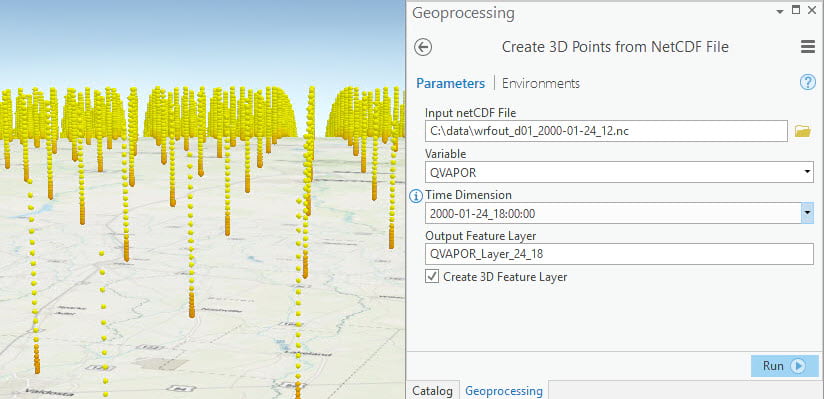
1. Create 3D Points from NetCDF File tool ingests Weather Research and Forecasting (WRF) outputs directly and create a 3D feature layer with calculated Z-values for each location (Fig.1).
2. Interpolate to Unified Heights tool inputs the 3D feature layer created from Create 3D Points from NetCDF File tool and interpolates them into height levels defined by the user with equal intervals (Fig. 2).
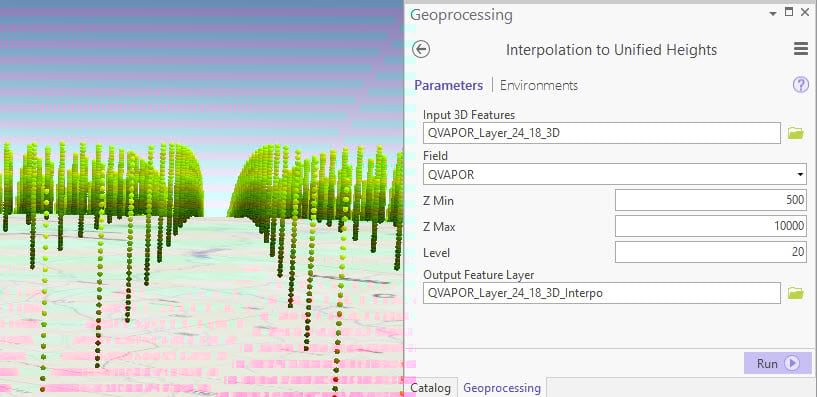
The output created from the unified height 3D feature layers is more user friendly to analyze and/or combine with other geospatial data.
This 12-week long internship has been a meaningful yet fun experience for me. From the User Conference I got to know about the most up-to-date technologies, and had a wonderful time with my fellow interns. Not only did I get to make a lot of wonderful new friends, I also grew a lot professionally. This will always be a life-long memory for me.

Commenting is not enabled for this article.