The Spatial Analyst extension offers new and improved capabilities in ArcGIS Pro 3.3. You can further refine your analysis with the Suitability Modeler by excluding specific locations. Use the new output PDF report option to summarize and share important details about how the optimal locations were identified. Take advantage of expanded capabilities, better performance, and improved display in Density, Distance, Solar, and Surface analysis. Read on to learn more.
Where to get it?
ArcGIS Pro 3.3 was released in May, 2024.
For a complete summary of all the changes that have been made for this release, have a look at the What’s New in ArcGIS Pro 3.3 blog post.
What’s changed for Spatial Analyst?
Listed here are the main functional areas with improvements over the last release:
- Suitability Modeling
- Density analysis
- Distance analysis
- Solar analysis
- Surface analysis
1. Suitability Modeler
The Suitability Modeler adds the capability to exclude locations from analysis. You can now easily create reports to share with others. The colour schemes have been updated, a new accessibility option has been added, and the user interface enhanced.
Exclude restricted locations
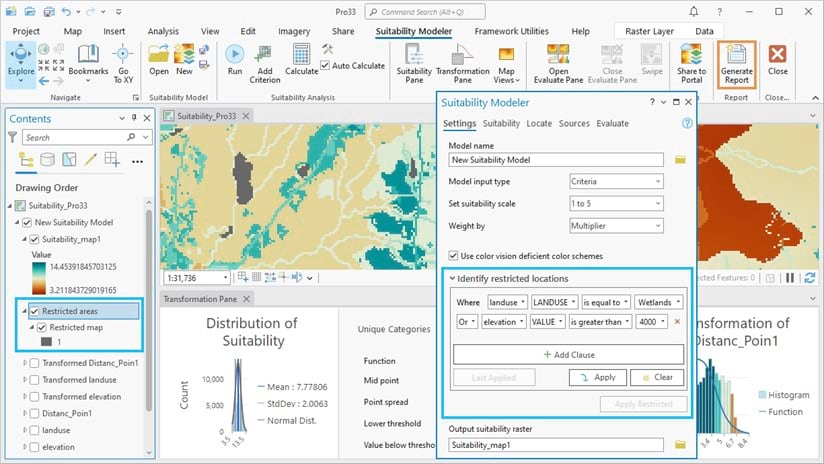
Often when doing suitability analysis there are certain locations you wish to prevent from being considered in the analysis. The Suitability Modeler now has the capability to define those restricted locations. Examples of the types of locations you might want to restrict include land cover classes representing water bodies, cells that are within a distance buffer around environmentally protected land, or areas that are too far away from existing facilities networks.
You can build up a query as a single or several clauses to define the restricted area, and display it as a map layer. See the elements outlined in cyan in the following screenshot. Learn more in the Exclude restricted locations help topic.

Reports
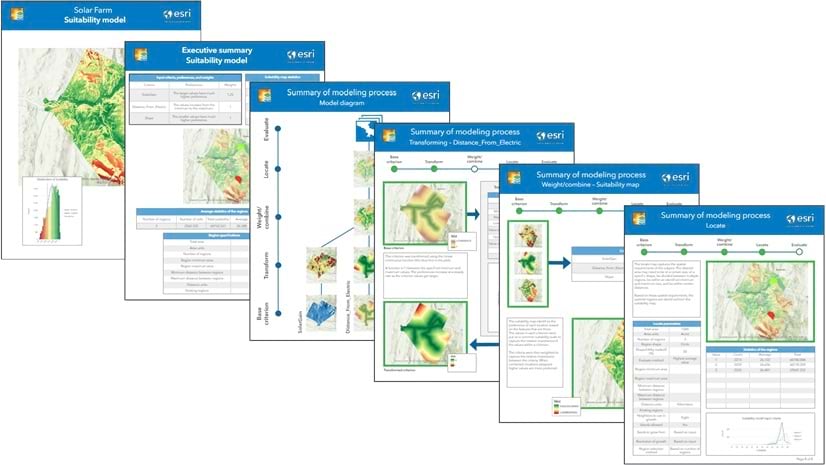
You can now Generate a suitability model report as a PDF that presents the key decisions made when creating the model. You can share the report with stakeholders and decision makers or use it to better understand the model. The report consists of summary information, a flow diagram of the model, details on the criterion transformations, the weights that were applied to the criteria, the final suitability map, and optionally a summary of located regions.
Just click the Generate Report button on the Suitability Modeler ribbon to start the process. An example of the types of content that appear in a report is shown in the following graphic.

Appearance, color display, and accessibility
The interface for the Suitability Modeler has been improved in appearance and ease of use.
The color schemes used in the maps, legends, and plots have been enhanced by increasing the color saturation, which improves the ability to discern changes in value across the full range of values. To support accessibility for individuals with the primary forms of color vision deficiency (CVD), an option is available that enables color schemes optimized for those with deuteranopia (green-blindness), protanopia (red-blindness), and tritanopia (blue-blindness).
2. Density analysis
The Space Time Kernel Density tool had some algorithmic updates to improve the quality of the output results. Several targeted improvements were made that help with incorporating the tool in analytical workflows.
- The tool now always creates a multidimensional output, irrespective of the number of slices.
- There is now no restriction on the number of slices allowed by the tool.
- The range allowed for the minimum and maximum elevation parameters was expanded, improving support for negative elevation values.
A new help topic was added that provides more details on the calculations used by the tool, how the tool compares to other density tools, and some common applications.
How Space Time Kernel Density works
3. Distance analysis
The Distance Accumulation and Distance Allocation tools have two new options for analyzing the amount of vertical effort it takes to move over the landscape. Tobler’s hiking function is an empirical model that accounts for the adjustment in walking speed based on the slope of the surface in the direction of travel. The new vertical factor option Hiking Time can be applied to determine the time it would take to hike from any a source to any location using the most optimal route. The Bidirectional Hiking Time option finds the average time to hike in one direction on an out-and-back hiking trail along the most optimal route.
Several optimizations were also made that improves the performance of these tools if the Distance Method parameter is set to the Geodesic option, or if either of Vertical Factor or Horizontal Factor parameters are set.
4. Solar analysis
For the Feature Solar Radiation and Raster Solar Radiation tools, a new parameter is available that you can use to control the speed and accuracy of the computations for solar analysis. When the Sun Grid Map Level parameter is set to a lower value, larger sun map areas are used in the solar calculations. Since fewer sun maps are created, the tools run more quickly. Using higher values may increase the accuracy of the results, at the expense of increased processing time.
Several improvements were made to performance, scalability, and support for GPU processing. The Raster Solar Radiation tool has increased performance and supports finer time intervals for analysis on the Moon. The Feature Solar Radiation tool has been optimized to better take advantage of GPU resources. Both tools can better support large input surface rasters and more input features. A CUDA compute capability of version 7.0 or later is recommended to take full advantage of additional GPU performance improvements.
5. Surface analysis
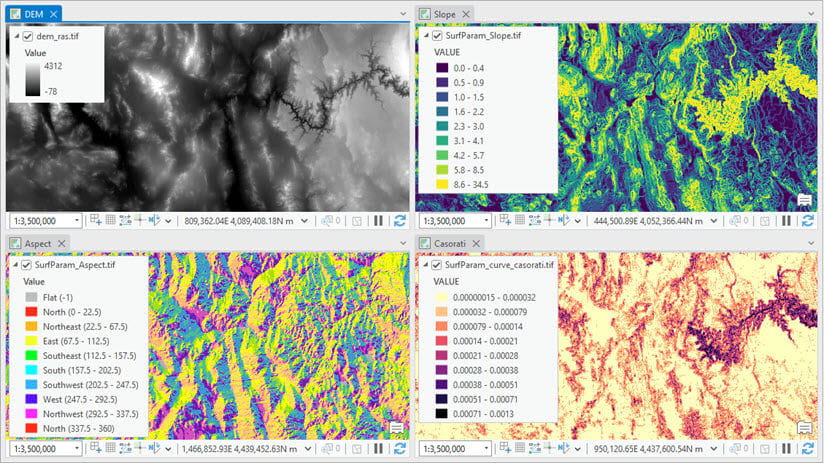
For the Surface Parameters tool output raster, a customized default renderer is now applied to make the results from various settings of the Parameter type more visually distinctive. The following maps show the result of applying the Slope, Aspect, and Casorati curvature settings to an input DEM raster.

Summary
While these are the main changes made for ArcGIS Pro 3.3, we here on the Spatial Analyst team made many other improvements to the functionality and performance. Be sure to update your install to the latest version and try it out.
Watch this space!
We will have other blog posts coming soon that cover some of the changes in more detail.
The following link is updated with new posts as they become available.
Be sure to bookmark the Spatial Analyst Communities page to follow questions, discussion, and solutions from us and other users:
Here are some starting points if you want to learn more about Spatial Analyst:
- Learn more about the Spatial Analyst Extension product
- What is the Spatial Analyst Extension
- The Spatial Analyst toolbox in ArcGIS Pro
For more information about this release, please visit the ArcGIS Pro page or the What’s New documentation and post your questions in the ArcGIS Pro board in Esri Community.

Article Discussion: