Do you have space-time data such as sea surface temperature, retail sales or energy usage? Do you wish you could predict how these phenomena might behave in the future based on current patterns? Now you can, with the new Time Series Forecasting toolset in ArcGIS Pro 2.6! Check out the demo below from the UC 2020 plenary to see the power of these new statistical and machine learning tools.
Time Series Forecasting in ArcGIS Pro isn’t just a single tool. The Spatial Statistics team have developed 4 new tools you can use to dive into forecasting with a space-time cube, plus brought enhancements to existing tools and add-ins so you can go further with your forecast results. Here’s a summary of what’s new:
1. Curve Fit Forecast (New)
The Curve Fit Forecast tool forecasts the future values of each location of a space-time cube using curve fitting. The tool firstly fits a parametric curve to each location in the Input Space Time Cube and then forecasts the time series by extrapolating this curve to future time steps. The curves can be linear, parabolic, exponential, or S-shaped (Gompertz). Learn how to use this technique to forecast COVID-19 cases.
2. Exponential Smoothing Forecast (New)
The Exponential Smoothing Forecast tool forecasts the future values of each location of a space-time cube using the Holt-Winters (aka triple exponential smoothing) method to decompose the time series at each location of a space-time cube into seasonal and trend components to effectively forecast future time steps at each location. This method can capture the seasonal patterns and model trends in damped way. Learn how to use this technique to predict gas consumption.
3. Forest-based Forecast (New)
The Forest-based Forecast tool uses forest-based regression to forecast future time slices of a space-time cube. This tool uses the same underlying algorithm as the Forest-based Classification and Regression tool when used for regression. The training data used to build the forest regression model is constructed using time windows on each location of the space-time cube. Learn how to use this technique to forecast COVID-19 cases.
4. Evaluate Forecasts by Location (New)
The Evaluate Forecasts by Location tool is used to evaluate and merge multiple forecasts of the same underlying time series data at a set of locations. At each location, the most accurate forecast method is selected to represent the forecast for that location, so you can try multiple forecast methods and select the most accurate one location by location. Learn how to use this technique to find the best COVID-19 forecasts.
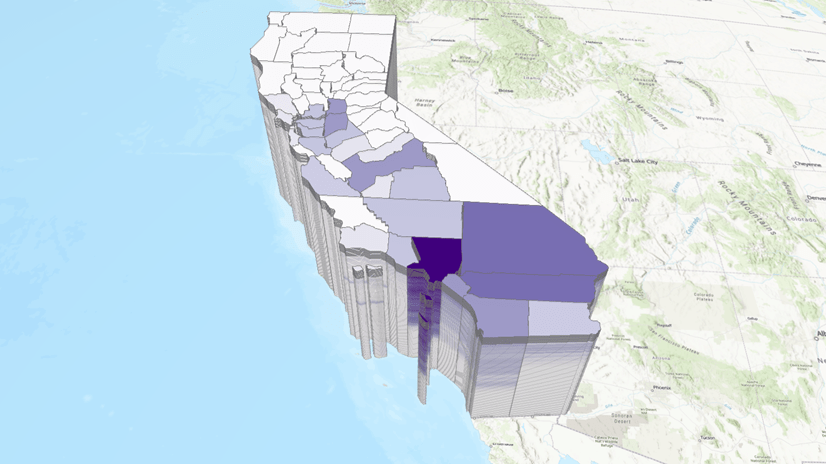
5. Visualize Space Time Cube in 2D and Visualize Space Time Cube in 3D (Enhancement)
The Visualize Space Time Cube in 2D/3D tool visualizes the variables stored in a space time cube and the results generated by the Space Time Pattern Mining tools. Learn how to use this technique to understand patterns in your time series, and to dig deeper into forecast results.
6. Space Time Cube Explorer (Enhancement)
The Space Time Cube Explorer Add-in will take the space-time cube as input and create layers that can be quickly and beautifully displayed from the Display Gallery. Learn how to use this technique to enhance the visualization of your forecast output.
In addition to the Time Series Forecasting toolset, the Space Time Pattern Mining toolbox provides several other tools to analyze space-time data, including Time Series Clustering and Emerging Hot Spot Analysis. You can find more resources for these and many other statistical tools in ArcGIS Pro at spatialstats.github.io.

Article Discussion: