We’re happy to announce that the new Generate Schema Report tool is live in Pro 3.2! We’re glad it’s already getting used and feedback is already coming in on the ideas site. That’s awesome. I thought I’d add some context to the project. I’ve made us some tea. Let’s have a chat.
Here are the talking points:
- Introductory Video
- Brief History
- The Generate Schema Report tool
- Schema Report Improvements / Tips and tricks
- The Road Ahead
Introductory Video
Here’s the gist of the Generate Schema Report tool in under a minute:
Brief History
…let’s just skip right to the part where we talk about X-Ray.
One of the most upvoted ideas on the ArcGIS Pro community pages for several years has been this one from a prolific poster named, Anonymous User:
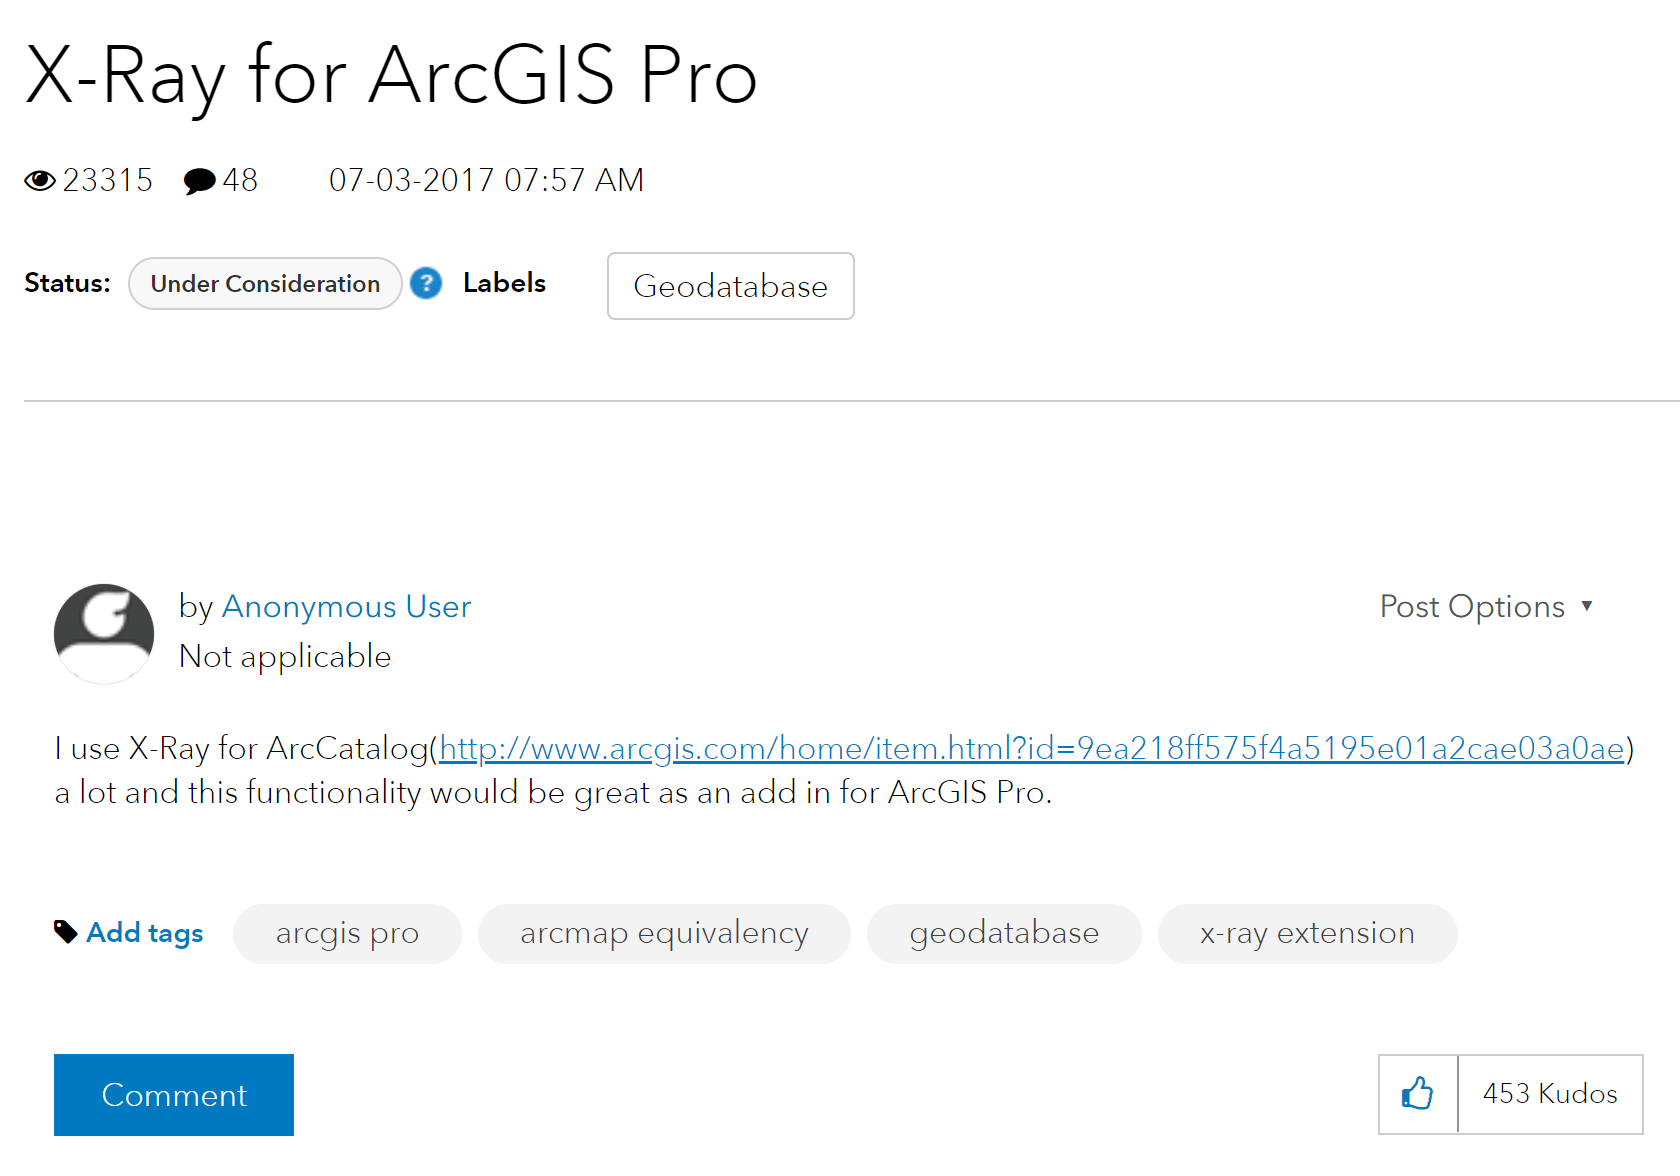
X-Ray was an unsupported add-in to ArcCatalog that could be used to “develop, refine and document your geodatabase designs.” It basically exported your geodatabase schema to an Excel workbook via an XML workspace document. Feature classes and domains were represented on their own sheets in the workbook. So, this experience offered a familiar and easy way to view your data model in a spreadsheet and quickly navigate between schema elements to see their properties.
This type of experience has not been available in ArcGIS Pro, so when the idea (and other duplicate ideas) hit the community pages, the views, comments, and kudos kept clipping up-up-upwards. We knew it was some beloved functionality.
So, we took some time to go through the comments and see what the main trends were. We met with users and talked to them about their use cases. In house, our Professional Services and Solutions teams also had a number of workflows involving X-Ray. We met with them too. Our goal was to offer this capability in the core software, but we also wanted to hear from people on ways we could improve upon it.
What did we find?
Through our engagements we found these to be the top two reasons people used the X-Ray tool:
- As documentation of their data model – users would use the output to generate data dictionaries, collaborate on their data models and adjust them, use it as a snapshot in time of the schema, and some would straight up print it and hand it out as documentation.
- To perform mass schema updates – a lot of users found it to be faster to make batch edits within the spreadsheet, add and reorder fields, update and delete domains, adjust properties as needed, then reimport and create a new geodatabase containing all the schema changes they’d just made.
Alright, cool. Obviously, phase one was to generate the schema report itself.
The Generate Schema Report tool
The goal was to make a geoprocessing tool that biffed the geodatabase schema into an Excel workbook. Each sheet of the workbook would be a schema element such as a feature class or domain. “Schema Biffer” sounded cool but “Generate Schema Report” was a way more sensible, say-it-like-it-is kind of name.
But of course, we aimed to improve the output too. What if I wanted to see all the fields in the whole geodatabase all at once? What capabilities are enabled on the feature class? Why not add domain usage information? Let’s put more details on the pages and have links anchored throughout them to navigate around more easily. Why not add other output formats?
And so it went. We thought about it, we built out the tool, we tested, we iterated, and we got a lot of these improvements in there. There’ll be more to come.
Schema Report Improvements
Here’s a not-so-exhaustive list of what we added and why (that also doubles as a tips and tricks section):
- TOC and Summary information
- Navigation
- “Megasheets”
- Geodatabase Order
- Attribute Rules
- Domain Usage
- More dataset types and properties supported
- More input types/a>
- More output types
TOC and Summary Information
The first page of the report acts as a table of contents for the rest of the workbook. It also has information about the workspace that the report was generated from at the top.
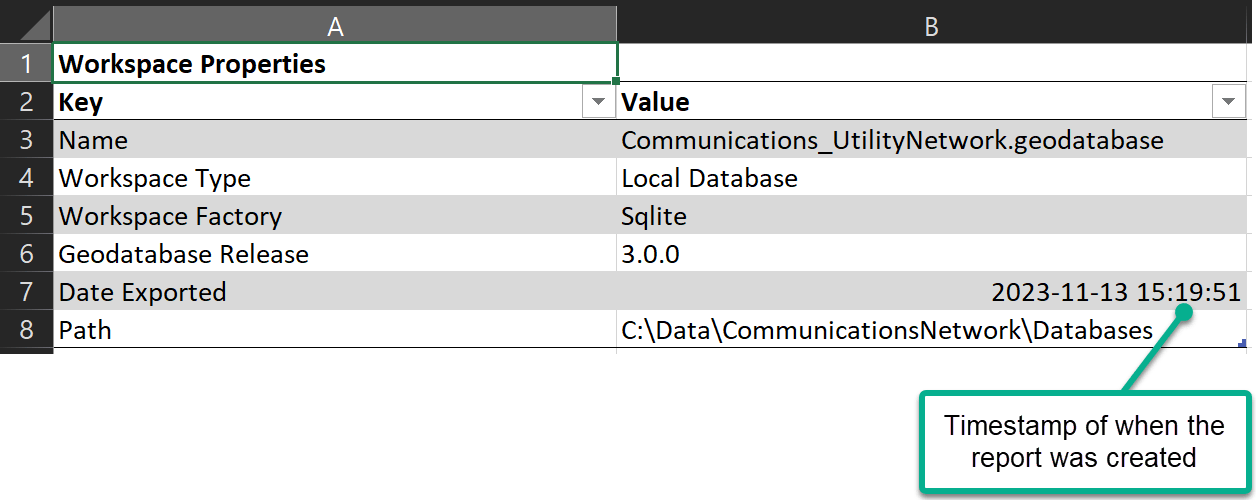
You can see above that I’ve exported a Communications Network from a mobile geodatabase that was created at the Pro 3.0 release. The date and time that the report was created and the path to the workspace are also shown here.
Next there is a summary of all the schema elements within the geodatabase and a count for how many there are of each. The links navigate you to master sheets of each schema element (in house we’ve been calling them ‘megasheets’). I’ll talk about those in another section.
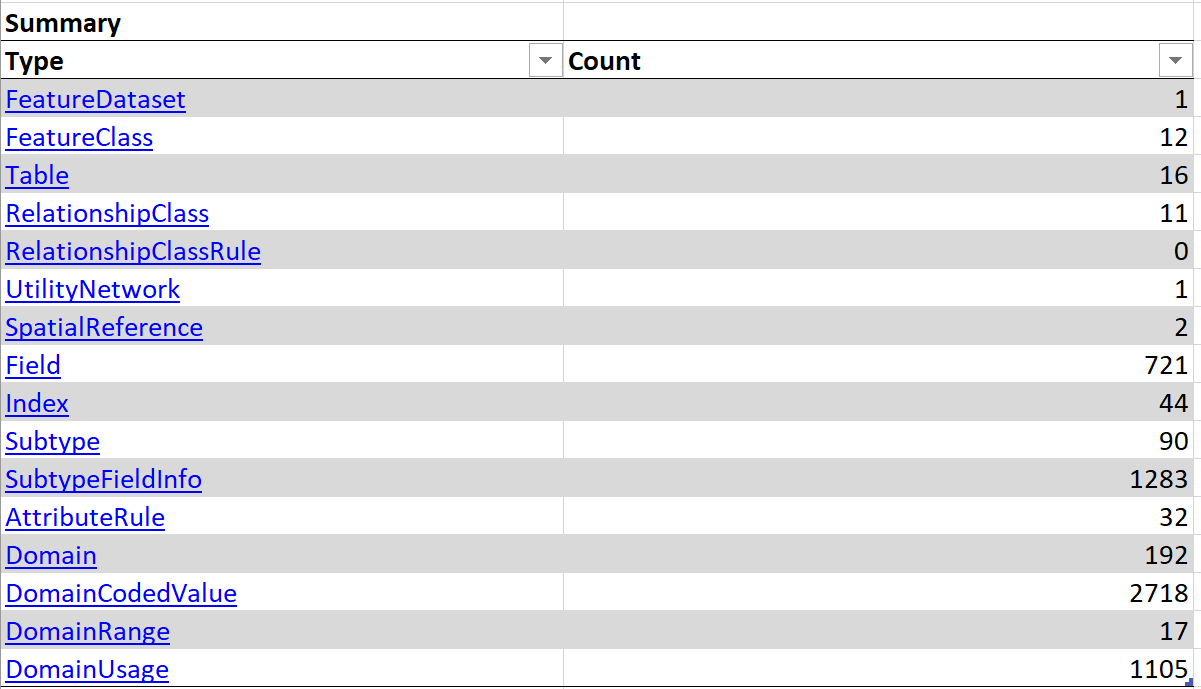
And below this summary is a list of all the datasets in the geodatabase and what dataset type they are, such as feature class, table, relationship class, etc. Links on the datasets take you directly to an individual worksheet for them containing more details, properties, and information.
Navigation
We wanted to make traversing the report fast and easy, so links were added to just about everything we could bedazzle. Aside from the links mentioned just above, here are some other ways to quickly teleport around your schema report.
Page Navigation
At the top of the individual dataset worksheets there is a list of links that serves as a table of contents for the page you are on. Clicking a link shoots you down to the associated section. Want to see what attribute rules are assigned to a class? Click the link and jump straight to the bottom of the page.
Global Navigation
If you right-click the bottom left corner, it brings up an Activate dialog. This basically works like a global navigation, listing every sheet in the workbook. Handy for finding exactly the page you needed to get to (or as a grappling hook out of the quicksand you’ve clicked your way into).
Back and Forward Navigation
And then, for some reason, the Back and Forward navigation buttons are not on the Excel ribbon by default. These are obviously a huge help when navigating a massive workbook like these schema reports can create.
To add these to the Quick Access Toolbar:
- On the ribbon, click File
- Click Options (all the way at the bottom)
- In the Excel Options dialog click Quick Access Toolbar
- Find Back in the list and click Add >>
- Find Forward in the list and click Add >>
- Click OK
Now you can easily click back and forth between sheets to navigate around.
“Megasheets”
As mentioned above, the TOC page has a summary list of all the schema elements in the geodatabase you’ve exported. Clicking on any of them will take you to a “megasheet”. These sheets contain every single instance of that schema element. For example, clicking the Field link on the TOC sheet will take you to a page with all of the fields in the geodatabase listed on it.
How does looking at all 721 fields in my Communication Network help me? Well, as shown in the gif below, maybe I just want to see all my Date fields. I can filter the Type column by Date. Alright, there’s only 91 of those. What if I only care about the date fields being used as the Date Created field in Editor Tracking? Filter the Usage column by Created. Nice, only 28 of those. I can sort these alphabetically and now I’ve got an easy list of fields to review and compare.
This is just one example. Maybe you’re looking at the list of every feature class in the geodatabase and checking to make sure they all have the same spatial reference. Or reviewing the split and merge policies on all the domains. There are lots of use cases, I think you’ll find the megasheets to be an invaluable resource.
Geodatabase Order
Have you filtered and sorted the schema report into an unintelligible mess and need to Memento yourself back to the beginning? Clear all the filters and scroll to the right. We’ve added a Geodatabase Order column. Sorting this column smallest to largest will get you back to the original order it was exported in.
Attribute Rules
A nice addition to the report is that all the attribute rules in the geodatabase come along for the ride. You can click on the Attribute Rule link in the TOC to go to the sheet containing all of them. Or, click the Attribute Rule link at the top of the page for a feature class or table to jump down and see any rules that are associated with it.
All the attribute rule properties are included, such as type of rule, minimum client version needed to run it, triggers, a timestamp of when it was created, and even the Arcade script that fires when the rule is triggered.
Domain Usage
Ya, you guessed it. There’s also a sheet showing all the domains in the workspace and where they are assigned. Even better, fields that have a domain are linked to that domain’s sheet so you can easily navigate between them. Triply better, the sheet for each individual domain also has a domain usage section showing the dataset, subtype (when applicable), and field that the domain is assigned to. Trippily better, you could just navigate domain links until the end of time (not recommended).

More dataset types and properties supported
The schema report will also export relationship classes and controller datasets, like a topology, or the utility network in the example above. These each have their own sheets as well, showing all their properties.
On individual feature class and table sheets you’ll also notice helpful properties have been added, such as editor tracking fields and if the class participates in a relationship or controller dataset.
More input types
The Generate Schema Report tool doesn’t just take a geodatabase as input. If you only want to see the details of a single feature class, you can. Drag a feature dataset into the input and you can just see a schema report of that. Services? Yep, they work too.
More output types
The tool doesn’t only export to Excel (.XLSX).
- Want a simple data dictionary that’s easy to share? Export to HTML.
- Want a ready-to-print document? Export to PDF.
- Want a data interchange or scripting format? Export to JSON
- Want it all? Export them all at once.
The Road Ahead
So that’s generally where we are with the Schema Report project at Pro 3.2. Phase two of this thing will be to support a major X-Ray workflow that we heard a lot about from the community: Mass Schema Updates.
People would use X-Ray to export the geodatabase schema to Excel and make their schema changes there. This allowed them to work on a design and data model without impacting an in-place geodatabase. Many users reported that they also just found it easier to make large amounts of schema changes using the familiar, spreadsheet experience.
So, this is our real end goal. A lot of the improvements I’ve listed above are because we’re paving the way for a similar experience within ArcGIS Pro.
- Generate a schema report
- Make schema updates in the report
- Import the schema report to create a geodatabase with those updates
I’d like to say that this will get into the next release, Pro 3.3. But we’re just having a teatime chat here, remember? I’m not making any promises. Some other, longer-term promises I won’t chat about at this time might involve a schema comparison tool and a graphical representation of your data model.
But for now, let’s celebrate the schema report in Pro 3.2 (Clink! Clink!). I’ve added a post to the Data Management community pages where we can foster more ideas and discussion on the matter. Play around with the Generate Schema Report tool and let us know what you think. Cheers!

Commenting is not enabled for this article.