In imagery analysis, one of the hardest challenges is finding what you didn’t know to look for. Whether you’re scanning hyperspectral data for hidden encampments or analyzing drone imagery for undocumented activity, detecting unknown features—those that don’t follow a predictable pattern—isn’t easy.
That’s where the new Anomaly Detection Wizard in ArcGIS Pro steps in.
This powerful tool helps you identify pixels and features that are spectrally distinct from their surroundings, without needing training data or reference signatures. It’s fast, flexible, and designed specifically for use with multispectral and hyperspectral imagery.
What Is Anomaly Detection?
Anomaly detection is the process of identifying data points—pixels, in this case—that differ significantly from the background. Instead of searching for known targets using predefined spectral profiles (as in supervised classification or target detection), anomaly detection looks for the unusual. Think of it as spotlighting the “needles in the haystack” in a scene, no matter what they are.
This approach is especially useful in:
- Defense & Intelligence
- Detecting camouflaged vehicles and equipment
- Identifying temporary structures or installations
- Monitoring unusual ship or aircraft activity
- Environmental Analysis
- Tracking animal herd movements
- Detecting encroaching development in protected areas
- Identifying illegal logging operations
- Spotting unauthorized settlements
- Natural Resources
- Monitoring oil pads, fracking sites, and illegal mining activity
- Detecting vegetation stress indicative of pipeline leaks
- Monitoring pipeline flares and emissions
Why It Matters
In traditional workflows, analysts often need to manually scan through large, high-resolution imagery datasets, hoping to visually catch something out of place. That approach doesn’t scale—and worse, it can miss subtle but important anomalies.
The Anomaly Detection Wizard automates this process. It helps analysts:
- Quickly isolate unusual features in large imagery scenes.
- Filter out background noise to focus on meaningful pixels.
- Work without the need for prior training data or known spectral targets.
- Follow a guided, best-practice workflow that reduces error.
The result? More consistent, more accurate detection of the unexpected.
How It Works
The Anomaly Detection Wizard offers a structured and intuitive workflow for performing anomaly analysis on hyperspectral and multispectral data. Here’s how the process works:
1. Load Your Input Imagery
Start by selecting your imagery layer—this can be hyperspectral data from airborne sensors, or high-resolution multispectral imagery from satellites or drones. The tool supports a wide range of formats and resolutions.
2. Define processing extent (Optional)
You can optionally refine your analysis by selecting:
- A spatial subset (an area of interest)
- A spectral subset (specific bands or wavelength ranges)
This helps reduce processing time and isolate relevant parts of the image before anomaly detection begins.
3. Process and calculate anomaly scores
You can process using two methods.
- K-means, a cluster method that calculates spectral distances to the centers of the clusters.
- RXD and UTD, statistical methods that compute the spectral differences from the background, which can be derived from the whole image or user-defined region of interest.
This process creates an anomaly score raster, which is saved to your project folder.
4. Extract Anomalies
Use the interactive slider to filter pixels with high anomaly scores, explore the spatial patens, and extract final anomalies pixels.
5.Export and Share
The result can be saved as:
- A new raster dataset
- A feature class for further GIS analysis
You can optionally perform post-processing , such as smooth regions or removing tiny regions, before exporting the result.
You can easily bring the results into other ArcGIS workflows—such as dashboards, reports, or object detection pipelines.
6.Examples
In the first case, we used a Sentinel 2 scene to detect ships in the port of Long Beach using the Anomaly Detection Wizard. The K-means method was applied to calculate the anomaly scores, and anomalies over the water were extracted using a threshold of 0.009.


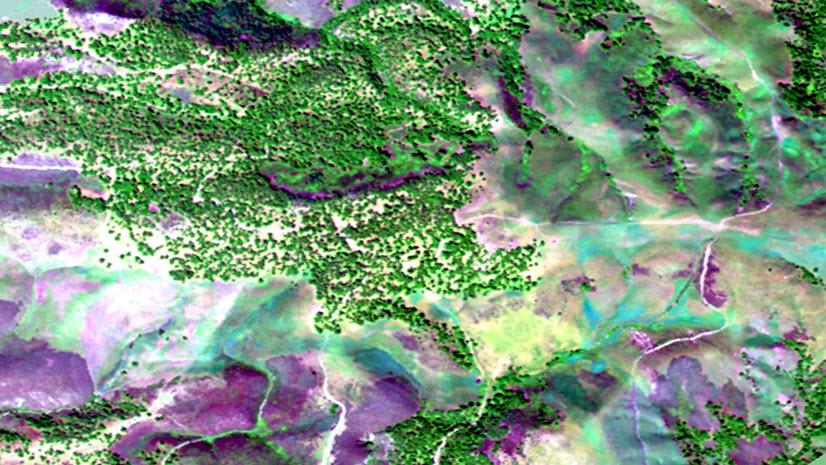
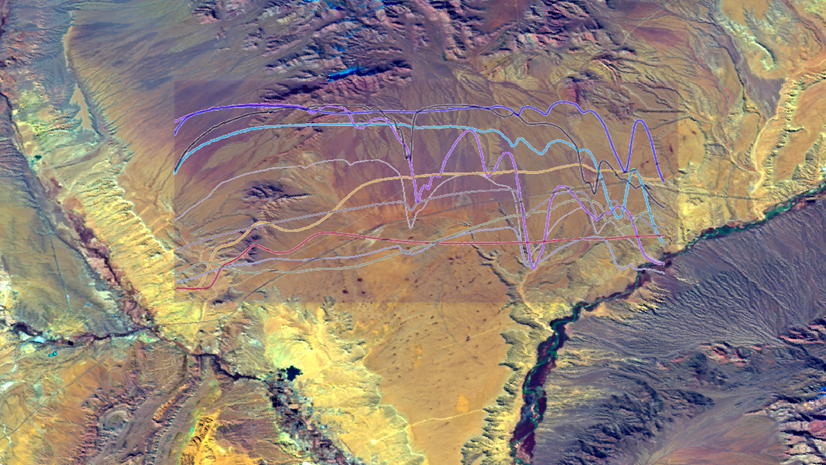
The second case involves an image over a remote area. The RXD method was used to calculate the anomaly scores, and the interactive slider was used to explore the scene, leading to the detection of human settlement. Image on the left is the input, while image on the right shows detected airport and agriculture fields located with the yellow box in the input image.


What Problems Does It Solve?
The Anomaly Detection Wizard was designed with real-world image analysis challenges in mind:
- Eliminates the need for predefined target spectra – you don’t need to know what you’re looking for.
- Automates complex spectral analysis – saving hours of manual inspection.
- Helps detect subtle, hidden, or camouflaged features that would otherwise be overlooked.
- Makes hyperspectral imagery more accessible to analysts who aren’t spectral experts.
Whether you’re dealing with military reconnaissance, environmental monitoring, or infrastructure intelligence, this tool streamlines your workflow and gets you to actionable insights faster.
Where to Find It
The Anomaly Detection Wizard is available in ArcGIS Pro under the Imagery tab → Spectral Analysis group. You’ll also find the standalone Anomaly Detection GP Tool in the Geoprocessing pane, if you want to automate the process or build it into a larger model.
What’s Next
We’re just getting started. Future updates are planned to include:
- Time-series anomaly detection (across image stacks)
- Object-based grouping of anomalies.
- Integration with deep learning for contextual classification
If you’re working with spectral imagery and need to uncover what’s hidden in plain sight, the Anomaly Detection Wizard is ready to help.


Article Discussion: