Not long ago we produced a Learn.ArcGIS.com lesson called Explore Future Climate Projections. That lesson is a great way to get started learning how to use climate data. The lesson includes data for 858 climate variables, but the steps only cover using a few of them. Esri partnered with the UCAR|NCAR Research Applications Laboratory (RAL) to produce this data.
This climate data is a global multimodel ensemble that provides mean and standard deviation values of annual and monthly temperature and precipitation anomalies from 10 models of projected future climates. Thus, you have everything needed to use ArcGIS Pro to fact-check future climate projections for where you live just by importing layers and clicking on the map.
In this post, we will to show you how to use the geoprocessing model supplied in the learn lesson to quickly and easily access any of those variables in ArcGIS Pro.
In the third section, called Locate a type of climate, we show how use an ArcGIS Pro project template containing a geoprocessing model to import monthly climate variables. That model is a lot more versatile than we wrote about in the lesson.
The lesson shows using the model to import monthly historical average temperature data from a NetCDF file. With only a few additional modifications this model can be adapted to import any of the projections future climate scenarios and time frames.
Next, we will show a set of steps for working with mean monthly temperature, including how they can be adapted for precipitation variables or for standard deviations instead of means.
Steps for a temperature climate variable:
- Download the Explore Future Climate Projections lesson – if you haven’t already done the lesson consider doing so before proceeding. Proceed to the next steps if you are already comfortable with climate data and working with NetCDF data.
- Start by following the first 9 steps of the third lesson, Locate a type of climate lesson.
- For Future Monthly Temperature NetCDF File, browse to the mme-netcdfs folder and locate a monthly temperature (tas) variable. For instance, a likely near-term scenario is: cmip5_anomaly_tas_monthly_mean_multi-model-ensemble_rcp60_2020-2039.nc. Double-click the file you’ve chosen.
- Click OK.
- The model will not validate because the variables are named differently in the future climate scenarios than they were in the historical average NetCDF files which were the focus of the lesson. Follow these steps for each of the twelve outputs.
- Double-click the Make NetCDF Raster Layer tool to open its properties.
- Set the Variable to tas. The X Dimension and Y Dimension parameters will automatically fill in. Use pr for monthly precipitation and tas_stddev or pr_stddev for standard deviation .nc files.
- In the list of Dimension Values, use the drop-down to change the default value which is for the year 1986 to the matching monthly value for the year that is in the middle of the timeframe for the scenario you have chosen. If using the RCP 6.0 for 2020-2039 this will be 01/16/2030 12:00:00 AM for January.
- Change the Output Raster Layer name to include the scenario you’ve chosen.
- Click OK.
- Optionally Save the model to make it easier to share or reuse.
- In the ModelBuilder tab click Save As.
- Save the model to: Import Monthly Temperature Scenario Layers.
- Run the model. If the resulting layers all have the same value ranges, then a problem has occurred. Check the following:
- Make sure the NetCDF file does not have the word Annual in its name.
- Make sure the times from step 4c are correctly set.
Now you can zoom anywhere on the map and click to explore the monthly values to see just how how much your climate is projected to change. We did that and took a few minutes to type the values into an Excel spreadsheet in order to make some graphs so we could better visualize this data:

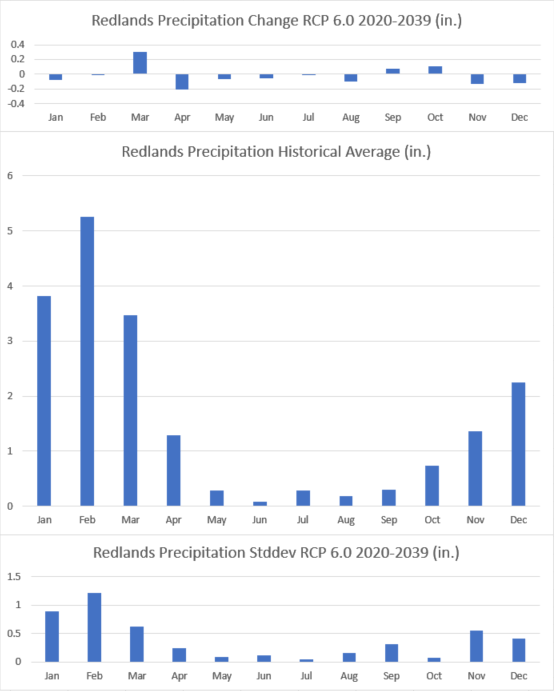
For those who live in or near Redlands, CA, one thing to note is this climate data is at a resolution of 1.0 degrees, so the data for Redlands includes some of the nearby hills and mountains. Thus, interpret these graphs based on what is normal for your elevation.
We took this idea a little bit further and created version of the ArcGIS Pro project template and shared it on ArcGIS Online. That template now contains geoprocessing tools for each of the variable types available. We also made the Excel spreadsheet that we used to make the graphs above available for download.


Commenting is not enabled for this article.