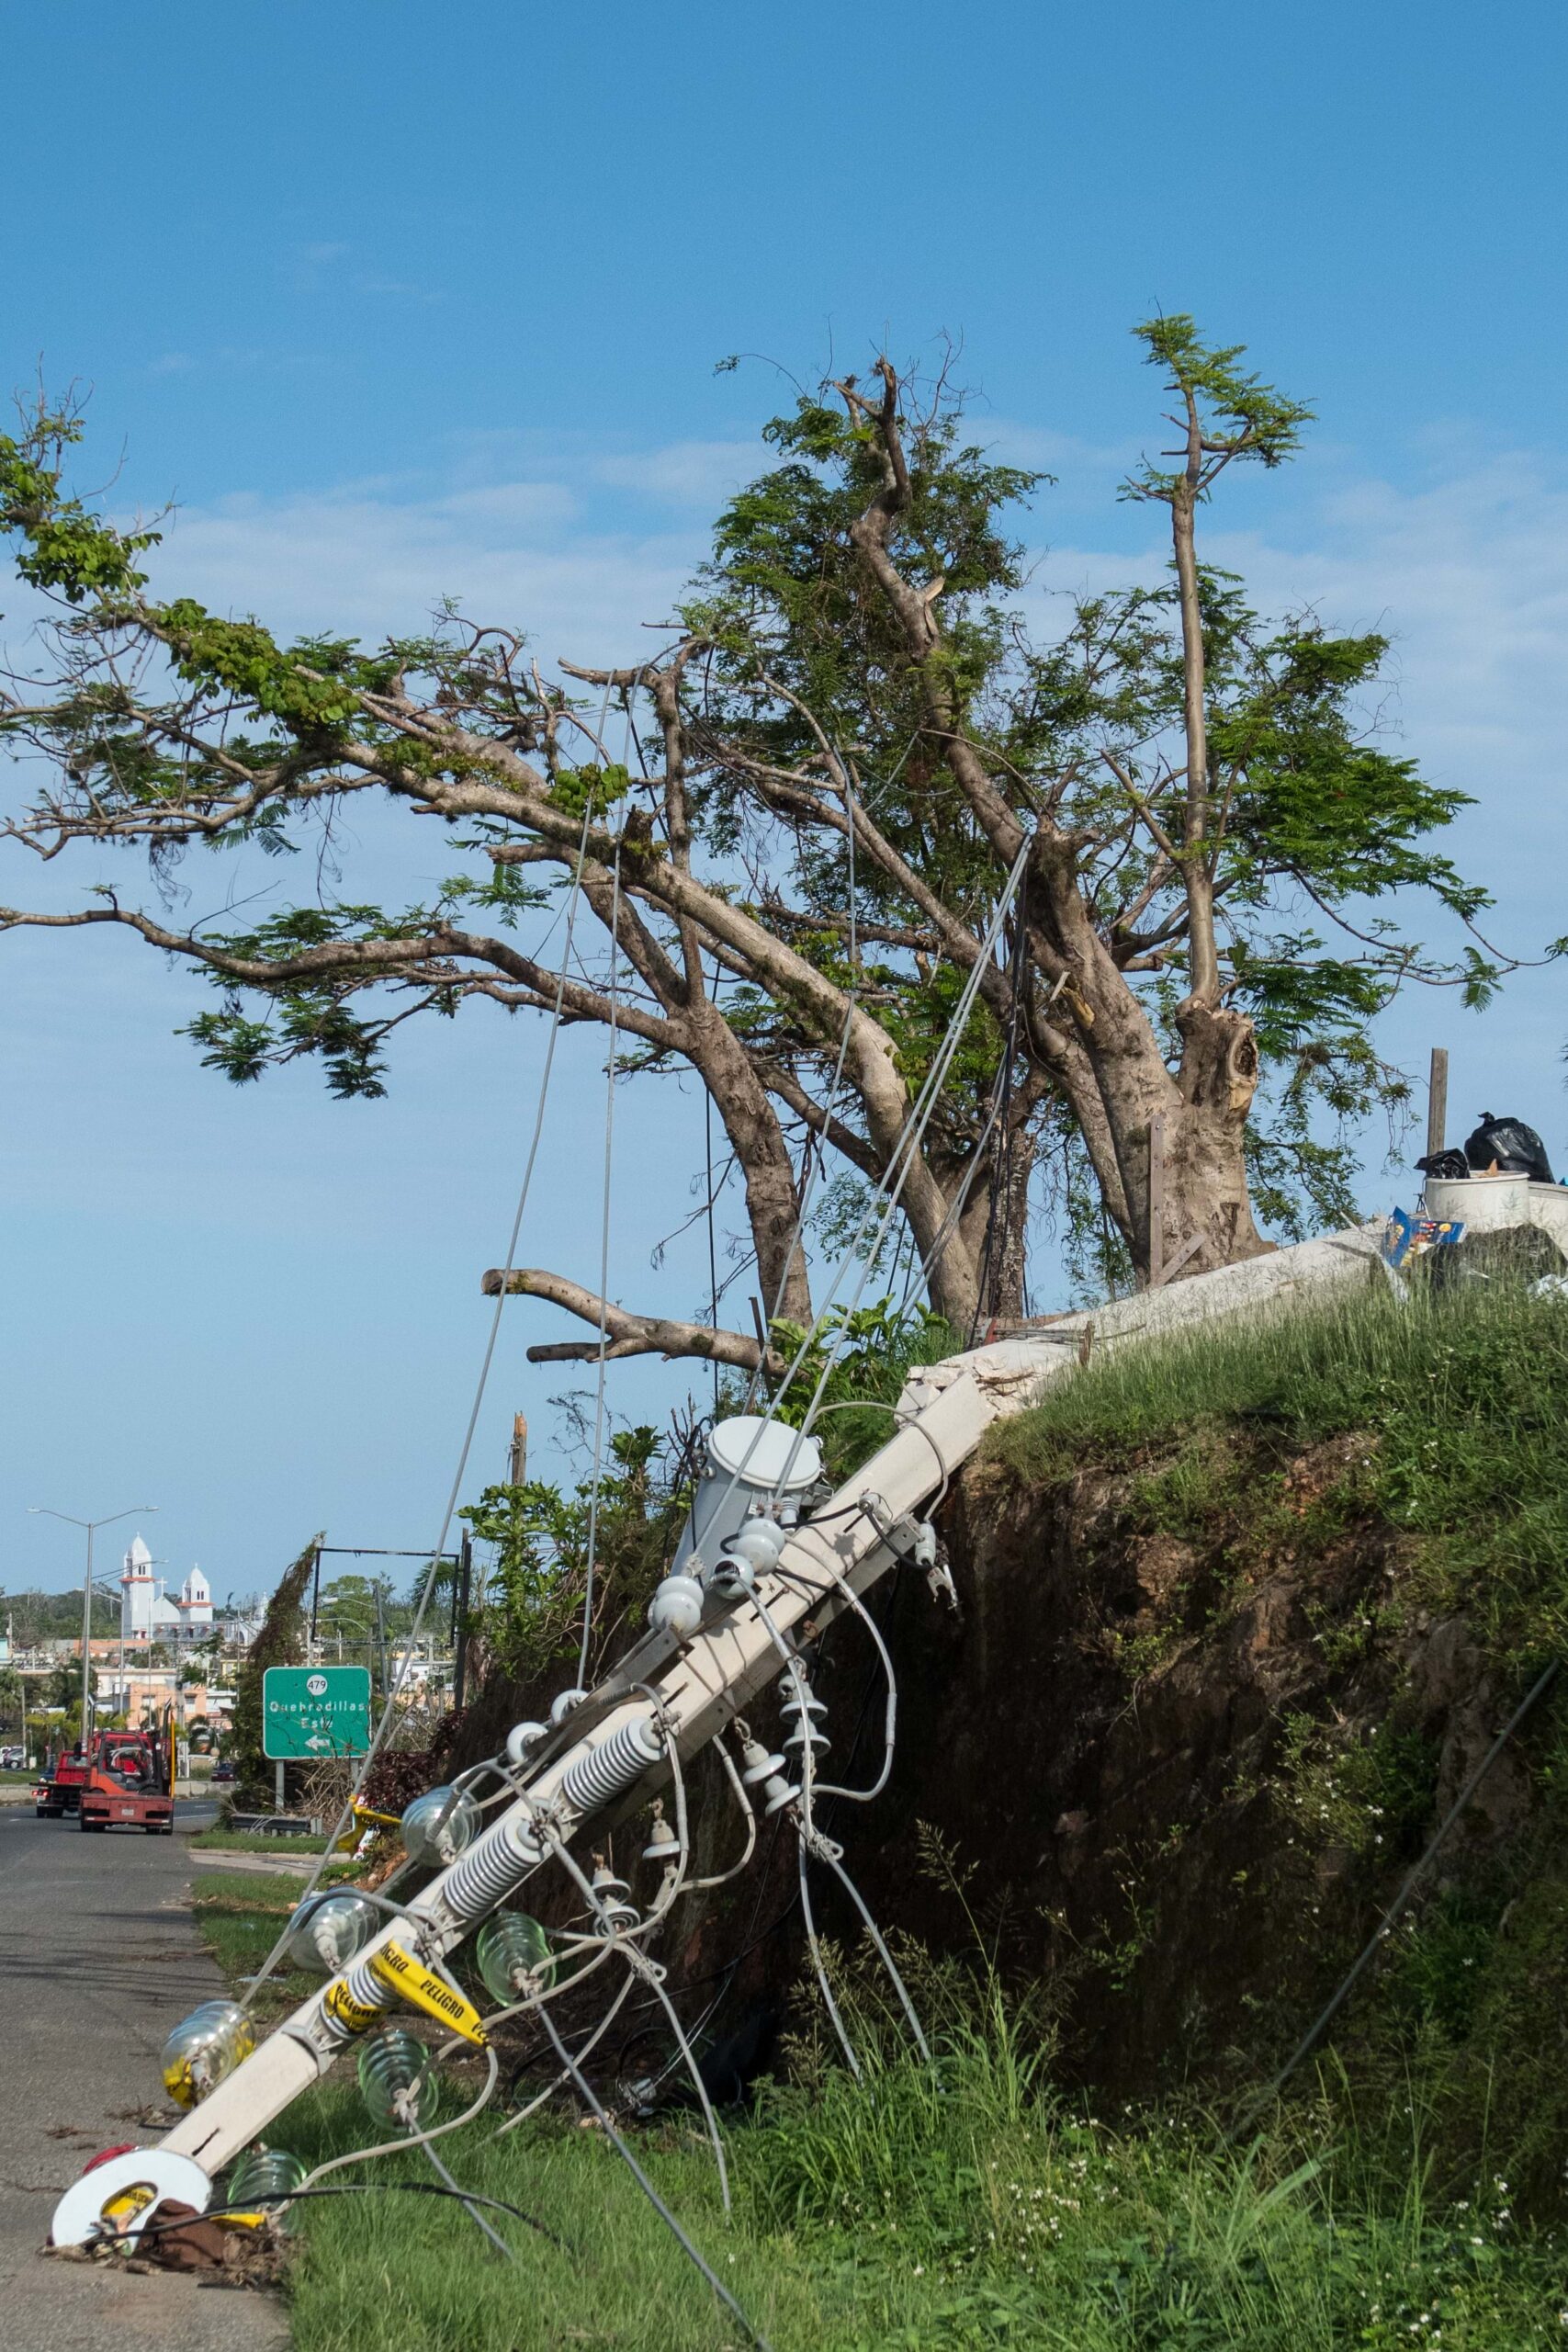
Our modern world is supported by vast amounts of infrastructure. When I flip a switch, I expect lights to come on. When I open the faucet, I expect clean water to come out. When I open a web browser, I expect to be able to access the internet.
Keeping all these vital services operating consistently and efficiently is a challenge that utilities and governments have been managing for as long as there has been infrastructure to manage. The lifespan of infrastructure largely relies on two factors: (1) proper planning and engineering to construct the infrastructure, and (2) the adequate allocation of resources to maintain the infrastructure once it’s been built. The second factor is what I want to discuss in this series of articles, specifically: how GIS and the geographic approach can help you more effectively identify how to allocate resources.
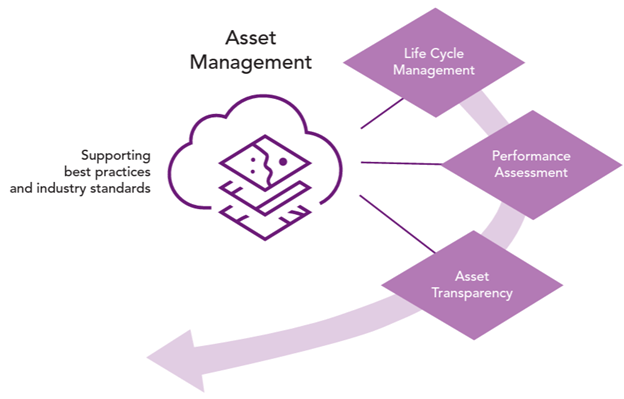
Organizations that do not implement a formal asset management strategy are implementing a “Run to failure” asset management strategy. This approach carries an assumption that it is more effective to allocate resources to respond to failure than to prevent it. While this may be true for some services, when it comes to critical infrastructure, the cost and consequence of failure can often be quite high.
Most organizations that maintain critical infrastructure adopt a strategy that allocates resources to proactively identify and replace equipment before it fails. One such strategy is a Condition Based Maintenance (CBM) strategy.
This approach regularly monitors the conditions of each asset and uses these observations to calculate scores for criteria such as the risk of failure or consequence of failure. These scores are then used to prioritize how resources are allocated to infrastructure maintenance. One of the biggest criticisms CBM receives is that it can be perceived as too complicated, or too difficult to implement.
In this, and subsequent articles, I will show you several ways you can leverage your existing GIS investments along with other freely available resources to implement an effective CBM strategy. This is a topic of increasing importance as many organizations managing infrastructure are faced with increased demands and challenges to their infrastructure while also balancing limited staffing and shrinking budgets.
Asset Management Systems
Most organizations make use of an asset management system to track all their assets along with the work to install, maintain, and retire these assets. Most asset management systems are designed using traditional databases which can limit their reporting and analysis methods to tabular methodologies. However, modern organizations recognize that by integrating these systems with a GIS platform such as ArcGIS, they can improve the productivity of workers and increase the accuracy of their data.
An example where a GIS provides a complimentary solution to asset management is in the organization of linear assets. Because asset management systems are non-spatial, it is very difficult for them to identify and keep track of individual lines, such as sections of pipe that are installed in the ground. In contrast, an organization that has GIS will often track the location and unique identifier of every pipe, fitting, and device in their entire service territory.
By using these two systems together the GIS can track the location and status of all the assets while the asset management system can be used to manage the costs and work associated with maintaining the infrastructure.
Geospatial Information Systems
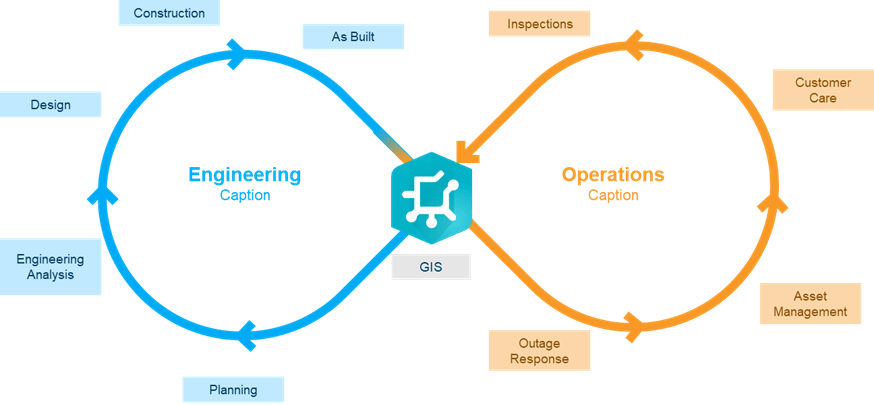
An enterprise GIS is about more than just making maps. This is a vital component in managing the lifecycle of an asset; beginning with its installation as part of a work order, updated through maintenance and inspection, and ultimately its replacement/retirement from in-service. The accuracy of this information is maintained and kept up to date by office staff, as well as field crews who can view and edit the GIS using mobile apps.
In addition to the location of the asset, the GIS also carries important information from the work order about assets like the date installed, the number of the work order that installed it, and the materials associated with the asset. Maintaining this more granular, spatial asset information in a GIS allows you to be very precise in both your analysis and maintenance of your assets. Does this necessarily mean that a GIS is better than an asset management system? No. The two systems are complementary. A GIS is a high-accuracy, reliable record of what and where assets are currently installed in the field. An asset management system is a detailed accounting of all the materials, labor, and work associated with all assets that have ever existed.
Complementary Systems
Now that we understand the purpose of these complementary systems, let’s look at a specific example of how they could be used to estimate the relative risk of failure for an asset using a CBM-style strategy. The first step to this approach is to identify observations we have for each asset that can be used to assign a risk value.
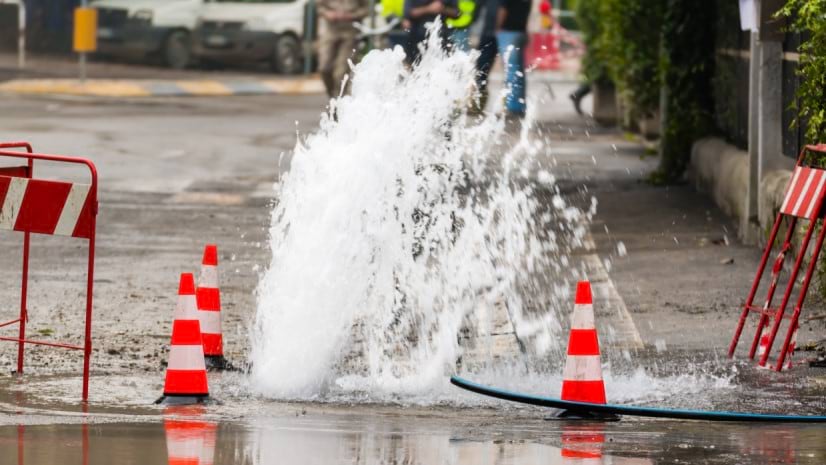
From the asset management system, we can start by looking at the work order history for all the pipes we’ve had to replace because of a structural failure (break or leak). If we look at the material information for the pipes that we replaced, we can begin to see that certain materials have historically had a higher failure rate than other materials, in CBM terms we would say that the materials associated with the pipe are a measurable risk factor.
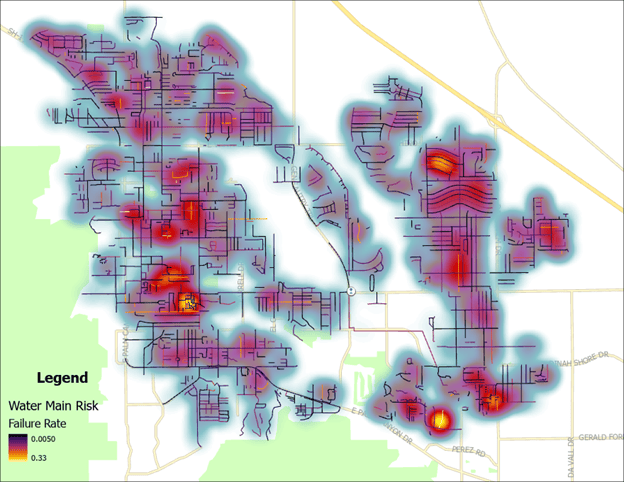
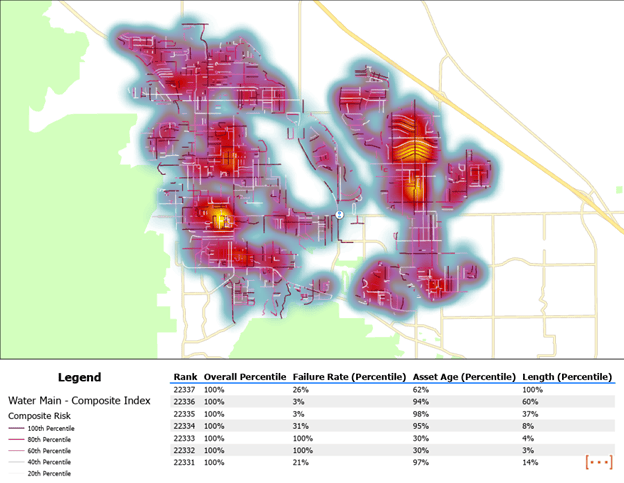
The next step is to take this knowledge and look for these materials in the GIS. By joining the estimated failure rates of pipes from the asset management systems with the material information from the GIS we can quickly identify areas that contain higher densities of pipes that are at risk. While this is certainly an interesting map, it only represents one risk factor for pipes, and it isn’t immediately apparent how we can use this information to develop a plan to improve our system. This is where we will use the spatial capabilities of GIS to help provide more precise answers.
The next step in this analysis is to use information from the GIS to calculate additional risk factors for these pipes. This can start with basic information like the age of the material or the type of soil the pipe is buried in but can also include information about leaks or repairs that have been made to the pipe. Once we have identified multiple risk factors for the pipe, we can then use this information to calculate the probability of failure for the asset.
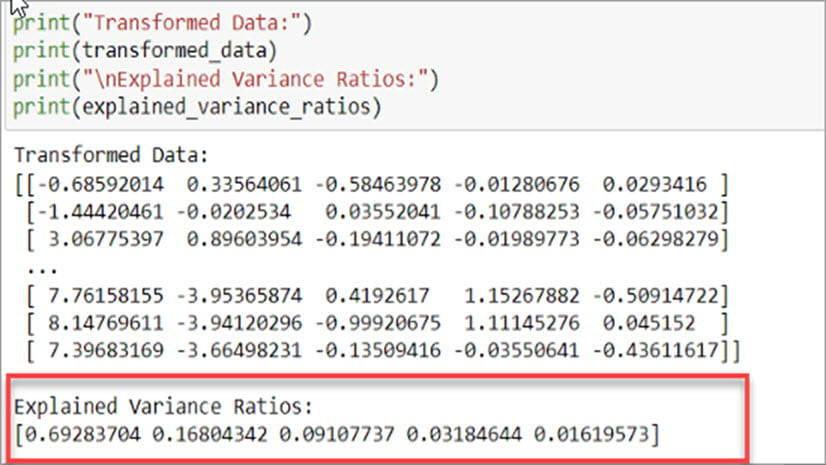
Believe it or not, ArcGIS Pro has a tool that is designed specifically to perform this kind of calculation, although in spatial statistics terms this is referred to as creating a composite index. The Calculate Composite Index tool allows us to define a process for combining a series of measurements into a single indicator variable through a process of assigning weights and combining the measurements for each feature. The resulting index can be used to display the results of your analysis but also provides you with a single prioritized list of all the pipes in the system.
Conclusion
Now that we’ve calculated risk factors and assigned an overall risk score for all our assets, you’d be tempted to think that we’re done. Not quite! The scores that we have calculated just show the relative likelihood that a given asset will fail. These scores don’t take into consideration that a failure that impacts 1,000 customers should be considered more important than a failure that only impacts a single customer. This is known as calculating the consequence of failure and it is the topic of the next article in this series. Watch this space for the next article, as it should be published in the next few weeks.
If you want to learn more about condition-based maintenance and its role in risk management I recommend you read this Understanding Infrastructure Risk Assessment article written by Esri partner Cityworks. If you’re looking for more examples of how organizations have used GIS to manage infrastructure, I recommend you read the Making infrastructure customers successful article.

Commenting is not enabled for this article.