Compound indexes condense multiple variables into a single measure and provide a simplified representation of complex data. By aggregating several variables, compound indexes provide a comprehensive overview of a concept or phenomenon such as economic distress or social disadvantage that are based on multiple factors. This makes it easier for policymakers, researchers, and stakeholders to understand both the local impacts and the overall picture, leading to more informed decision-making and intervention choices.
A crucial step in calculating an index score is applying weights to index variables or indicators. By assigning appropriate weights, the index can accurately represent the significance of each variable for the overarching concept. The weights can be determined through domain knowledge or using empirical statistical techniques such as principal component analysis (PCA) to identify the variables with the highest explanatory power. In a previous blog post titled Creating an economic distress index layer using Census data with Python, we provided a detailed explanation of how to construct an index using Python. Now, we will build upon this example to show how to perform principal component analysis to determine weights for index indicators.
Use PCA to determine weights for index indicators
Principal component analysis (PCA) can serve as a method for determining the weights in an index. PCA is a statistical method that identifies the underlying factors or components driving the variation in a dataset. This blog article will walk you through the process of performing principal component analysis using Python.
To demonstrate how to conduct principal component analysis with Python, we will follow a seven-step process:
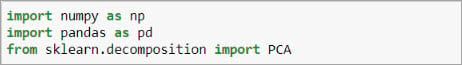
1.Import the required libraries.
To conduct PCA in Python, you can use libraries such as NumPy, pandas, and scikit-learn.
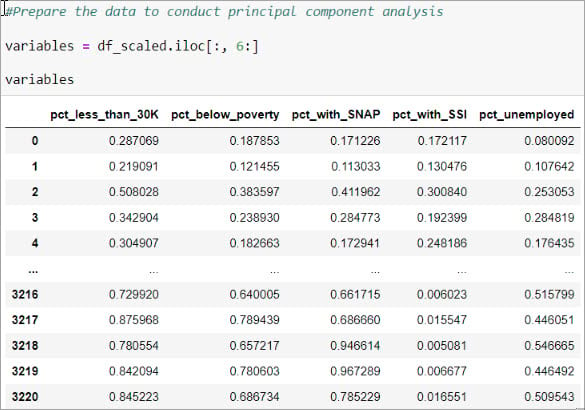
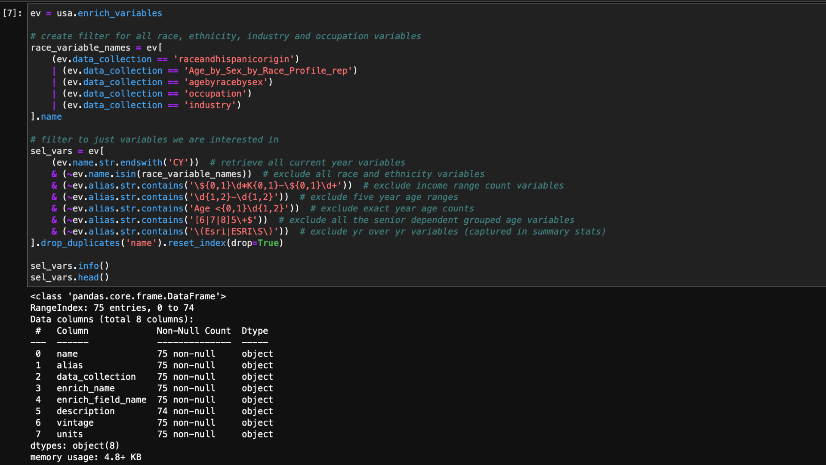
2.Prepare your data.
Collect data for the index constituents, including only relevant economic distress indicators. Ensure that your dataset does not contain any categorical data as PCA can only operate on numerical data. Then create a data frame with the data, where each column represents a different index metric. The data frame should consist of the subset of data you wish to apply PCA to, excluding any columns that are not relevant to the analysis.
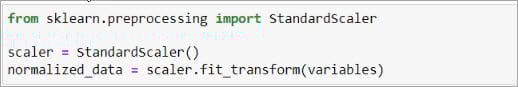
3.Standardize the data.
It is important to standardize the index metrics before performing PCA. This ensures that each indicator contributes equally to the analysis. Use the StandardScaler from scikit-learn to normalize the data.
4.Perform PCA.
Now, you are ready to perform PCA. To accomplish this, initialize a PCA object with the desired number of components. Feel free to adjust the number of components (n_components) based on your needs. Then, fit the model to the normalized data using the fit() method. Finally, retrieve the component loadings and explained variance ratios from the fitted model.
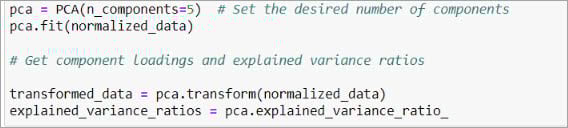
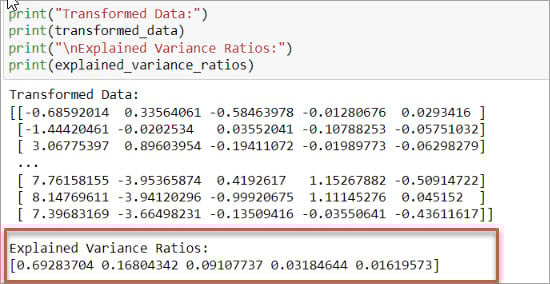
After running this code, you will get the transformed data in the transformed_data array, where each row represents an observation, and each column represents a principal component.
The explained variance ratios are stored in the explained_variance_ratios array, indicating the proportion of variance explained by each principal component.
5.Determine index weights for each component.
These explained variance ratios help in understanding the relative importance of each component in capturing the overall variability of the data. Higher explained variance ratios suggest that a component has a more significant impact on the overall variance and should be considered more important when determining the weights for the index components.
Analyze the explained variance ratios of each component. Higher ratios indicate a stronger influence of that component on the index. In this example, the output indicates that the first principal component explains 69% of the variance, the second component explains 17% of the remaining variance, the third component explains 9% of the remaining variance, and so on. Looking at these ratios, we decide to use the first principal component loadings, which explain nearly 70% of the variation in our data.
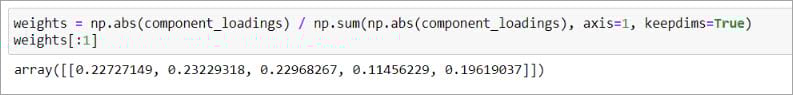
6.Normalize component loadings.
To assign weights to each index component, we first normalize the component loadings to sum up to 1 for each component, ensuring the weights represent relative contributions. Then, using the first principal component loadings, we get the weights for each index indicator in our dataset. For instance, PCA calculates a weight of 0.22 for the first variable (pct_less_than_30K) in our dataset, 0.23 for the second variable (pct_below_poverty), and so forth.
7.Apply resulting weights to index indicators.
To finalize the process, we apply the obtained weights to the index indicators within our dataset.
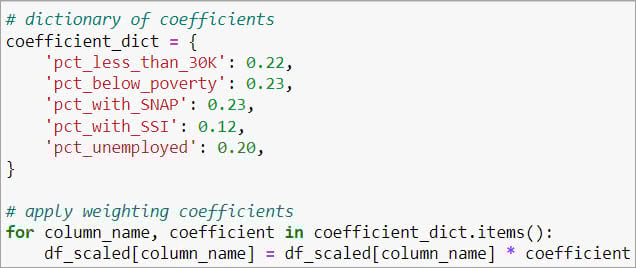
Consequently, you can compute a weighted average index score by the mean index score by aggregating these weighted index indicators. For information on the calculation of a composite economic distress index score, please refer to the blog article titled Creating an economic distress index layer using Census data with Python.
This blog article has outlined the process of performing PCA using Python. For a thorough understanding of the step-by-step process involved in this workflow, we invite you to explore our comprehensive Python notebook available at this link. By following the step-by-step instructions, researchers and policymakers can effectively apply PCA to assign weights to index indicators, providing a more nuanced understanding of the underlying concept. Ultimately, the resulting weighted index score facilitates comprehensive analysis and informed decision-making in various fields.
For more information about PCA, here are some resources to help you understand the fundamentals of PCA and its implementation in Python using libraries like scikit-learn.
A Step-by-Step Explanation of Principal Component Analysis (PCA)
Principal Component Analysis (PCA) in Python Tutorial


Article Discussion: