Over time even the most well-crafted machines wear down and, if not properly maintained, eventually break. However, the consequences of equipment failures cannot all be treated equally. In our previous article, we discussed how the geographic approach can be used to better identify and understand the various risk factors associated with an aging infrastructure. In this article we will look at techniques to quantify the consequence of a failure in the infrastructure.
A good start to calculating consequences is to quantify them using basic information about the equipment that could fail.
- How expensive is the equipment?
- Is the equipment difficult to replace?
- Are the materials or tools required to repair the equipment readily available?
All of the above are questions you can answer using traditional methods to quantify the consequence of failure; however, there are also more interesting questions that we should try to answer to quantify a failure. When equipment failures result in a loss of an essential resource it’s important to understand exactly how many people are affected, and how long it will take to restore access.
We’ll show you how using the geographic approach can help you provide precise answers to these questions in ways that other systems can only approximate.
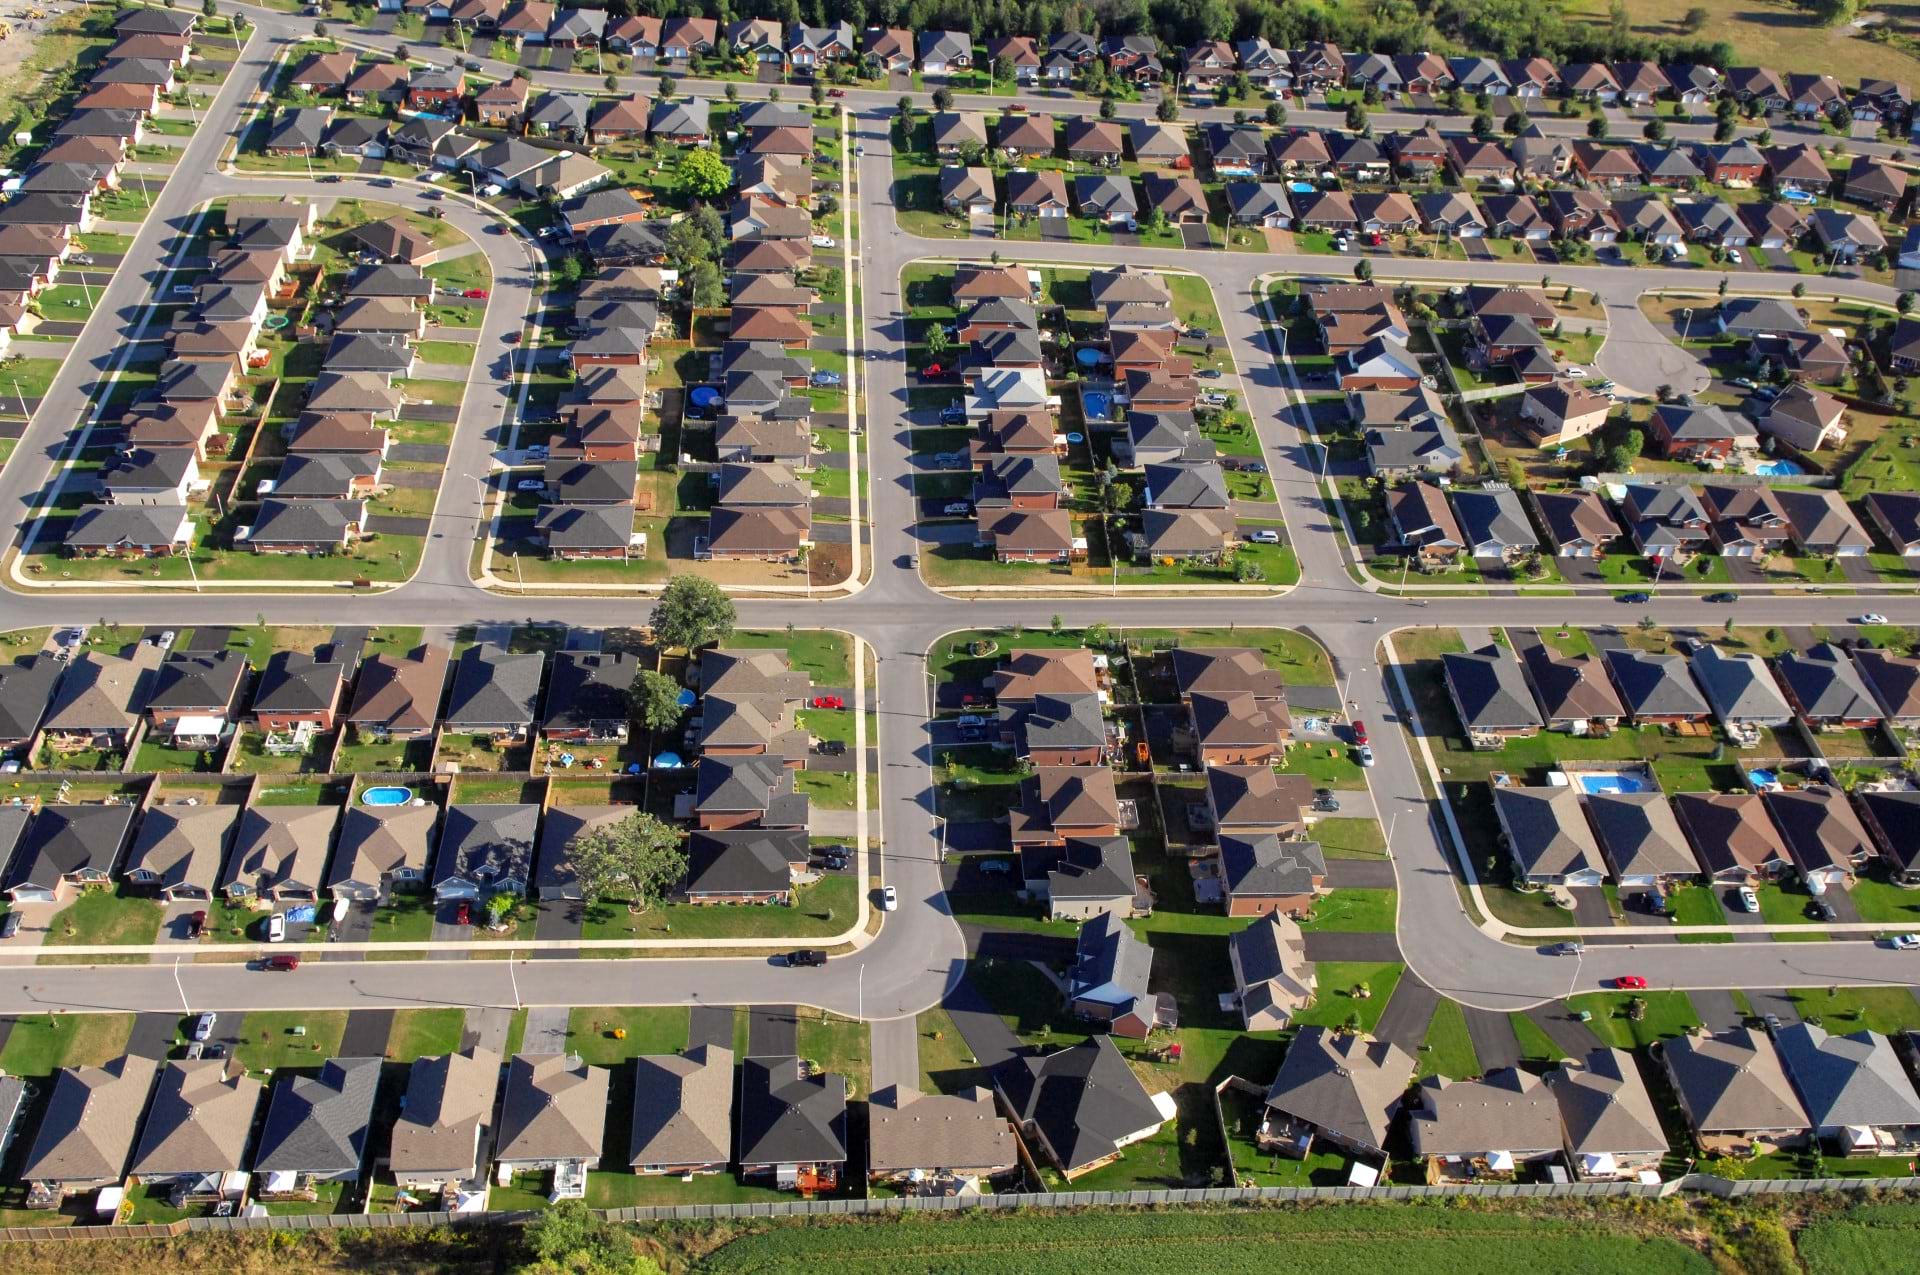
For this article, we will be considering the impacts of a water main break in a water distribution network. This is a relatively straightforward example to understand, but the techniques discussed apply to other types of distribution networks such as electric or gas distribution.
A water distribution system is a system in which pressure is used to move water from a limited number of water sources to all the consumers in the system. It is this pressure that ensures that water comes streaming out of a faucet when you open the tap. If one of these pipes were to crack or break, this would result in some or all the water in the pipe being released into the ground surrounding the pipe. This would result in a decline in water pressure in the area surrounding the pipe, as well as erosion or sinkholes. Repairing the pipe can be as simple as repairing the leak, but in extreme scenarios, it may require shutting off water to an area so a new pipe can be installed.
Scope of failure
The first step when calculating the consequence of failure is to determine what metrics are important to measure in the event of a failure. The easiest and most common examples are to calculate the number of customers affected and the size of the area impacted, but it is sometimes possible to derive more complex numbers like estimated time/cost to repair and even lost revenue. We could also try and determine the impacts of erosion caused by the leak/failure, but this would be more difficult to reliably calculate.
The key is to first identify how your organization measures the overall impact of a failure from an engineering and operational perspective. Once you know how you want to measure potential risk factors, you can then evaluate whether you have the data to reliably estimate or calculate each risk factor.
The data requirements and analysis you perform will depend on the type of failure you are simulating. For instance, if you are analyzing a blockage in a stormwater system you will use flow and elevation data to simulate a flooding event. In the case of our water main failure example, we will be using a pipe network that includes information about mains, pipes, and the equipment that controls flow/pressure in the network.
Network Analysis
GIS is a powerful analytical tool that allows you to perform many types of analysis, more than could be described in this article. For a thorough summary of various spatial analytical techniques, I strongly recommend you read the Language of Spatial Analysis technical paper published by Esri. For the purposes of this article, we will be looking at answering the two basic values we outlined in the previous section:
- How many customers are affected, and what is the size of the area impacted?
Most water utilities maintain a map of all their water mains. Customers who model their water distribution with ArcGIS tend to take this to the next level by also maintaining a network topology of all their distribution assets. These topologies not only ensure that fittings, pipes, and devices are all properly connected but also allow for different forms of network analysis.
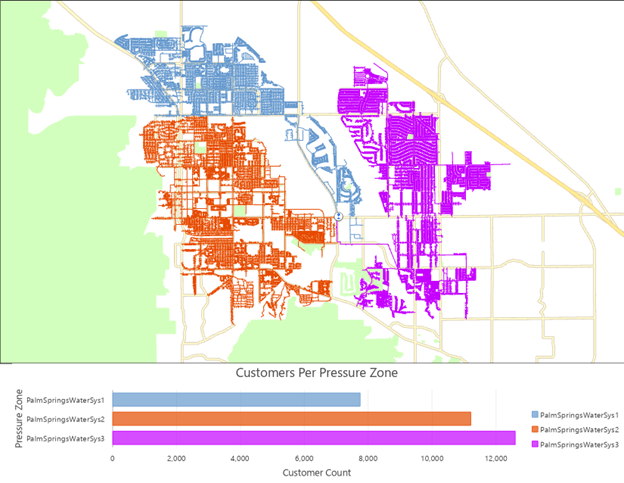
It is a relatively simple operation to calculate the area and customers impacted by a water main leak by performing a network analysis or trace. An undetected leak will cause a drop of pressure for an entire pressure zone, and because many utilities maintain information about the size and number of customers for each pressure zone in their distribution system it is an easy calculation to determine this information by simply looking at which pressure zone the main belongs to.
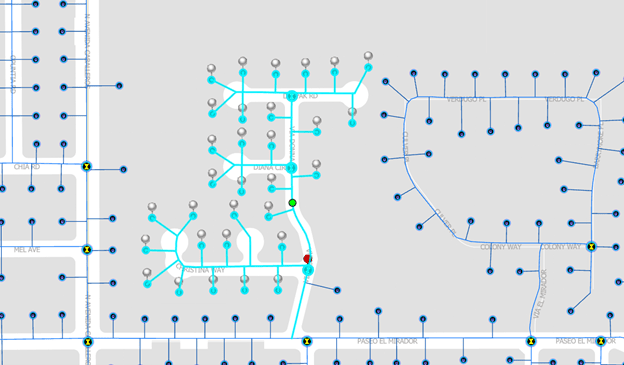
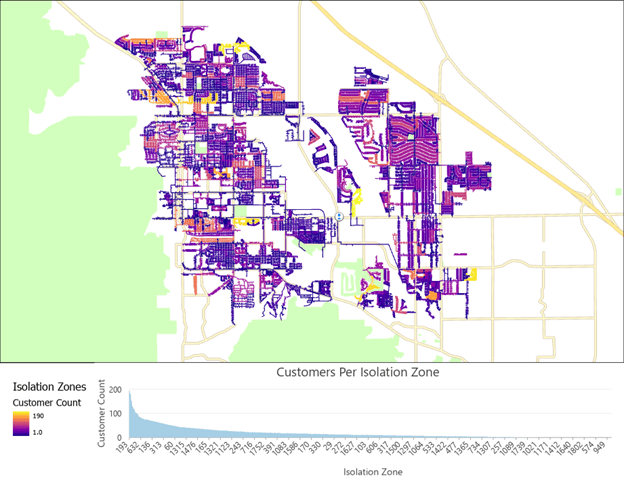
A more important analysis is to look at the minimum number of customers that would be affected by a main breaking. This can be determined by looking at all the valves available to isolate a failing pipe, simulating isolating that section of the network, and then calculating the size of the area impacted and the number of customers affected. This analysis is known as performing an isolation trace and represents such a foundational form of analysis in network models that Esri provides functions for performing this analysis OOTB using products like the ArcGIS Utility Network.
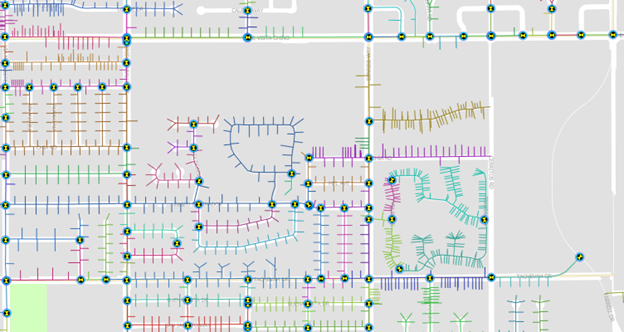
Once the statistics about the area impacted for a specific main have been calculated using the isolation trace, those statistics are shared for the other mains in the same isolation zone since a failure of any main in that area will produce the same result. Even though this information can be quickly calculated on the fly, there are some utilities who maintain these isolation zones as an explicit set of features in their GIS, in a similar manner to how they manage pressure zones. Calculating and maintaining a set of isolation zones is a good practice if you plan on performing this kind of analysis on a regular basis. If you are a customer who uses the ArcGIS Utility Network, subnetworks can be used to help track and manage this information.
Aggregate failures into projects and summarize statistics
Calculating statistics for the different isolation and pressure zones not only provides us with meaningful statistics about the failure of individual assets, but also provides us a meaningful way of aggregating and analyzing our results.
Consider the example of an isolation zone; we know that in the case of a water main failure, we would need to turn off water for all customers in that area while crews dug up the street and repaired the pipe. The same work applies if we were to create a project to replace at-risk pipes in this area. This presents another way of thinking about risk. Instead of looking at all our risks at an asset level, we should consider using these isolation zones as potential “project areas”, to aggregate the risks for the individual assets alongside the impacts of each project area. This approach allows us to prioritize repairs in areas of our network with multiple at-risk assets to minimize the number of service interruptions to our customers.
Conclusion
If you’ve read the previous article, you can now see how GIS can be used to calculate individual risk factors, aggregate these factors to specific assets, and then aggregate the assets into meaningful project areas. With this data, you now have a detailed picture of the engineering and operational risks and impacts for your network.
We’re not quiet finished yet! This data remains very raw and is not something that’s suitable for presentation to management or for making decisions. In the next article, we will show how you can use GIS to convert this raw data into actionable information that can be put in front of the decision-makers and stakeholders in your organization.


Commenting is not enabled for this article.