This blog post and tutorial were last updated on April 12th, 2022 to include improvements to the data review step in the crowdsource workflow, thanks to new Survey123 features!
Maps create a sense of place, especially when the illustrated phenomena hit close to home. They have the power to evoke emotional responses in us as readers, particularly when we can see ourselves in the data. Crowdsourced maps take that feeling and turn it into something actionable. You can insert yourself into the data, broaden a viewpoint, and even contribute to a cause you care about.
Crowdsourcing a map means gathering opinions, data, or information from a group of people and displaying that information spatially. This is often done by asking readers to volunteer answers to a series of questions. The mapped view of these responses is particularly powerful when it’s added into a story, complete with a narrative and other media adding context to the discussion. The live data feed allows your story to evolve as readers provide more information, making the content richer and deeper with every submission.
When (not) to use crowdsourced data in a story
Crowdsourcing is a powerful tool, but it’s not right for every story. Making sure you know your “why” is particularly important; if it’s not compelling enough, or you don’t have the right audience, crowdsourcing may not yield many responses and may be inappropriate.
Here are a few solid reasons for adding a crowdsourced element to your story:
- You want to engage with a community on a mutually beneficial topic
- You want to connect readers to your topic in a place-based manner and help them see themselves in the larger narrative
- You want a real-time view of community perspectives on your topic now and in the future
- You want to create a sense of connectivity and appreciation for various experiences
- You have a practical application, like understanding where a community may want a new park
While these are tried and true motivations for a successful crowdsourced component, ultimately, the technique is flexible. When done right, crowdsourcing can elevate community stories and opinions, even creating change or inspiring action.
Of course, it’s important to recognize when crowdsourcing might not be appropriate, as these initiatives can fail to get participation, or worse, motivate negative action or change.
Here are a few reasons to decide against using crowdsourcing in your story:
- You want to ask more than a couple of questions; long surveys will discourage participation and the responses can be cumbersome to display
- You need sensitive or personally identifiable information
- Your questions do not enrich your narrative in a meaningful way, or they distract from the experience
- Your audience does not know enough about the subject matter to contribute or it’s premature to engage them in it
- You do not have the bandwidth to maintain it
Examples of crowdsourced data in storytelling
Let’s look at some examples of how authors have incorporated crowdsourced data directly into ArcGIS StoryMaps.
Birdability Map Viewer
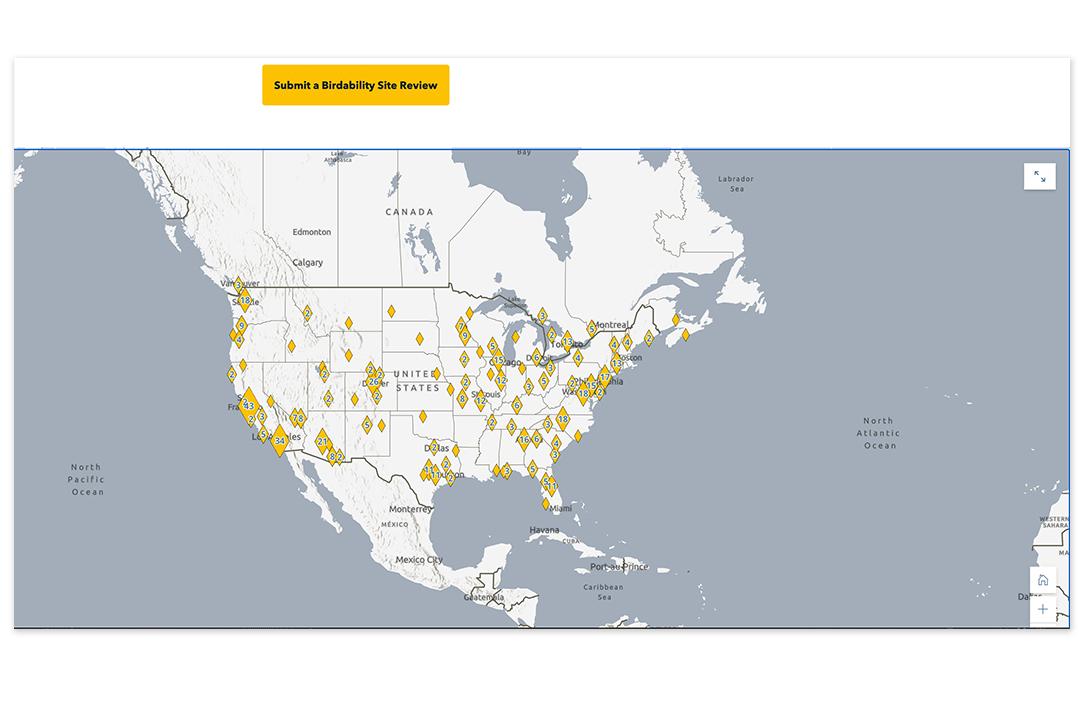
Birdability Map Viewer, a story by the National Audubon Society, uses crowdsourcing to glean practical information from community members. Audubon uses crowdsourced data to communicate the accessibility of outdoor locations. Each point represents a trail, park, or birding area, and contains information about parking, trail slope, trail conditions and more. This implementation allows anyone who goes outside to submit a “Birdability Review” and instantly see their point come to life on the map. It also streamlines the search for accessibility information by offering a near real-time, honest review of sites and their features, both accessible and inaccessible.
Storytelling for the SDGs
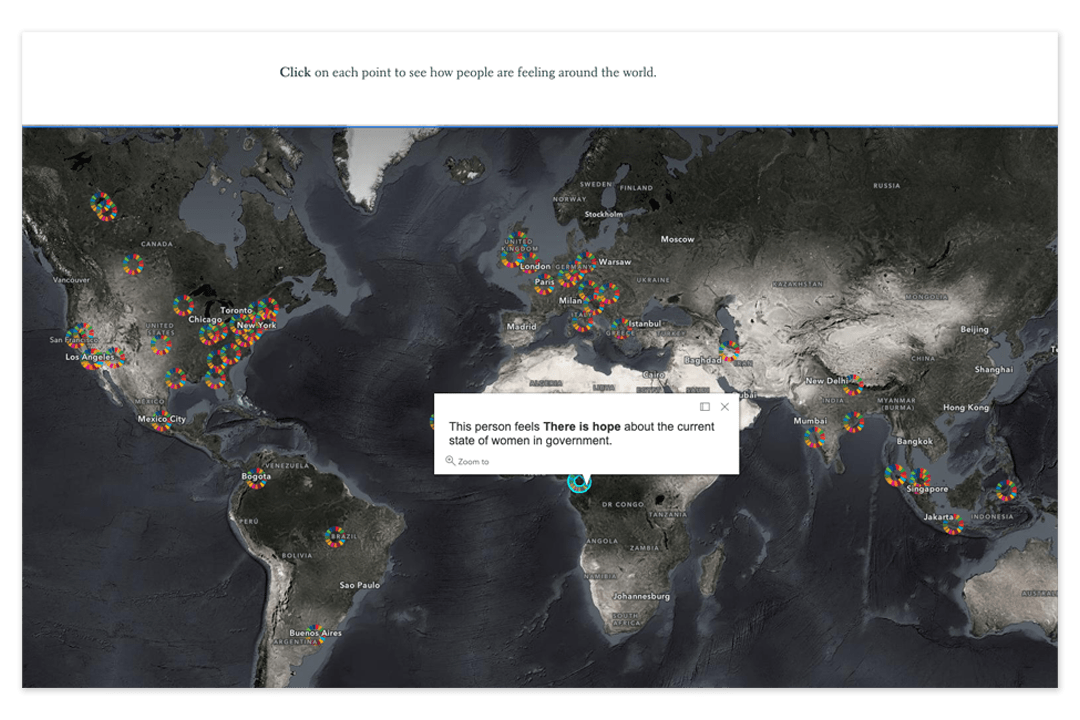
In Storytelling for the SDGs, crowdsourcing is used to gather community sentiments around the United Nation’s Sustainable Development Goal 5: Achieve gender equality and empower all women and girls. It uses a two-question survey to ask how people feel about the current state of women’s representation in government. In the story, the map comes alive with a range of thoughts and opinions from around the world. The questions and the pop-ups are easy to understand, and it wastes no time getting to the heart of the topic.
Share your EarthPlaces
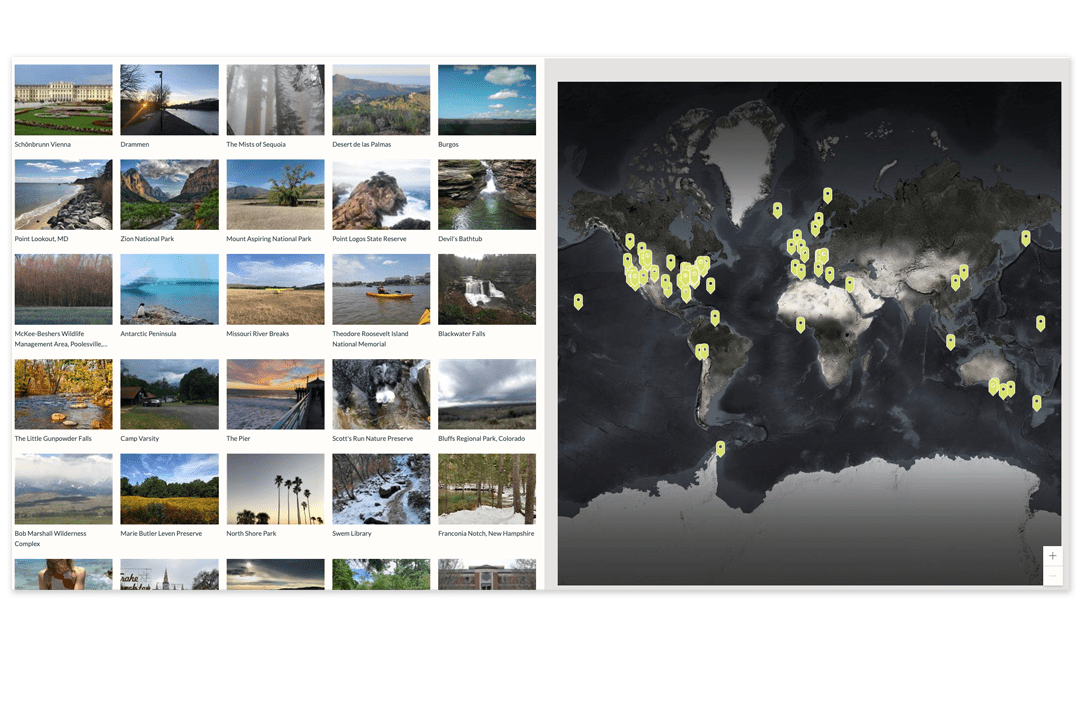
Share Your EarthPlaces relies on crowdsourced data submitted using ArcGIS Survey123. The survey results are funneled into a data-driven map tour, were the supplied image, location, title, and description appear on the map in real time. It’s a simple workflow that creates a fun and engaging experience, letting readers share and discover meaningful places around the world.
If crowdsourcing is something you want to try in your next story, check out our tutorial with multiple workflows of how to do this using Esri technology. These simple workflows can enhance your storytelling and engage your audiences. Explore this collection of stories to see how leading organizations use crowdsourced data to engage their audiences.
We can’t wait to see what you create.



Article Discussion: