Great stories keep readers engaged from start to finish, but slow-loading maps, browser crashes, and lagging videos can distract from your story. Improving story performance helps readers spend more time exploring your content and less time waiting for it to load.
ArcGIS StoryMaps helps improve performance automatically, but as an author, you still need to make choices based on who will read your story, how they will access it, and the goals of the story. Will most readers access the story at work on a powerful computer with fast internet, or on a phone over a slow mobile network?
These best practices help you make those choices, so your story performs as expected and prevents poor reader experiences.
Story Structure
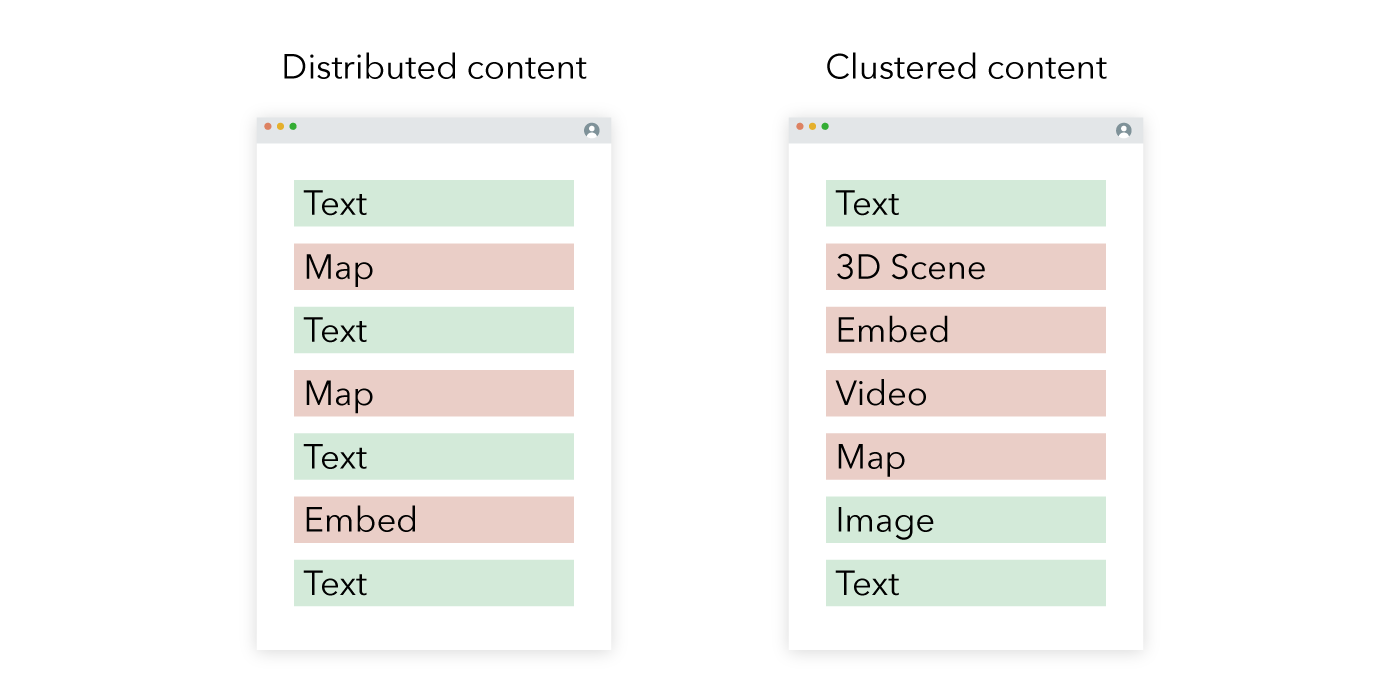
An effective story structure will set you up for faster loading times. ArcGIS StoryMaps automatically loads all your story text, then any pieces of visible content. The sidecar block loads the current slide, the next two, and the previous slide. This means that up to four slides’ worth of media can be loaded simultaneously. Develop a story structure that spreads resource-intensive content throughout your story rather than condensing it together. A simple story structure that relies less on interactive blocks and more on in-line blocks will perform better for low-bandwidth audiences.
- Use interactive blocks in moderation
- Avoid clustering heavy content in one section; space them across your story
- Limit the number of slides in a sidecar immersive
- If your story is getting long, consider using collections to break up your content
Maps
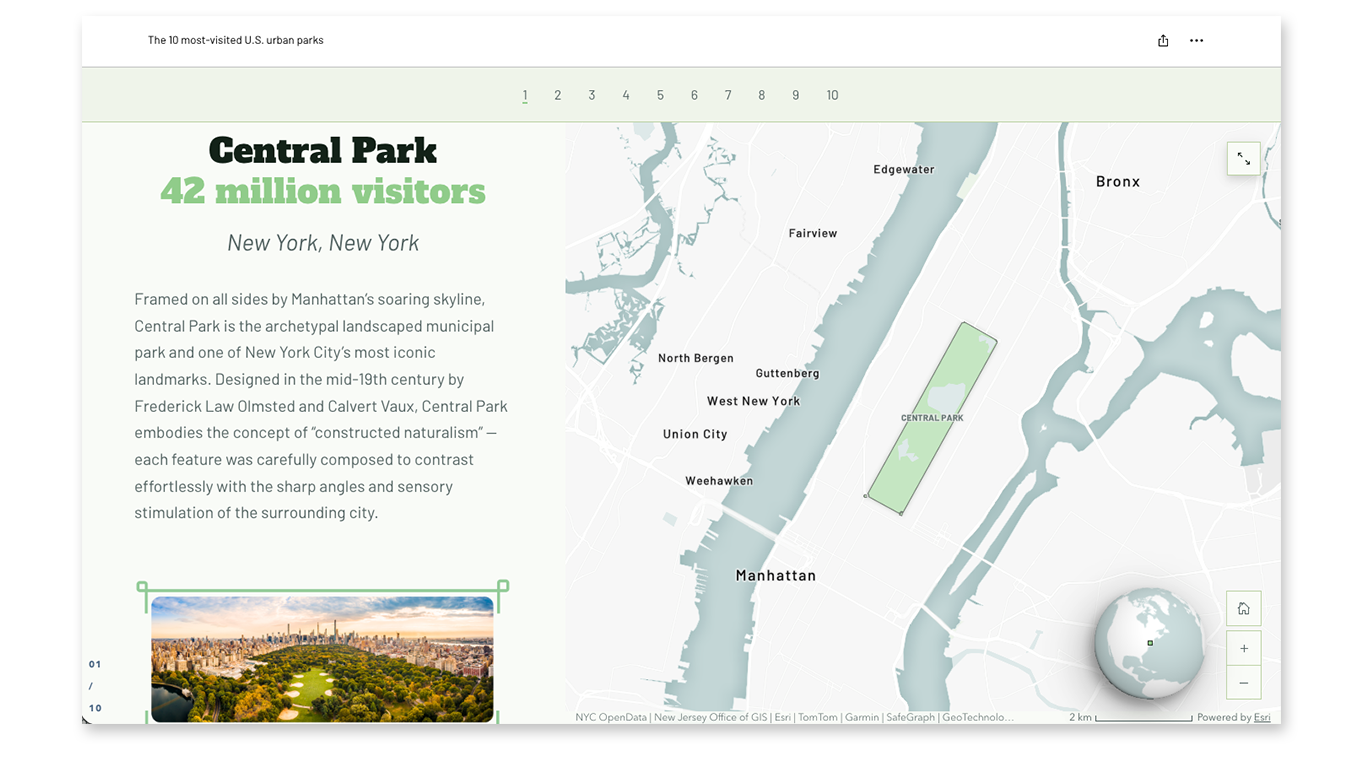
Web maps (and scenes) are a core capability of ArcGIS StoryMaps, but the number and type of layers in a map can greatly affect load times. Non-visible layers in a web map still load in the background, so they affect performance. We recommend keeping web maps to fewer than 10 layers. To optimize web maps for storytelling, remove unnecessary layers or, when appropriate, choose static or express maps to improve story performance. It is also best to reuse maps across slides in a sidecar whenever possible. Reusing a map improves performance because it only needs to be loaded once, creating a faster and more seamless experience for readers. The Review map tool in Map Viewer is a helpful resource for optimizing your web maps. It provides a prioritized list of recommendations and direct access to relevant settings, making it easier to improve map performance before adding it to a story.
- Avoid using interactive maps with more than 10 layers
- Remove unused or non-critical layers
- Use static maps when interactive maps become too heavy
- 3D scenes can affect story performance more than web maps. Use them sparingly if your readers have limited bandwidth.
Media
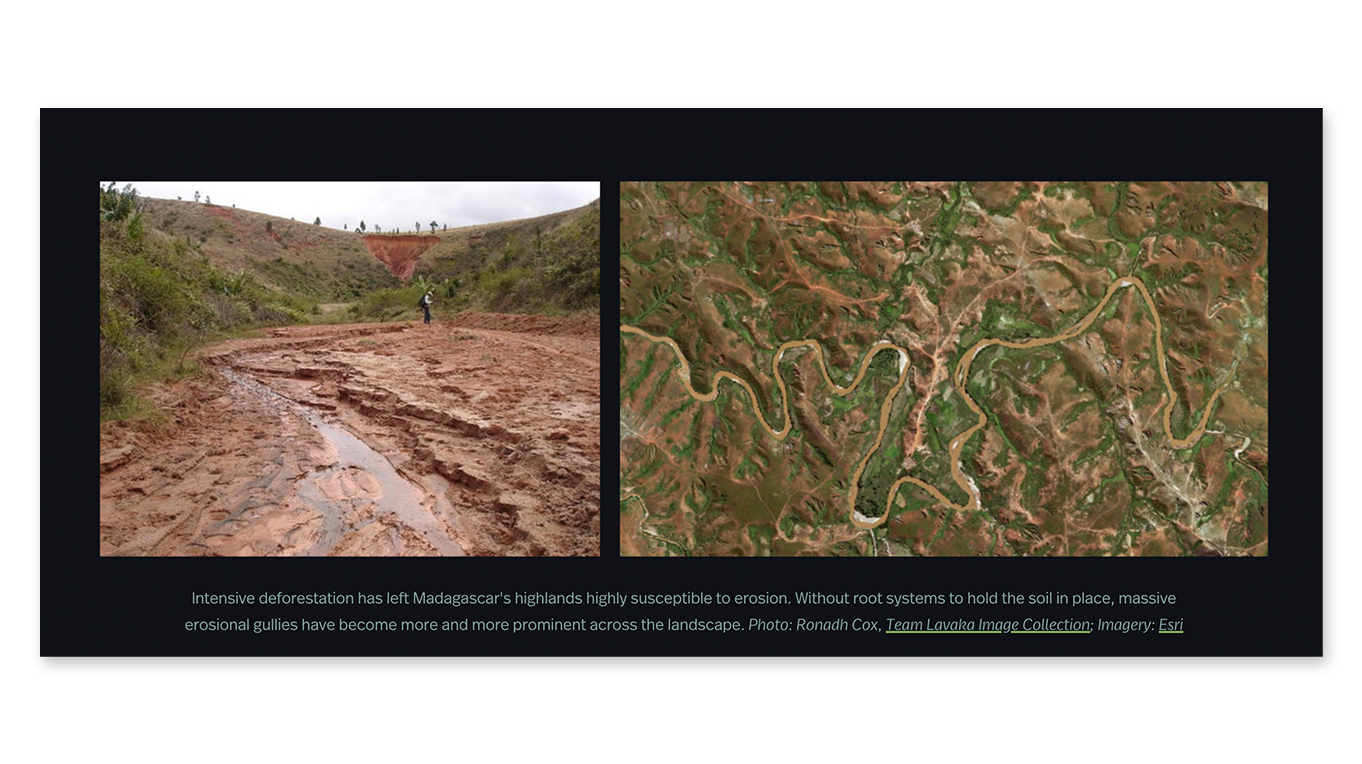
Thoughtful media choices will improve performance and reinforce your key messages. ArcGIS StoryMaps automatically optimizes uploaded images, but videos and GIFs can affect load times. For low-bandwidth audiences, consider using static images in your story over videos or GIFs. If videos are necessary, consider trimming your videos and optimizing them for the web. Use this useful media reference guide for supported media file types in ArcGIS StoryMaps. It provides guidance on recommended file formats, dimensions, and specifications to help ensure your media loads efficiently and displays as intended.
- Videos used as cover media will load more slowly than images. Edit cover videos carefully for quick loading, as this affects readers’ first impressions of the story.
- Image file size has a negligible impact on story performance due to in-app optimization.
- If inline videos appear in the same view as other heavy content, such as web maps or embedded apps, they are more likely to affect story performance.
- Consider embedding large videos from 3rd-party services like YouTube or Vimeo
Embeds
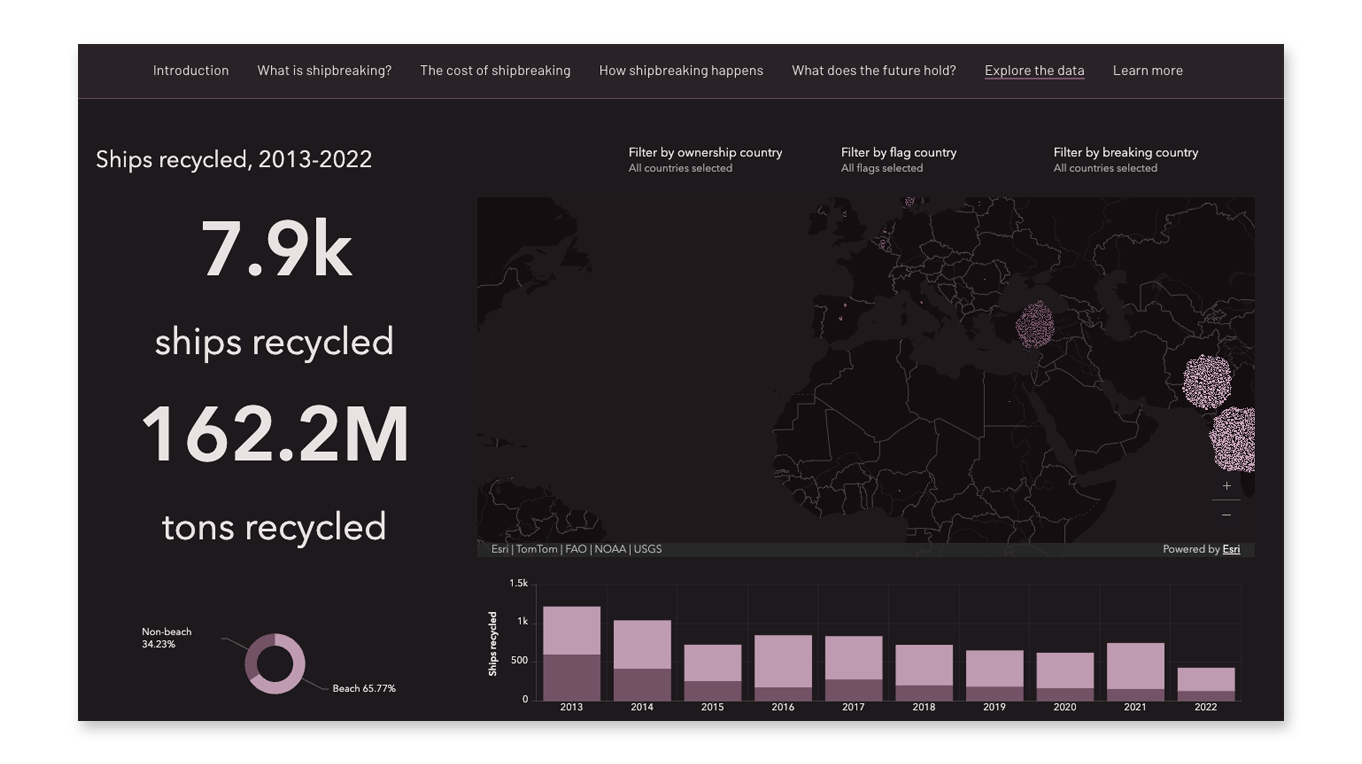
Embedded content can significantly impact story performance, especially in complex apps. This content is best suited to readers on desktop computers with fast internet connections. If you expect your readers to have low bandwidth, consider using embed cards, static images, or hyperlinks instead of live embeds to reduce load times.
- Slow or complex embedded apps should be placed away from other resource-intensive content in stories.
- Be cautious about loading live embeds on mobile — and be sure to test performance, especially on older mobile devices.
- Use cards or hyperlinks for low-bandwidth audiences over live embeds when it won’t negatively affect the reading experience
Testing
The best practices in this blog serve as a guide for successful story performance. However, nothing replaces testing your story early and often. Testing shows how readers experience your story. Browser developer tools can simulate slower networks, mobile devices, and reduced processing power, and can help identify performance bottlenecks. Ask your colleagues or a friend to test the story to see if they experience any performance issues when viewing it. Remember, if maps are loading slowly in Map Viewer or Scene Viewer, they will likely load slowly in a story as well.

Final thoughts
Story performance ultimately comes down to designing for your audience. The best stories balance rich interactive content with reliable performance. By structuring your story thoughtfully, choosing its content with intention, and testing it early, you can create experiences that are both engaging and accessible.

Thank you to Cooper Thomas, Stephen Sylvia, Gustavo Cardenas, and Owen Evans for their contributions to this post.





Article Discussion: