ArcGIS StoryMaps frames can offer the ability to create mobile-first, shareable web applications, and make use of existing map-based content you might already have. This article tells the story of how I created “Number One: A Wilhelm Scream by the Numbers” to bring audiences a closer look at the location-based statistics the band has racked up on tour over the years.
How it began
A few decades ago, long before the invention of the smart phone or social media, I was privileged to begin a friendship with an underground punk band called A Wilhelm Scream on their first tour outside of the northeastern United States. I was able to play live shows alongside the group in the subsequent years that followed with my own local band and have never missed seeing a tour pass through my region since.
At a tour stop in 2023, I was talking about some of the old shows we played together with their tour manager, Ray Picard, and he showed me a spreadsheet on his laptop that he was keeping which listed every tour date since the beginning of the band. A few months later, I was able to use the details captured in the spreadsheet to compose a geocoded master list of cities in .CSV format that could be brought into Map Viewer on ArcGIS Online as a spatial layer of data, allowing me to create an interactive web map documenting all of the band’s touring history by location. I used the ArcGIS Vector Tile Style Editor to customize the appearance of the web map, giving it a rougher, grittier cartographic style in line with harder styles of music.

I created a static map for the band as a gift, dry-mounted for wall hanging, along with an ArcGIS Instant Apps Sidebar application called “We Built These Cities!” for viewing on the web.
Repurposing content using frames

When I first saw the beta release for ArcGIS StoryMaps frames in late 2025, I thought it could be used in a way to engage non-technical audiences who frequently consume bite-sized content on a mobile device, often through social media, and usually in portrait orientation. This gave me the idea to take my existing map-focused inventory of live shows and repurpose it within frames to make it more social media-friendly and eye-catching for fans looking to consume a quick hit of content featuring an artist they follow.
In addition to the web map, I also wanted to take advantage of the simple dashboard-style data elements within frames, like numerical indicators and pie charts. Since I had already built my master list containing all the shows played, I was able to easily generate key statistics, like the total number played and the total number of cities, as well as the most frequently played cities, and a breakdown by geographic region. I implemented these throughout the frames application and continue to update them after each leg of a touring cycle is completed, so the application has purpose existing beyond a one-time view for audiences.
Frames provides the ability to include a few simple finishing touches that really enhance the overall end user experience. I was able to set the cover image to be one of the band’s recent press photos that they provided, as well as content slides that list their upcoming tour dates. I have a slide showing the current tour poster and continue to swap it out as needed when those dates are finished. Lastly, I included a call-to-action button that directs users to the band’s main tour page on their website that has ticket purchasing information.
Reaching audiences online and in-person
The band can share the application on social media in a variety of ways, like posts, reels, stories, and direct links. These methods can reach thousands and are vital to independent artists. The accompanying QR code for the frames application is also printed and displayed on the band’s merchandise table for fans to access in-person. I even created an image displaying the QR code intended for mobile devices that can be used as a business card of sorts to promote in-person sharing.
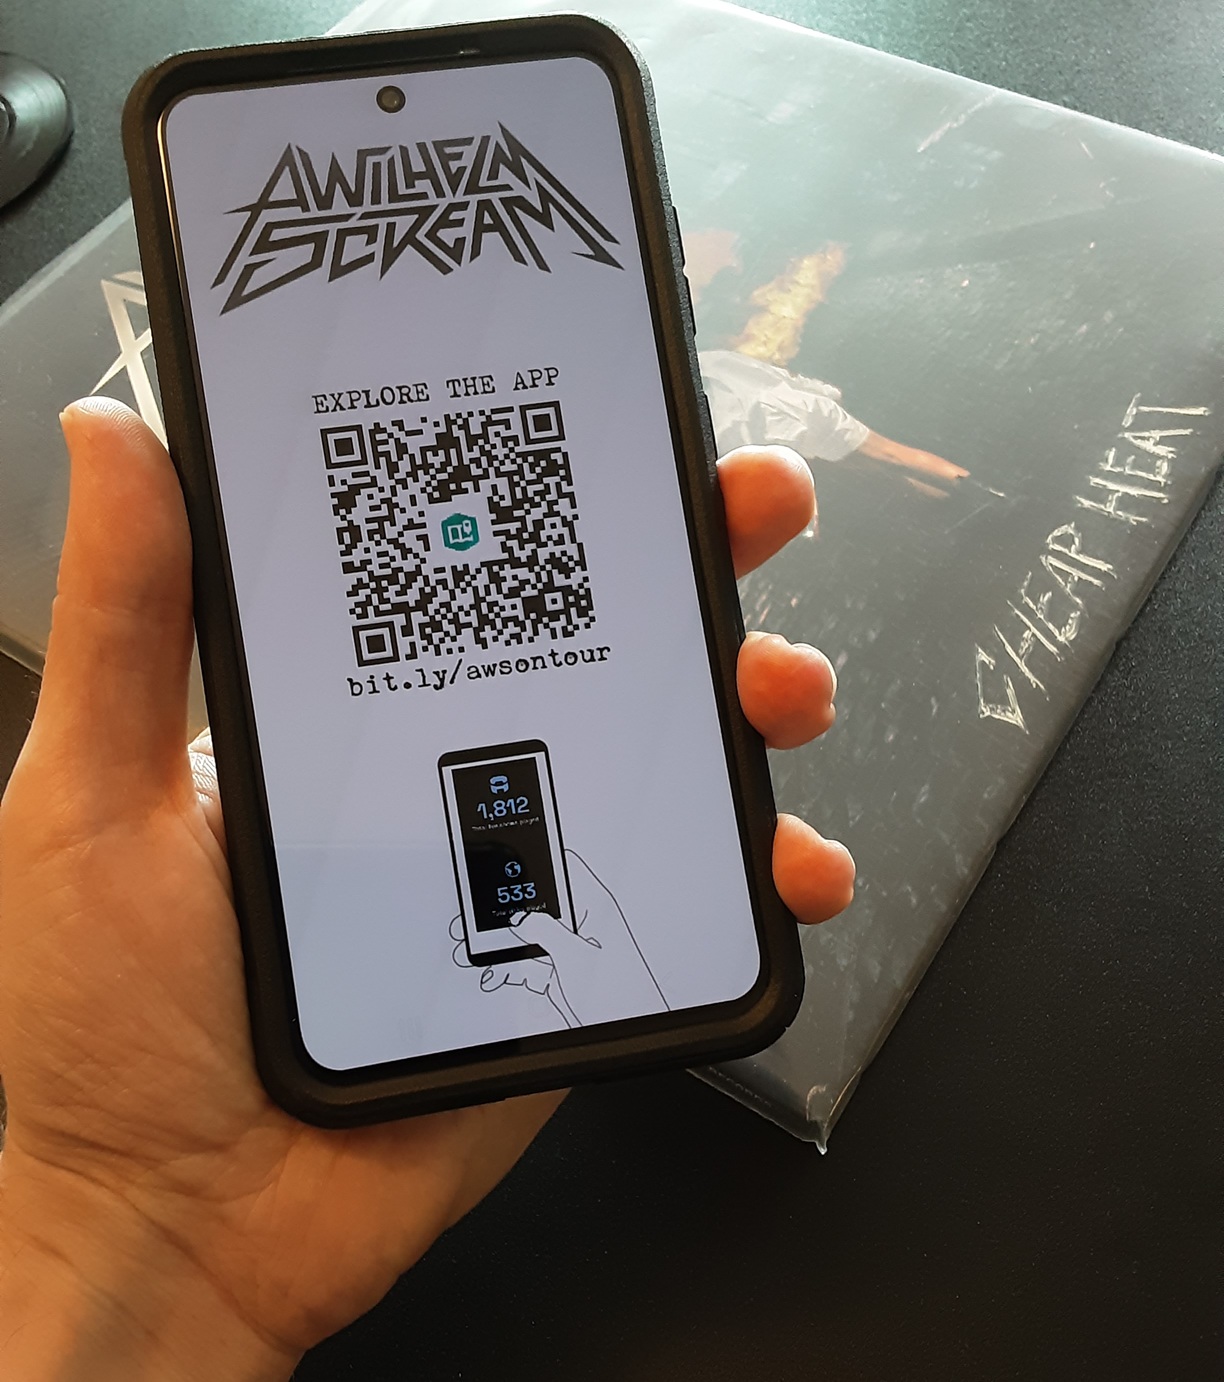
Frames is a powerful addition to the existing set of tools within ArcGIS StoryMaps. What this particular use case demonstrates, is a way for non-technical audiences to consume mobile-first content from creators in a space like arts and music, who have data tied to locations, but are not candidates to implement a full GIS solution involving enterprise-level workflows, geodatabases, or custom code. And the fun doesn’t have to end with a quick hit, it can open the door to build more stories, like an interactive journal for the band’s recent tour of Australia called “Amped Up & Down Under.”
Get started
Give frames in ArcGIS StoryMaps a try with a few initial resources:


Article Discussion: