Whether I’m presenting at a scientific meeting, conference, or in my classroom, I’m always thinking of the outcome and what message I’m driving toward—and you need to be willing to adapt to your audience.
Dr. George McLeod is the Director of the Center for Geospatial Science, Education, and Analytics at Old Dominion University (ODU) in Norfolk, Virginia, where he guides the development, implementation, and operation of the University’s geospatial and data visualization staff and resources.
Dr. McLeod has advocated using GIS to identify and solve problems for nearly two decades. In 2004, he began working at ODU as a GIS engineer, designing and leading innovative GIS initiatives on campus. In 2009, Dr. McLeod expanded his work to sea level rise and coastal resilience, becoming a beacon for the state of Virginia in its efforts to create a coastal resilience master plan.
The StoryMaps team recently sat down with Dr. McLeod to discuss his use of GIS to plan for and communicate the effects of sea level rise and tidal flooding. The following conversation has been edited for brevity and clarity.

Q. Thanks for sharing your experiences with us, George. Can you tell us a bit about your background?
A. Like many undergrads, I really had no idea what I wanted to do. I just picked something and landed on marketing, and I muddled my way through. As time went on, I reflected and realized that many good things did come from the marketing degree, namely that perception is so important, and the story is so important—you’re using a story to sell an idea.
Q. Needless to say, marketing isn’t exactly oceanography. How did you transition from one to the other?
A. After school, I took a position in insurance in the nearby coastal city of Virginia Beach. During my eight years in insurance, I saw the ties between coastal science and the socioeconomic impacts of water events on the community. Around the same time, I met with Tom Allen, a GIS faculty member and surfer. He shared his experiences collecting data in the field and then working through that data on the computer. Those discussions inspired me to return to school, this time for a bachelor’s degree in GIS, followed by a master’s and Ph.D. in oceanography.
Q. This led to your work in sea level rise and tidal flooding, specifically for Norfolk, Virginia. For those unfamiliar with the area, could you give us a local perspective on why these topics are so significant there?
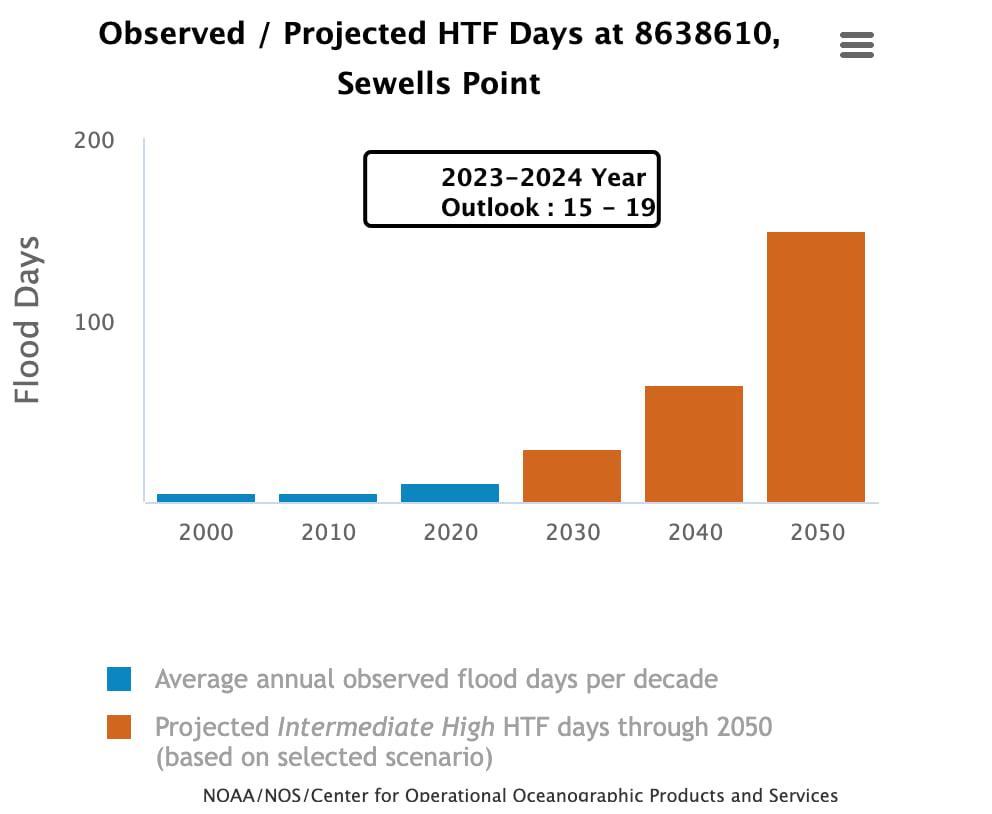
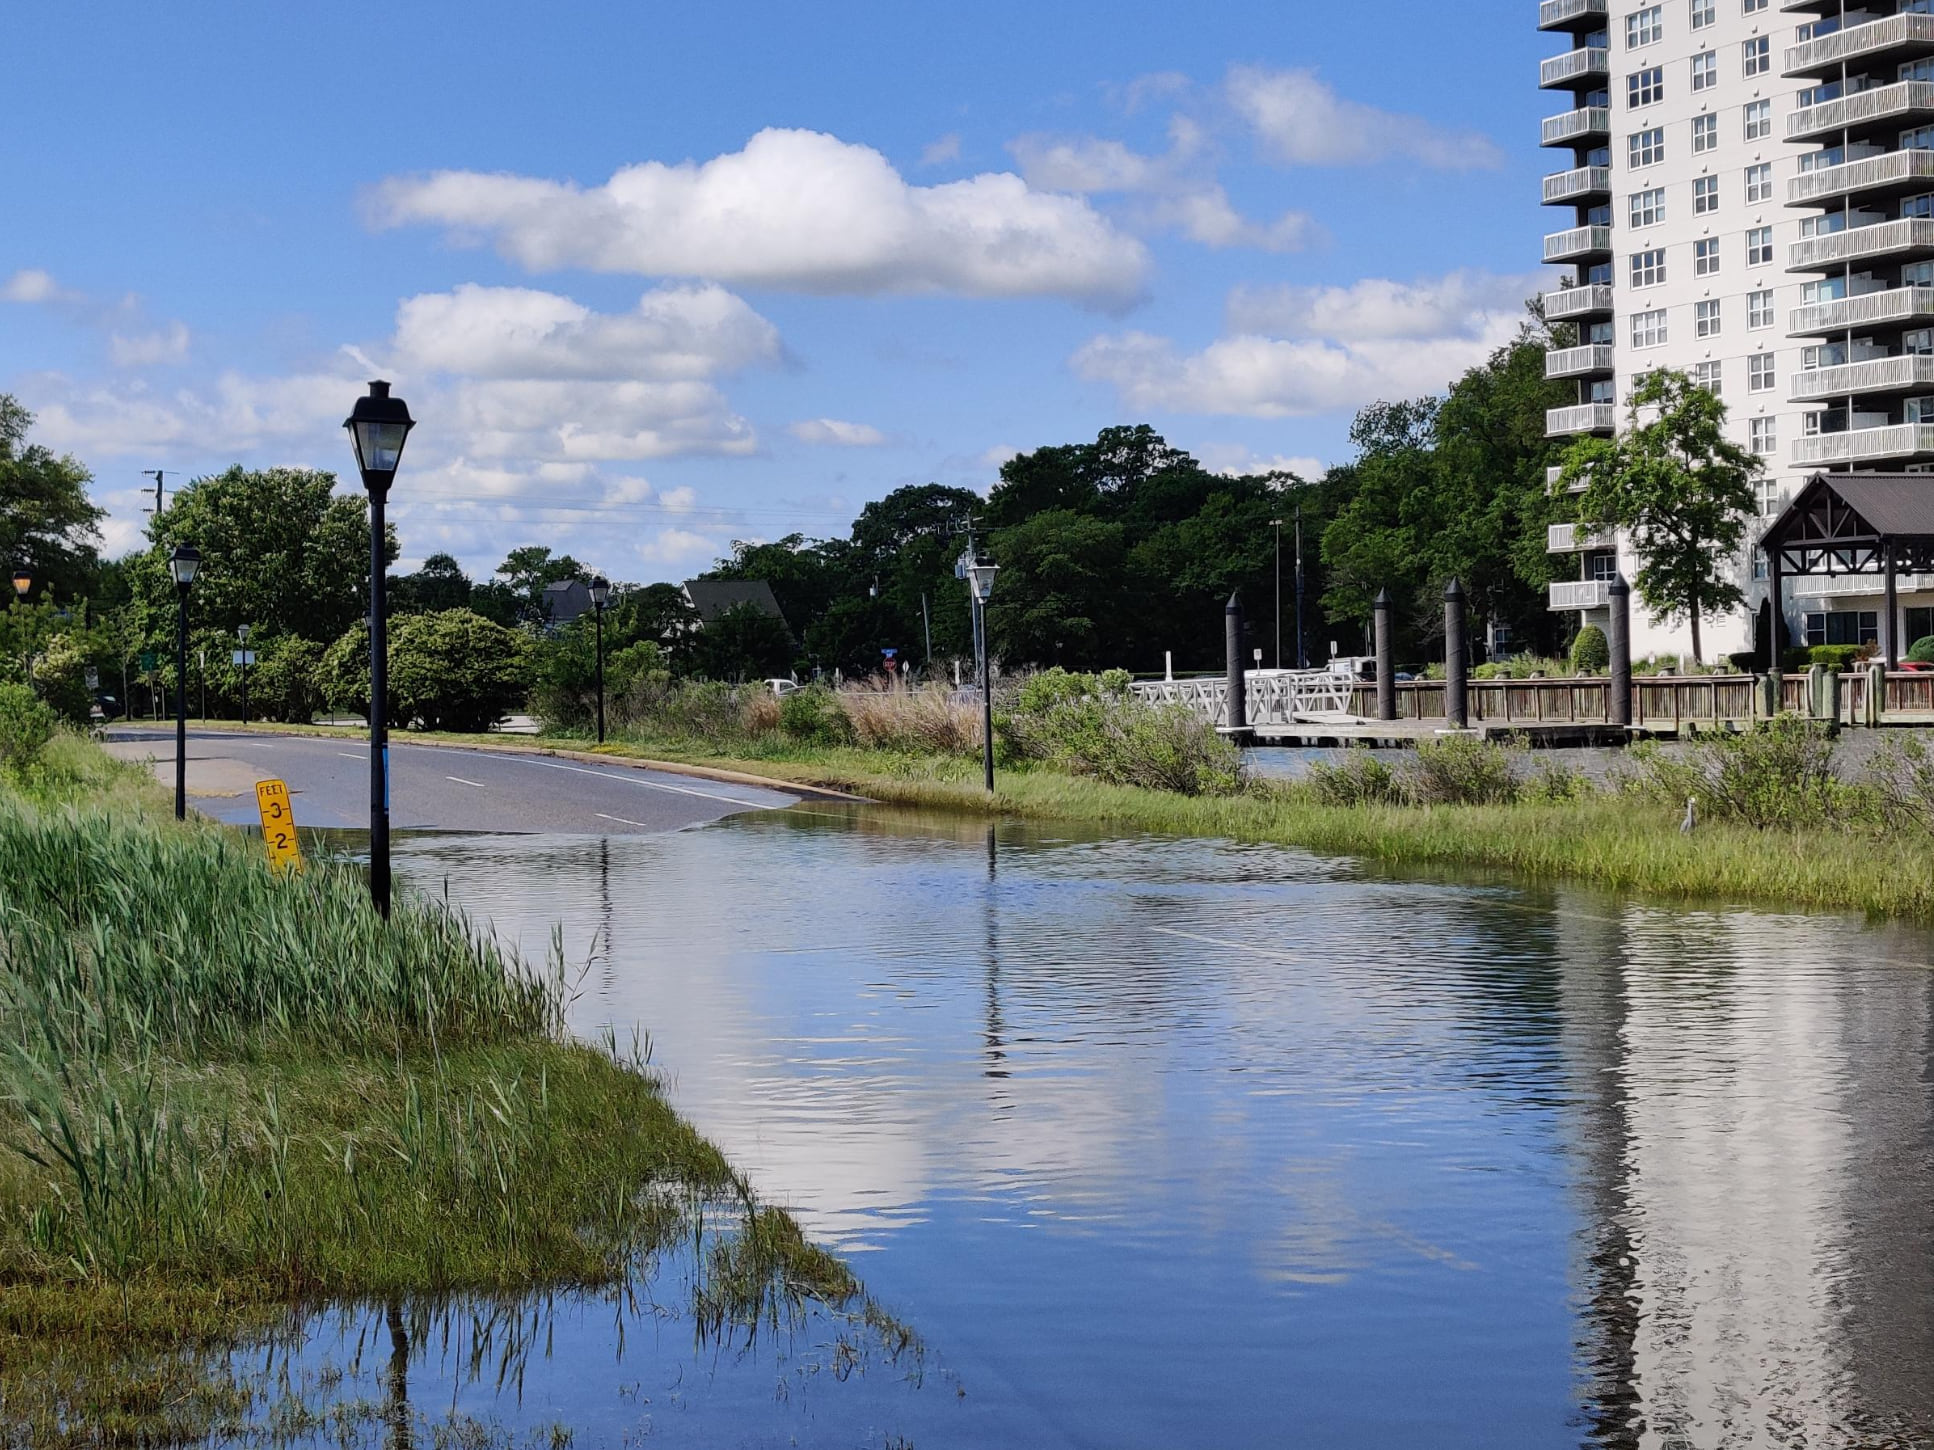
A. Sure. NOAA recently released its Annual High Tide Flooding Outlook, and the projection is 15-19 days in 2023 of high tide flooding in the Norfolk area. On one of my usual routes to work, there’s a point where I can look toward the houses lining the water and identify how low or high the water is. If it’s at a certain height, I know part of my route is flooded ahead, and I need to pivot.
Having observed this over almost 20 years of driving to ODU, I can attest to our regional flooding worsening over time.
Q. Regularly flooded roads must certainly impact the community of Norfolk. What has community engagement with sea level rise looked like?
A. Community engagement or interest was limited 20 years ago, though there were faculty at ODU advocating its significance. In particular, an oceanographer, Larry Atkinson was integral to the first sea level studies in the area.
Despite only a small group of people paying attention, Larry really persevered by organizing meetings, bringing together municipal partners, and building coalitions. In the two decades since his early efforts, community engagement and cooperation have grown immensely, with our local, regional, and state agencies playing a critical role in planning for future sea level rise.
Q. Bringing together groups of people over what many consider a controversial topic is no small feat.
A. Definitely. Larry’s work helped set the tone that, despite any given differences that we all have, it’s important to get everyone in a room and try to work out things from a collective approach.
Municipal lines don’t mean anything to a fire or a flood, so the community beginning to recognize that they have a common problem helped move the needle forward. And it’s the essential things—flooding can be an existential threat for someone who needs daily medical care, for instance.
Q. Are you using GIS to help address these potential threats, also?
A. Yes, we’ve recently started working with a new group, Hampton Roads Biomedical Research Consortium, which focuses on broadly addressing community health challenges, and our part is to utilize geospatial tools to analyze the intersection between socioeconomically depressed communities and flood risks.
Q. Along with the public community, Norfolk is home to the world’s largest naval base, Naval Station Norfolk. Has the military community impacted the state’s efforts in climate modeling?
A. The naval station was actually one of the first groups to do a study on sea level rise, even before it was necessarily acceptable to discuss sea level because they have a mission readiness mandate.
It can be something as routine as flooded roads preventing military personnel from getting to work on time. The navy needed to understand the threat very well to put strategies in place to maintain their readiness.
Q. You were at the forefront of climate modeling using GIS. How did you get started with that work?
A. I don’t remember the exact starting point, but it probably began in the early 2000s with conversations with other GIS practitioners and NOAA staff about how to use their data and tools to analyze flooding at a local level.
Today, sea level rise and flood modeling have become ubiquitous, and companies like Esri are making the work much more manageable. Still, when I started, data was challenging to find—and often needed to be transferred using hard drives. We would go over to a municipal office with a 40 GB hard drive and ask if we could copy whatever data they had.
Q. Many times, innovation requires a partner-in-crime to help push it along. Can you relate?
A. I can. I met Keith VanGraafieland, now an engineer at Esri, while I was completing my master’s in oceanography, and I really respected his ability to dig into the technical components of geospatial data. We developed a collaborative relationship that continued to push us forward.
Between us, it’s often like a challenging game of leapfrog in that we are constantly asking questions of each other, identifying problems, and seeking solutions together.
Q. Can you talk a bit about the current data landscape and how that evolved to working with the state of Virginia?
A. Now, data are so abundant that sifting through and making sense of it all has become the modern challenge. In the past, it seemed that researchers, planners, and municipalities were using a wide range of publicly available data and information from a multitude of agencies and sources. This led to a confusing abundance of different, and sometimes conflicting, resources populating a web search for sea level rise.
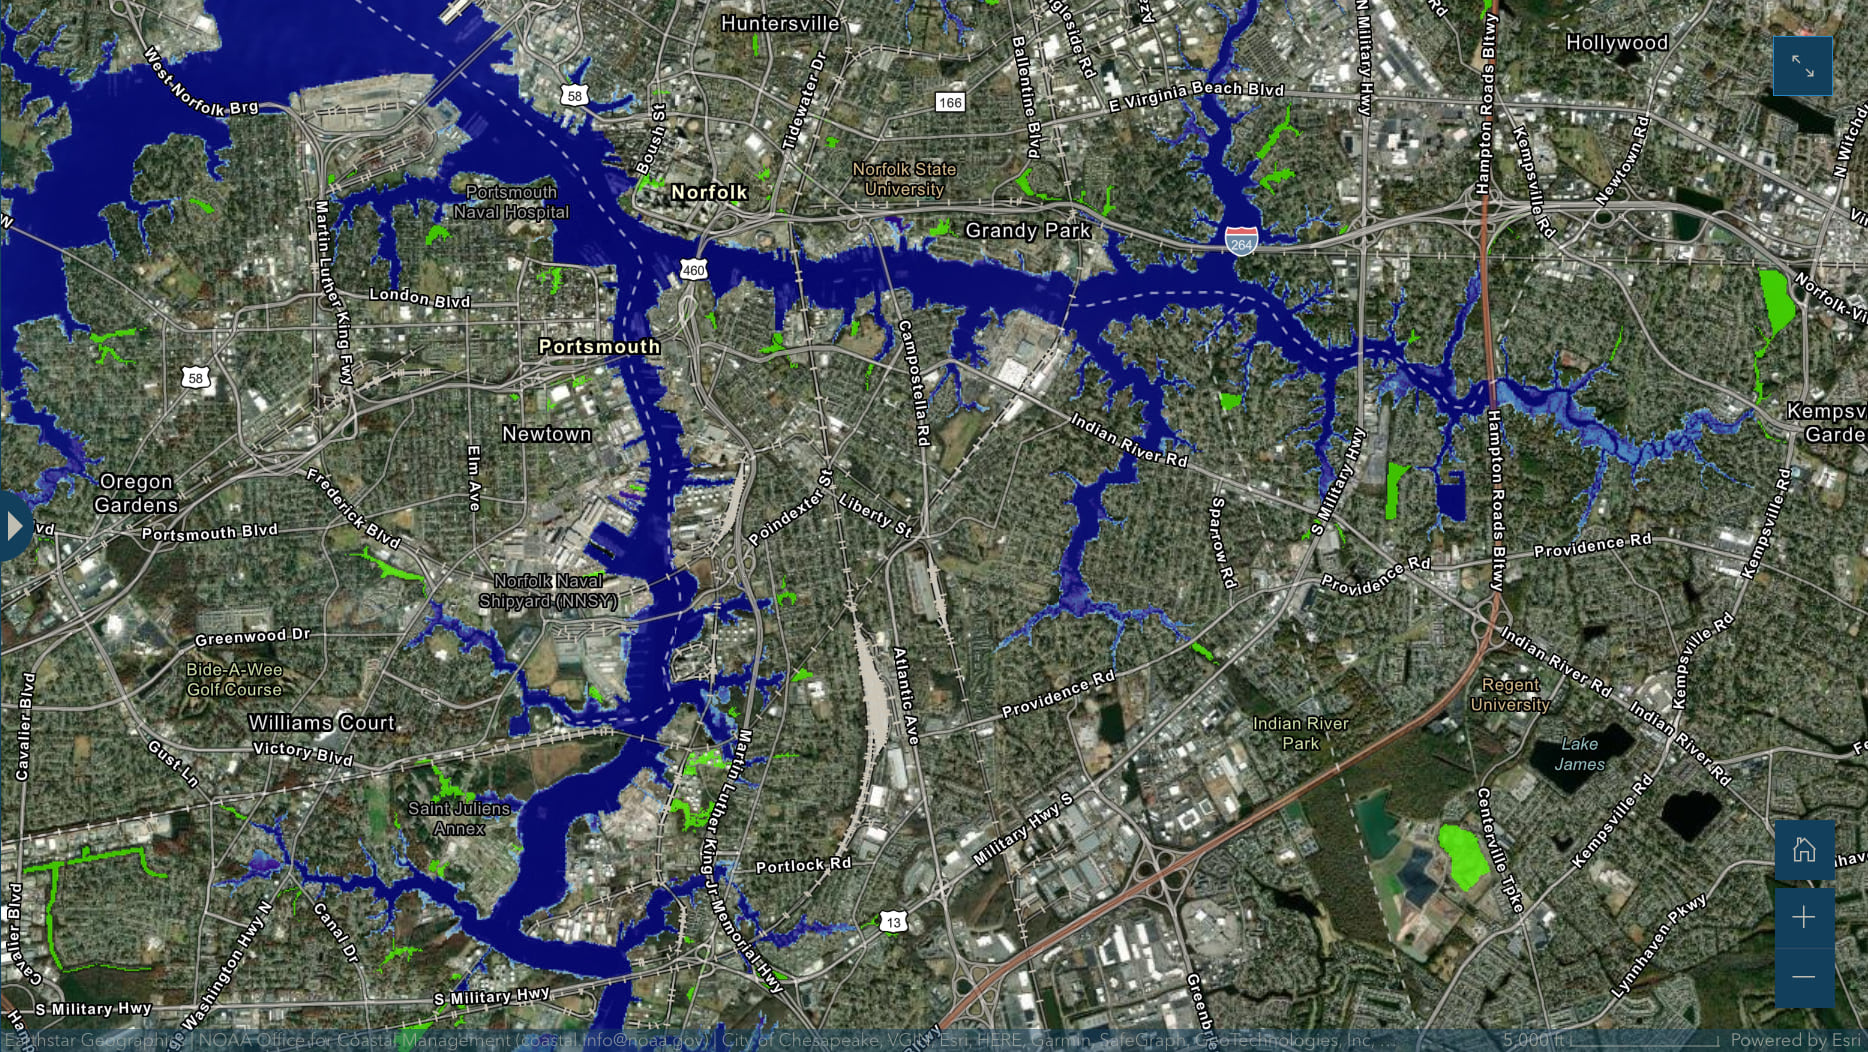
We had some connections at the state level, and in 2018, they were interested in creating a coastal resilience master plan and wanted inundation modeling for the entire state of Virginia. NOAA had some related resources, but the state was explicitly interested in creating flood risk maps for an intermediate high scenario, which was yet to be available.
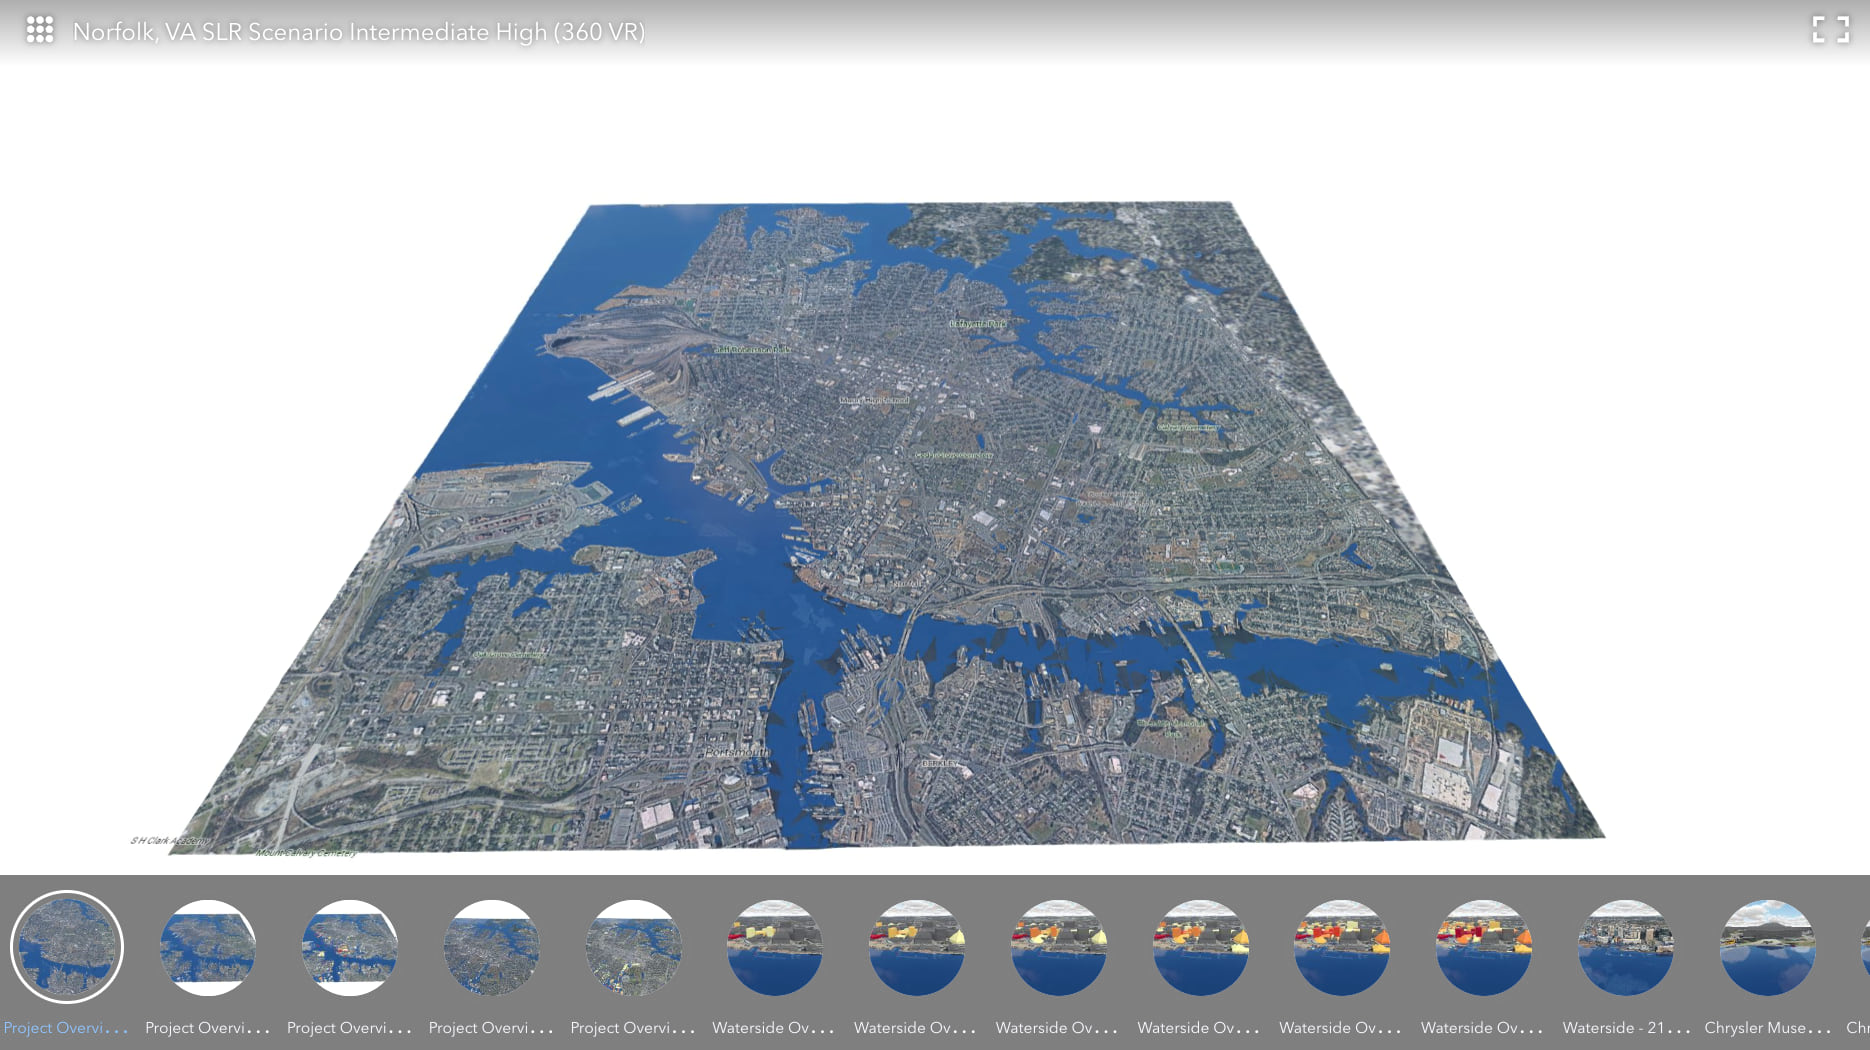
We then spent a few months creating those models for the tidally influenced coastal areas subject to potential sea level rise. The resulting data and maps became the foundation to inform much of the Commonwealth’s decision-making, and local and regional governments followed suit. The state then hired a consultant to produce the coastal resilience master plan.
Q. You’ve spent the last 20 years compiling, sifting through, and communicating sea level data. What advice do you have for someone just getting acquainted with this topic?
A. It begins with awareness—people must be aware of the problem. Then, you need to discuss your risk tolerance, both on personal and municipal levels.
On a personal level, buying a home on the coast here takes significant consideration. Am I willing to tolerate a total loss? It’s hard to have an honest conversation with yourself, but considering the potential outcome, it is necessary.
On a municipal or regional level, it’s important to understand risk tolerance when building new or supporting infrastructure. This is really where our modeling at the intermediate high level comes into play—to demonstrate a slightly risk-averse level that is plausible and that we can plan for.
Lastly, listen to the scientists! Some people want to lump scientists in with politicians and ask, “How do I know I can trust them?” If you find yourself doubting scientists, just hang out with some, and you will find that they hold each other’s feet to the fire to such a high degree—the idea of a massive global conspiracy by scientists is absurd.
Q. It’s clear you find great value in communication. To end, could you tell us how that affects the way you teach and speak to others about your work?
A. I think it’s the undercurrent to everything. Whether I’m presenting at a scientific meeting, conference, or in my classroom, I’m always thinking of the outcome and what message I’m driving toward—and you need to be willing to adapt to your audience.
Like so many other faculty members, I’ve been halfway through a lecture and noticed that heads are on desks. Maybe we do have a great idea, but I liken communicating that great idea to a Rubik’s Cube—you constantly have your hands on it, trying to figure out what the best combination is, and it’s different for every audience.
That’s what I love about GIS tools and visualization. We have options ranging from heavy analytical work to lighter-weight informational products like ArcGIS StoryMaps. It’s possible to tailor your message depending on your audience, whether government officials, scientists, or the public.
This featured storyteller interview was prepared as a part of the October 2023 | Growing green cities and communities issue of StoryScape℠.
For more interviews and articles like this one, be sure to check out StoryScape℠, a monthly digital magazine for ArcGIS StoryMaps that explores the world of place-based storytelling — with a new theme every issue.


Commenting is not enabled for this article.