We are excited to announce the first release of ArcGIS Velocity, a real-time and big data processing and analysis capability of ArcGIS Online. Velocity uses distributed cloud processing to scale tasks, enabling you to ingest, visualize, analyze, store, and act upon massive velocities and volumes of IoT sensor data.
Who is it for?
Velocity can be used across a variety of industries by GIS analysts, operations officers, asset specialists, data scientists, and other professionals working with IoT data. For example, a GIS analyst working for a city or state transportation department can use Velocity to leverage data from connected cars. Roadway sensors receiving vehicle data can stream those observations to Velocity as a feed, enabling real-time visualization of speed, traffic, and telematics data. With this insight, the transportation department can stay on top of different incidents and take appropriate action, whether opening up additional lanes, creating detours, or assigning maintenance crews to clear debris.
An asset manager working for a utility organization can use Velocity to gain visibility into network issues, affected customers, and location of field crews. Ingest real-time readings from smart meters and sensors on your network, including indications of power outages. Perform real-time analytics on the streaming data to monitor for power outage incidents and send notifications to the asset manager or field crews working nearby to ensure power is restored quickly. Big data analytics can be applied to assess historical outage data over space and time to help you better understand where outages occur more frequently and why. This can help your organization repair or replace faulty equipment ahead of time and prevent future outages.
How does it work?
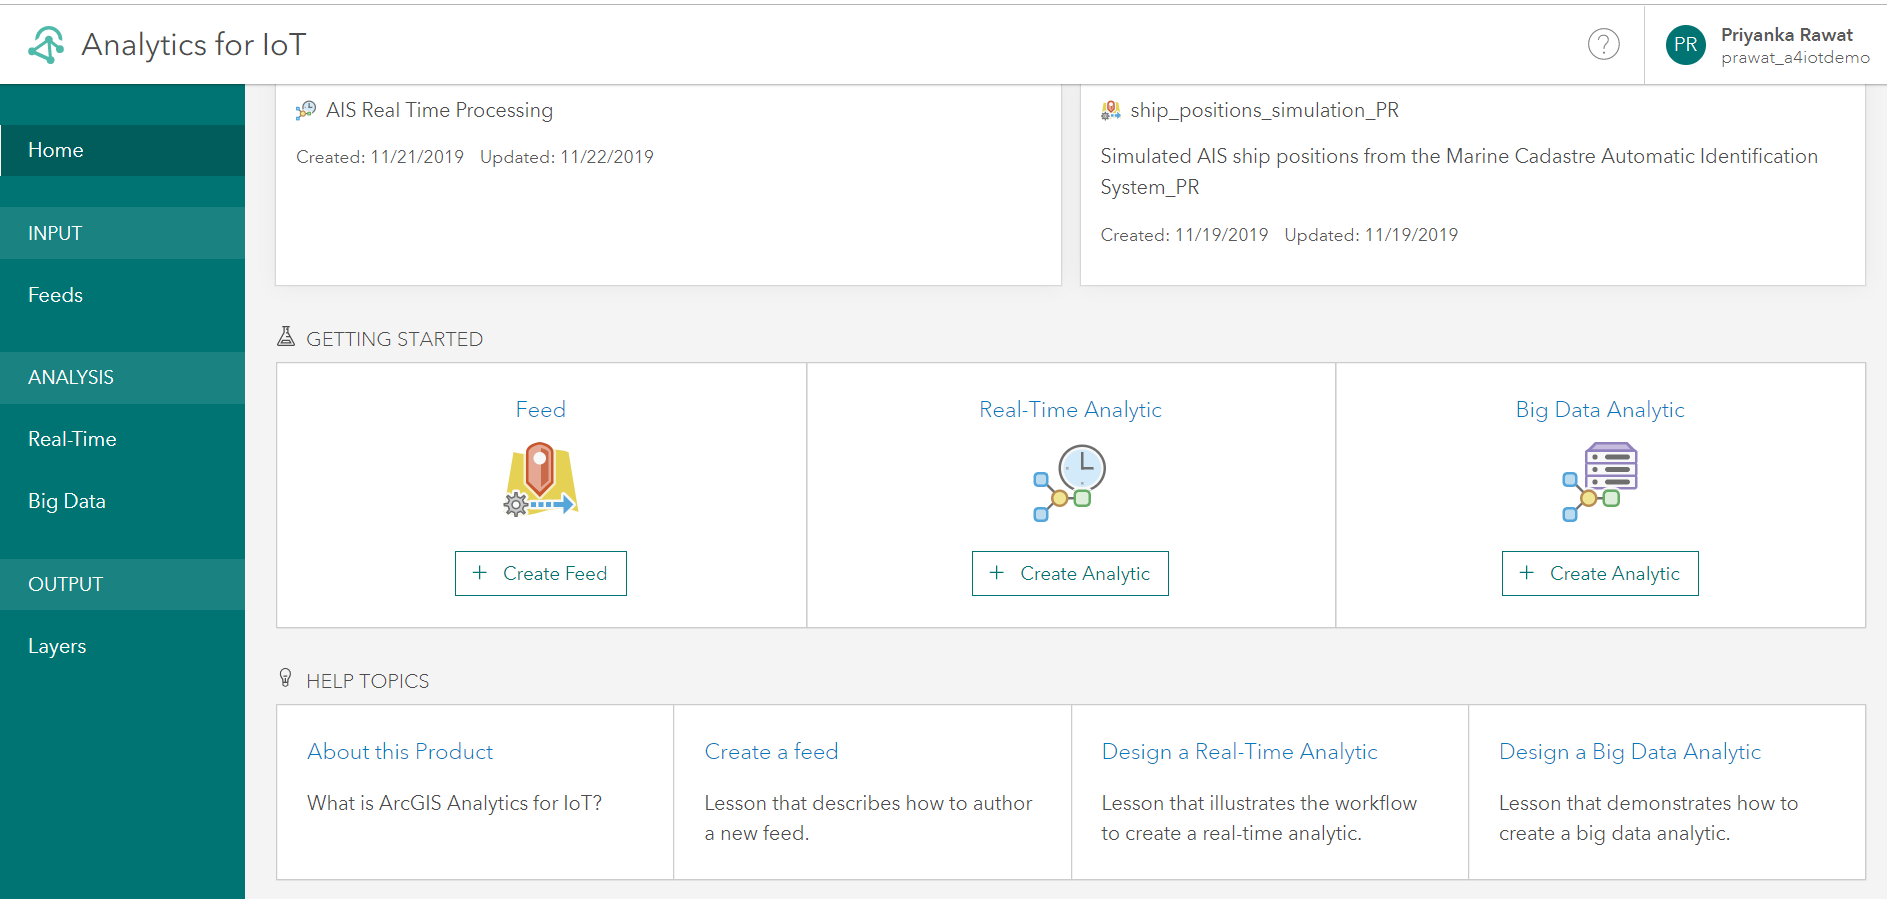
Getting started with Velocity is easy. In Velocity you can create a feed that allows you to ingest real-time streams of data that can be visualized immediately on a web map. By choosing among the different feeds types, you can connect to external sources of observational data such as IoT platforms, message brokers, and third-party API’s. You can also extract data from your ArcGIS layers, IoT cloud service providers such as Azure IoT and AWS IoT, and messaging systems such as Kafka, MQTT, and RabbitMQ.

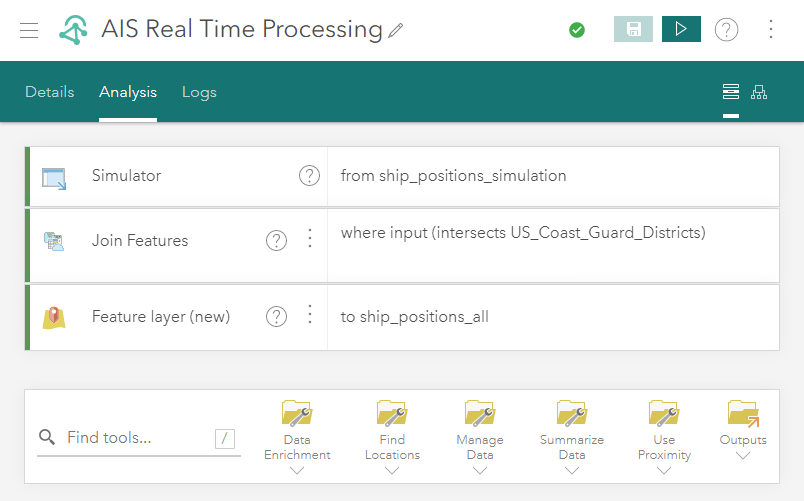
As the data streams into Velocity, you can then design real-time analytics which enable you to perform processing and analysis on the individual messages as they are received. Real-time analytics are often used for transforming data, geofencing, and incident detection. The results of the analysis can be stored in a new or existing feature layer, sent as an email to key stakeholders, or written to third-party messaging systems like Kafka or RabbitMQ.
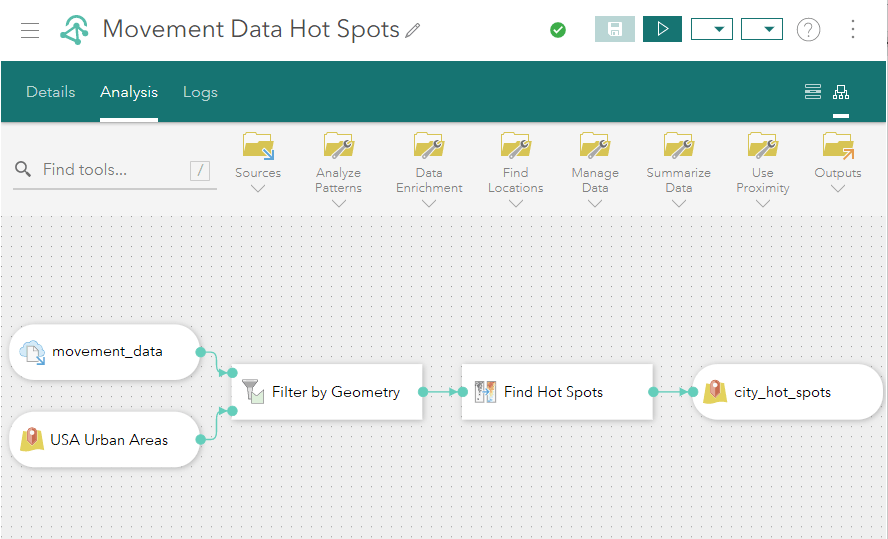
While real-time analytics process streaming data as it’s received, big data analytics allow you to load an existing data from a source and perform batch analysis and processing over space and time on the stored data. Big data analytics are typically used for summarizing observations, performing pattern analysis, and incident detection. Big data analytics can be configured to run once or can be scheduled to run on a recurring basis.
When real-time and big data analytics are run, results are sent to an output. An output is a result or action to be taken as the final step in a real-time or big data analytic. Analytics can emit data to a variety of different destinations, including storing data to a new or existing feature layer, sending data to a stream layer, sending an email, writing to cloud stores such as Amazon S3, and pushing to third-party IoT systems for device actuation.
How do I get access?
To get access to Velocity, you’ll need a Velocity license for your ArcGIS Online subscription, which includes enough compute and storage capacity for multiple tracking and monitoring use cases. There’s no infrastructure or system configuration required and there’s no limit to the number of users. Any member of your organization with a user type of Creator or higher can be granted access to Velocity and immediately begin creating feeds, real-time and big data analytics, and outputs.
Where can I learn more?
You can learn more about Velocity on our product page. Visit the Resources page to access product videos, quick lessons, documentation, and more.


Commenting is not enabled for this article.