ArcGIS Velocity allows organizations to ingest, visualize, analyze, and act on data from sensors and asset tracks. It also enables processing of high-volume historical data to gain insights into patterns, trends, and anomalies. Remote monitoring of assets, predictive maintenance, and process optimization are a few of the benefits you can gain from your sensor and IoT data using Velocity.
ArcGIS Velocity is updated regularly, below are several highlights of the December 2021 release:
- General – New subscription notifications as well as logging enhancements to keep you up-to-date on key information.
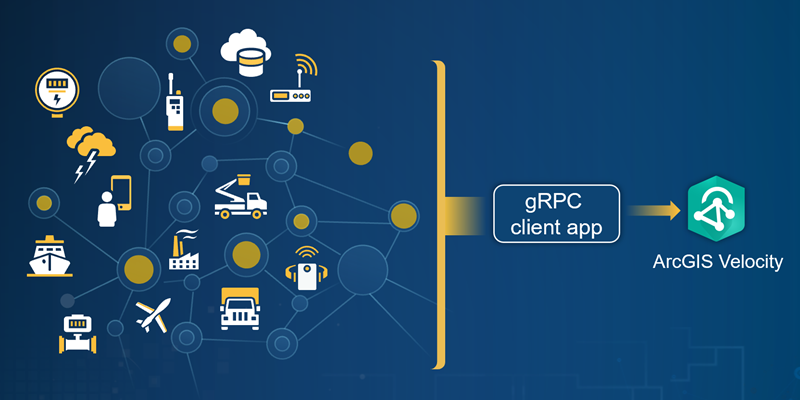
- Feeds, data sources, and outputs – The new gRPC feed type (currently in beta) enables you to push real-time data into ArcGIS via a hosted endpoint and develop integrations for real-time data providers not supported out-of-the-box.
- Analytics – Your analytics can now be shared publicly!
- Data management and visualization – Improved storage metrics including the size and the percent storage consumption of each layer.
Now, let’s take a deeper dive into each of these exciting new capabilities and enhancements!
General
Several enhancements were made to provide you with relevant information about your ArcGIS Velocity subscription. To start, you will now be notified when the storage capacity of your subscription reaches 75 percent and 100 percent of your subscription limit. In addition, the ArcGIS Velocity app now provides a warning when your subscription is within 30 days of expiring, allowing you to take appropriate action prior to the expiration so you don’t experience any interruptions in your real-time and big data workflows.
Enhancements to logging were made that improve your insight in some key areas including when your feeds exceed your Velocity subscription thresholds, when duplicate observations are received for a given track in stateful real-time analysis, and when a Geotab feed type encounters credential authentication issues.
And lastly, new with this release, work more effectively with your recent feeds and analytics by utilizing the new last modified date information now available on the respective list pages.
Feeds, data sources, and outputs
Do you have use cases that require you to ingest real-time data using feed types not available in ArcGIS Velocity? If so, you’re in luck with this release! The new gRPC feed type (currently in beta) allows you to push real-time data into ArcGIS via a hosted endpoint as well as develop integrations for real-time data providers not supported out-of-the-box with Velocity.

To get started, review the documentation at the link above, read more about how the gRPC feed works by visiting the Velocity Blog in the Esri Community, and check out all the great resources available to developers in the gRPC feed repo in GitHub including the developer guide, precompiled client libraries, reference implementations, and more.
If you’ve been utilizing the Kafka feed type, it’s been enhanced to support specifying a consumer group ID so you can associate the feed with a consumer group that has already been defined on the Kafka broker.
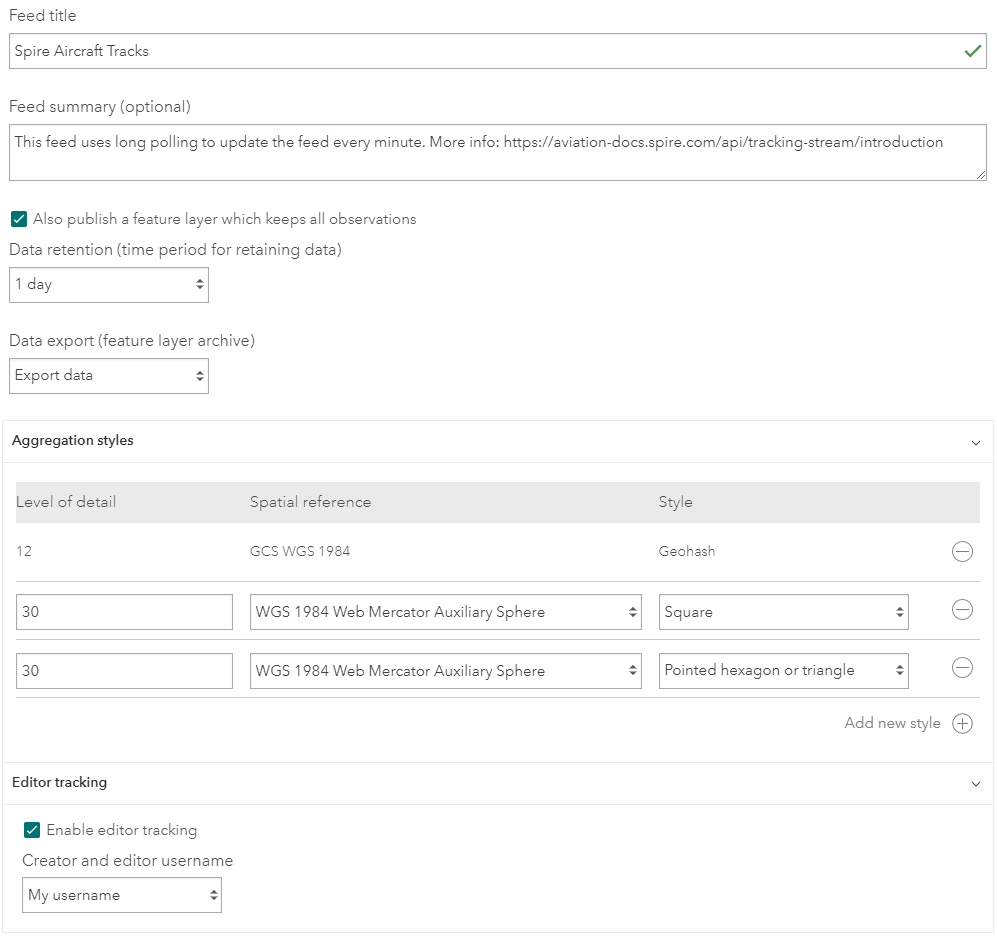
And lastly, when creating new feeds, you can now store incoming data over time to a feature layer as it’s received by the feed. This makes it easier to ingest data for historical visualization and analysis as well as reduces the need to configure a real-time analytic if your main goal is to just ingest data over time.

Analytics
In this release, you can now share your real-time and big data analytics publicly. Shared analytics can simply be copied to another member’s account and used as-is or as template to build their own real-time and big data workflows for similar use cases.
In a previous release of ArcGIS Velocity, dynamic geofencing was introduced in beta for testing in your real-time analytics. To recap, dynamic geofencing enables you to find spatial relationships, perform spatial enrichment, and make decisions based on spatial proximity between two real-time feeds. In this release, enhancements were made to improve geofence load times in your real-time analytics. In addition, the Detect Incidents tool now supports dynamic geofencing. Other tools that already support dynamic geofencing are Filter by Geometry, Calculate Distance, and Join Features. Note that this capability is currently in beta and should not be used in production workflows.
Have you ever wanted to see the status of your recent big data analytic runs? Now you can, and it is especially useful when your big data analytics are scheduled to run on a regular basis. Additional insight is gained into the stability of your continuous processes and any recurring issues you may be experiencing.
Data management and visualization
With this release, administrators now have improved transparency into the organizations subscription storage metrics including the size of each layer in addition to number of features and the percent storage consumed.
Lastly, feature layer views were enhanced so that when a feature layer has dependent views, it cannot be deleted accidentally.
And more…
For a complete list of enhancements with more details, check out the what’s new topic in the documentation. And if you have ideas/enhancements/feature requests for the product, be sure to post them on the ArcGIS Velocity Ideas board in the Esri Community.

Article Discussion: