With the coronavirus disease 2019 (COVID-19) pandemic now affecting people everywhere on the globe, the sheer scale means we are facing problems we have never before faced in modern times. Health authorities are more than ever in need of authoritative information like where current and upcoming hotspots are in order to decide on how best to prepare and respond. To get this information, collection of actual, accurate, authentic, and location-based patient information is a must. However, legislation to protect citizens’ rights puts restrictions on how and what data collection, analysis, and dissemination of personal information can be done. So, we have a situation where health authorities need good, reliable patient data but face difficulties in obtaining, processing, and distributing it. The challenge we have is how to collect, analyze, and disseminate localized patient information while at the same time ensuring that we protect the individual’s rights.
Fortunately, with ArcGIS, we can configure options for both protecting patient information and allowing health authorities and researchers to acquire and analyze patient data necessary for combatting COVID-19. Using ArcGIS, we can geocode patient information by assigning a unique Global Grid Reference Identifier (GGRID). A GGRID is much like a global user ID (GUID) but with the difference that GGRID also provides a geometry and a location to represent an event. What do I mean by this? Let me try to explain:
Let’s start with GGRID geometries. Imagine Chinese boxes, Matryoshka dolls, or Benoit’s self-similarity fractals. In a similar manner, we can take a UTM zone and fill it with 400-kilometer bands moving toward either the north or the south pole. Each of these bands can be filled with 100-by-100-kilometer square grids. Then, for each of these grids, we divide them into 20-kilometer square grids, and then again for each of those, we divide them into 5-kilometer square grids, and then into 1-kilometer square grids, and so on—hence the initial comparison. What we get, starting from the 100-kilometer square grids (see diagram below), is an infinite series of grids being repetitively subdivided into smaller and smaller grids following a repeating pattern of 5×5-4×4-5×5 square grids. This is a nested topology where we inherently know the relationship between parent and child grids. We also know what is in their proximity (neighbors), but I will leave this out for now.

What this implies is that we can represent an event or object as either a square grid (polygon/raster cell) or a centroid (point) from 100 by 100 kilometers to an infinitely small square—you decide.
By aligning the center 100-by-100-kilometer grids with the central meridian in a UTM zone, calculating grid location in UTM coordinates for grid centroids and/or corners is straightforward. Doing so allows grid geometries to be displayed on a map and analyzed by leveraging existing functions in ArcGIS. All this can of course likewise be fully automated using inherent geoprocessing, Python scripting, and commands and functions.
Now that we have established a set of nested geometries and their locations—and I hope you start to see where I’m going with this—we are in need of a nomenclature supporting this structure. This is where there GGRID encoding comes in. Let me briefly show you an example for a 5-millimeter GGRID encoding (relevant to our case), which in this case would be somewhere around Svalbard:

So, from N37 we note that we are in the Northern Hemisphere UTM zone 37. The U2 tells us that we are in the 8000–8400-kilometer band from the equator, more precisely in quadrant 2. The following letter G gives us the 100-kilometer grid in quadrant 2; the O, the 20-kilometer grid within G; and so on. I believe you get the idea by now.
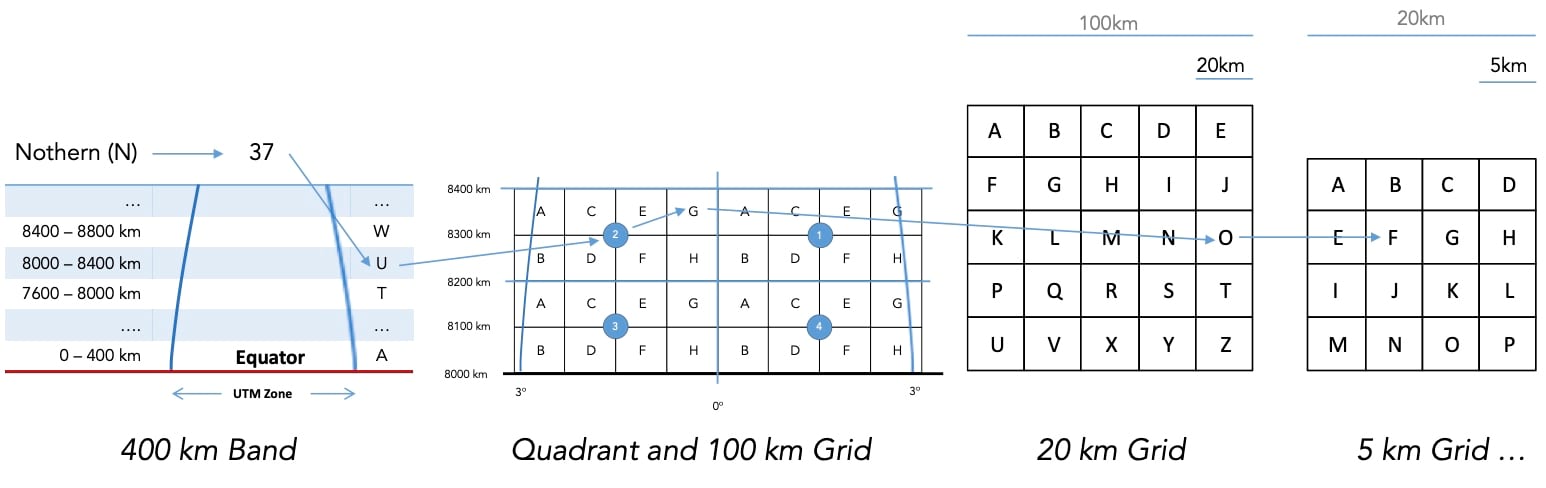
As you can see from the example, this nomenclature supports the nested pattern of 5-4-5, 5-4-5, …, starting from a 100-kilometer grid.
So how does this GGRID help in masking patient data? Let’s imagine that a citizen in Svalbard, through a health application (mobile or web), submits a daily response to a COVID-19 health survey that includes a geolocation of their home, like latitude/longitude or UTM coordinates. This location can be converted on-the-fly to a GGRID representation, which, with a 10-meter accuracy, could be N37U2GOFIGHT. However, the submitted patient information can still be traced back to a single individual, so by removing, for example, the last three digits, the patient data is now masked to be within a 1-kilometer grid (N37U2GOFI) or by removing one additional digit it becomes a 5-kilometer grid (N37U2GOF).

What this does is threefold. First, it allows collected patient data to be masked at any time between data collection, analysis, or dissemination. Second, using a fixed frame of reference allows aggregation of all data collected in that grid to be statistically processed, analyzed, and compared to assess and understand trends, patterns, and outcomes. Other related datasets can likewise be represented using the same grid structure and serve as input to analysis and display. Third, data and information can easily be presented on maps masked and/or aggregated up to a 100-by-100-kilometer level, protecting patient rights as shown in the example above.
As hinted, there are other features and properties of the GGRID encoding structure that can support data collection, aggregation, combination, and analysis, including vertical and time dimensions, but I will cover these in a later blog. The takeaway here is that by using GGRID encoding and geometries, we can at any time define the level of locational accuracy to which we want to collect, analyze, and present COVID-19-related patient information.
– Stay safe.


Article Discussion: