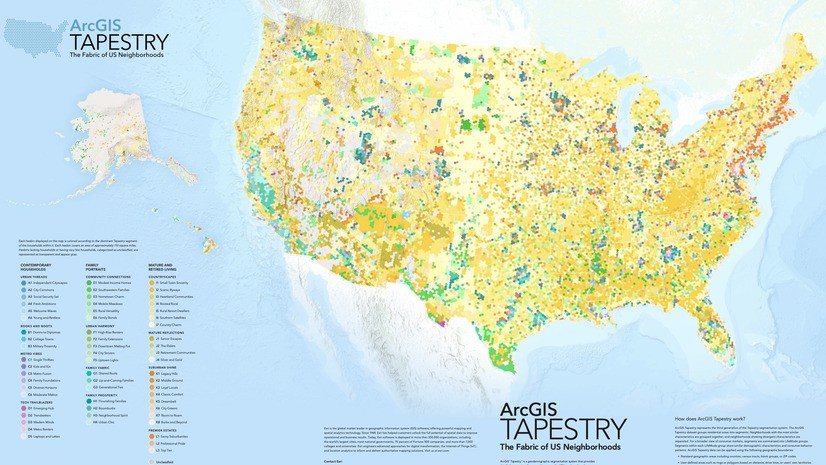
ArcGIS Tapestry data contains detailed summaries of communities across the United States. This dataset groups residential areas into segments based on shared demographic, socioeconomic, and lifestyle characteristics. Neighborhoods with the most similar characteristics are grouped together, and neighborhoods showing divergent characteristics are separated. It can be used to understand a community’s complexity since each segment provides insight into patterns at the neighborhood and community level and can be used to compare segments and groups.
You can use ArcGIS Tapestry data in ArcGIS Business Analyst through mapping and analysis workflows as well as infographics and reports. In this blog article, you’ll walk through using Tapestry data in Business Analyst Web App to map the Dominant Tapestry Segment variable at the census tract level. You’ll also use Business Analyst Pro to map your best customers and apply Tapestry data analysis to locate more of them in a new market. You can use the following links to jump to the different sections of this article:
- ArcGIS Tapestry data in mapping and analysis workflows
- Using ArcGIS Tapestry data in Business Analyst Web App
- Using ArcGIS Tapestry data in Business Analyst Pro
- ArcGIS Tapestry data in infographics and classic reports
ArcGIS Tapestry data in mapping and analysis workflows
You can access ArcGIS Tapestry data through Business Analyst mapping and analysis workflows that use the data browser, as listed below.
| Business Analyst Web App and Business Analyst Enterprise | Business Analyst Pro | Business Analyst Mobile App |
|
In some workflows that use the data browser, you may not be able to use every Tapestry variable. For instance, benchmark comparisons use numeric scores in the analysis. Since the Dominant Tapestry Segment variable is text-based, this variable cannot be used in a benchmark comparison.
Using ArcGIS Tapestry data in Business Analyst Web App
You can use ArcGIS Tapestry data in Business Analyst Web App. An example is for product marketing professionals to create a marketing campaign that speaks directly to customers as informed by their community’s dominant Tapestry segment. You’ll create a color-coded map using the Dominant Tapestry Segment variable at the block group level in Orlando, Florida.
Make sure that the latest data source is used: Esri 2025.

Set the area of interest to Orlando City, FL, and use block groups as the level of detail.

Click Browse all variables to browse the data browser and search for tapestry. There are over 700 matching results! For this exercise, you will use the 2025 Dominant Tapestry Segment (Esri) variable. Click it to add it. The color-coded map is automatically created.
The resulting color-coded map shows a detailed view of the segments in central Florida.

You can continue exploring Tapestry segments for the block groups in Orlando. For instance, if you’re interested in targeted advertising in the Callahan neighborhood, click its associated block group. The site pop-up shows that its dominant segment is C2: Kids and Kin.

This segment is characterized as young, educated, metropolitan renter households. For more information, run the Tapestry Profile infographic.
The infographic provides an overview of which segments are represented in the block group, as well as additional data about the age of residents and household income. An advertising agency could use this information to create targeted campaigns that market to specific types of shoppers.

There are countless other ways to utilize Tapestry segment data in Business Analyst Web App. For example, you could map points of interest then create a color-coded map layer to assess if competitive businesses are in areas reaching their target customers. Or you could run infographics to assess if resources are being delivered to vulnerable communities. You can even use Tapestry data in other Business Analyst products, like Business Analyst Pro.
Using ArcGIS Tapestry data in Business Analyst Pro
One of the unique aspects of ArcGIS Tapestry data is its ability to present a three-dimensional, more human, picture of a group than any single variable could. Each Tapestry segment is a compilation of thousands of variables, sketching a “type” of consumer rather than reducing them to a solitary/sole behavioral or spending trait.
Instead of predicting sales by mapping one spending variable, a business can use Tapestry segments to understand the lifestyles and spending patterns of its best customers. Rather than assessing health-care attitudes with a simple map of health insurance coverage, a hospital might narrow their analysis to Tapestry segments at a certain life stage, or with household sizes that are increasing.
This more nuanced view of people makes ArcGIS Tapestry data a powerful predictive tool, capable of answering the age-old questions: “Who are my best customers, and where can I find more of them?” For example, let’s say you’ve created a color-coded layer that maps your company’s sales data in southeastern Pennsylvania using ArcGIS Business Analyst Pro.

Great! You see right away that the darker green block groups in Pittsburgh have much higher sales volume than anywhere else in your market. This gives you an idea of where your best customers are located…but what now? Who are they?
In a few clicks, you create a color-coded layer, setting your area of interest to the city of Pittsburgh, showing the dominant Tapestry segment for each block group in the city. You focus on the two locations with the highest sales.

Ok, now the picture is getting sketched in a bit. In the color-coded layer containing the sales data, you select features by attributes, creating the expression “Where Total Sales is greater than 16500”:

And voila! You immediately realize that your best customers appear to be from two segments, D4 and B1.

Seeing that these two segments represent some of your best customers, you decide to learn more about Segment D4 by running the Dominant Tapestry Profile infographic.

Interesting! Your best customers are young, educated professionals in urban rentals. You also visit the ArcGIS Tapestry help documentation to read about these residents and important data points for them.

Finally, having studied up on your beloved customers, you decide to find more of them in a new market: Philadelphia. You create a color-coded layer (yes, a third one!) mapping households in Segment D4 and discover a dense pocket of these folks in the east-central part of the city.

You’ve now learned about who your customers are, and pinpointed additional locations where there are a lot of them. If you’re a Business Analyst Pro user already, this process may feel familiar: it’s a simplified version of the target marketing workflow, which leverages Tapestry data to create and analyze customer profiles.
For more information on using Tapestry data in Business Analyst Pro, see:
- Drive customer growth with target marketing in ArcGIS Business Analyst Pro
- Use Business Analyst’s Target Marketing Wizard to find customers in a new area
ArcGIS Tapestry data in infographics and classic reports
ArcGIS Tapestry data is also the central focus in many Business Analyst infographics and classic reports, as listed below.
| Type | Title |
| Infographic (Standard) | Dominant Tapestry Profile |
| Tapestry Profile | |
| Economic Development Profile | |
| Executive Summary – Call Outs | |
| Multi-area Comparison | |
| Target Market Summary | |
| Infographic (Gallery) | Tapestry Profile Legacy |
| Tapestry Segmentation Profile Report | |
| Community Profile Report | |
| Market Profile Report | |
| Retail Demand Outlook Report | |
| Retail Goods and Services Expenditures Report | |
| Classic report | Dominant Tapestry Map |
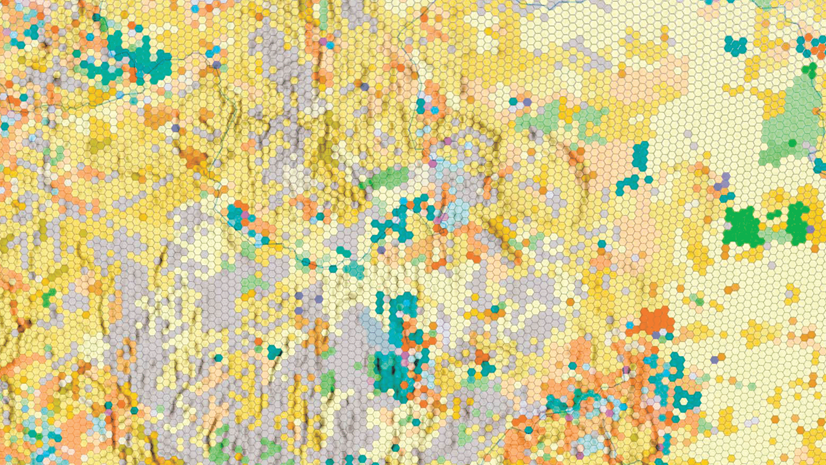
| Dominant Tapestry Map (Hexagons) | |
| Tapestry Segmentation Profile | |
| Community Profile | |
| Market Profile | |
| Retail Demand Outlook | |
| Retail Goods and Services Expenditures |
In addition to the infographics and classic reports, there are two reusable infographic panels that highlight key Tapestry data:

An example of using a Tapestry-focused infographic is running the Dominant Tapestry Profile infographic in Business Analyst Web App to study a block group in Montana.

A block group is being used since segmentation analysis is most useful when it is hyper-local, so it is recommended to analyze small areas. For example, analyze sites with drive times or distance profiles within 10 minutes or 10 miles. If you need to compare your site with other geographies, consider using the smallest geographic level of detail, or even small resolution hexagons, for your analysis.


Article Discussion: