The June 2025 release of ArcGIS Tapestry marks the first full overhaul of the system in a decade, combining the most recent U.S. Census data and advanced clustering techniques to provide a more detailed understanding of communities across the United States.
Whether you rely on Tapestry data to explore neighborhood dynamics, fine-tune your outreach, or guide smarter planning, this update brings some significant shifts. In this article, we’ll walk you through what’s new, what’s different, and how these changes could impact the way you work.
Tapestry can be used to understand U.S. community demographics and lifestyle patterns. This release marks the third iteration of the Tapestry system, drawing on more than 50 years’ worth of knowledge and innovation gained in the market segmentation sector to provide insights into the changing population of the United States.
This release introduces several important changes:
- Reconfigured segments and LifeMode groups
- Comprehensive access to urbanicity attributes
- Refreshed user experience and expanded data documentation
- Updated selection of data visualization products
Reconfigured segments and LifeMode groups
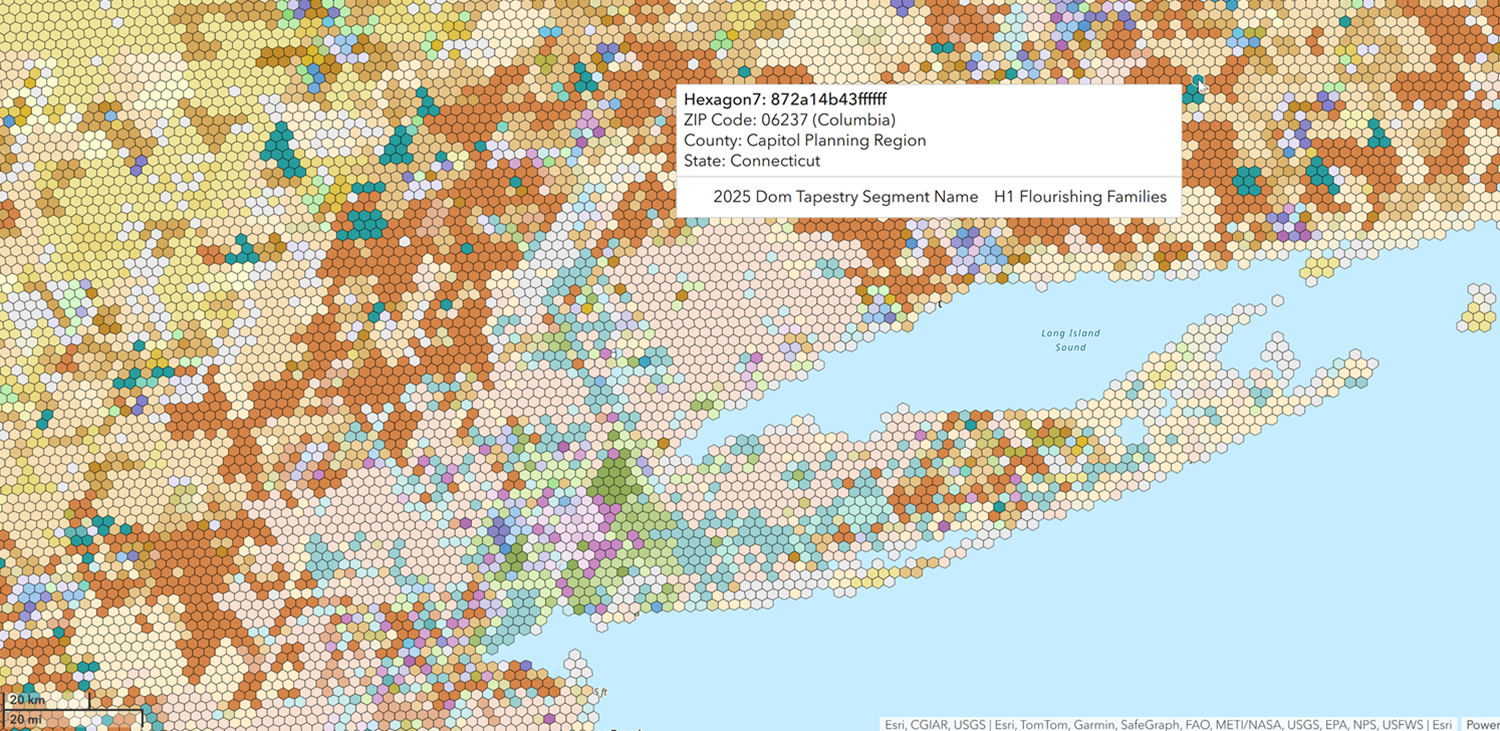
ArcGIS Tapestry is a geodemographic segmentation system that provides detailed summaries of communities across the United States. The Tapestry dataset is created by grouping residential areas at the census block group level based on shared demographic, socioeconomic, and lifestyle characteristics. Areas with the most similar characteristics are grouped together, and those showing divergent characteristics are separated.
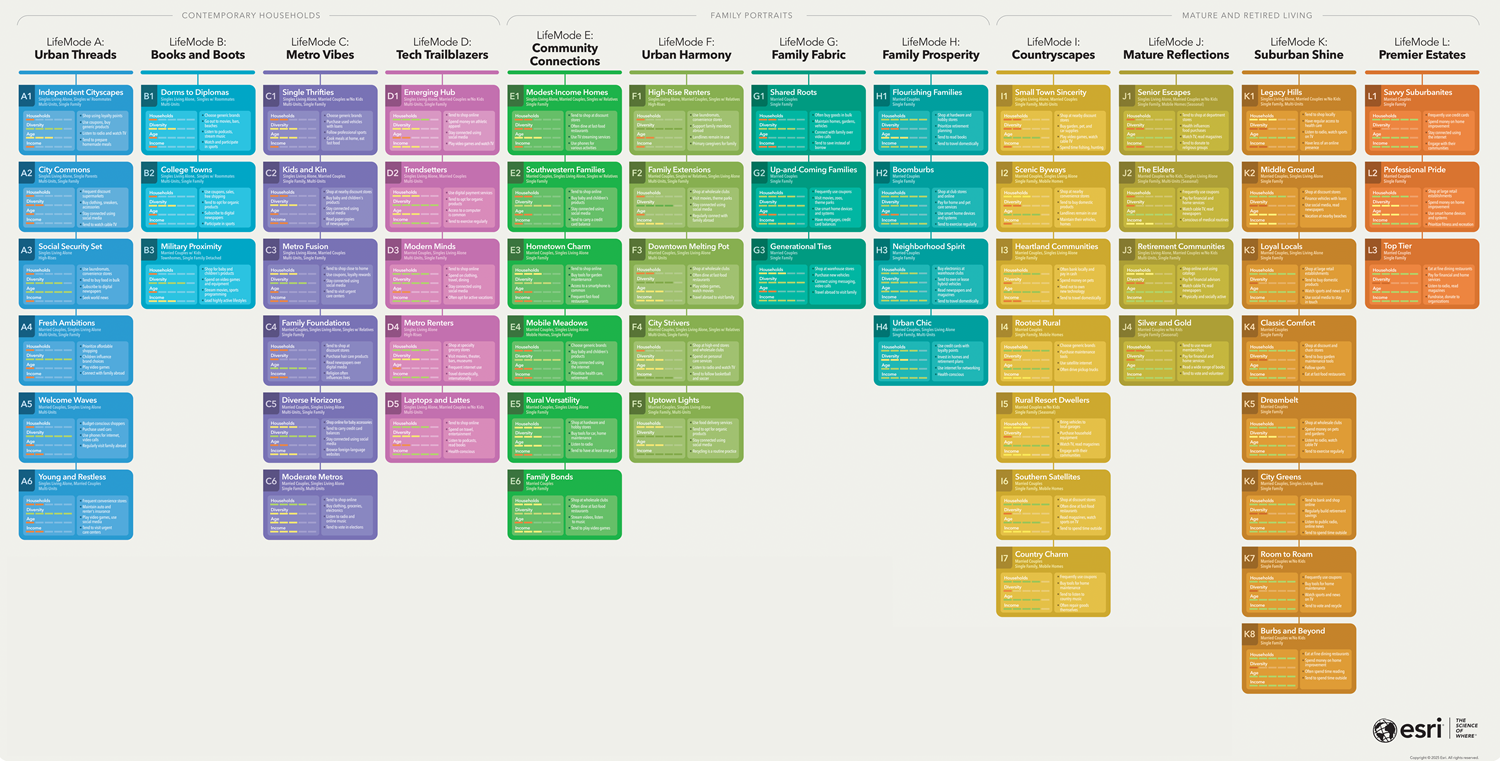
This release presents new segments to better capture emerging consumer behaviors and demographic trends. These additions aim to provide a more granular understanding of these dynamics, especially in rapidly changing neighborhoods. This iteration comprises 61 segments (60 distinct segments and 1 unclassified) and 13 LifeMode groups (12 distinct groups and 1 unclassified); previously, there were 68 segments (67 distinct segments and 1 unclassified) and 15 LifeMode groups (14 distinct groups and 1 unclassified).

With this updated system, 33 segments remain with consistent names from the former system, and 27 segments are new. Although a segment persists, meaning it has maintained the same name and essential defining characteristics, the underlying statistics describing the segment may have shifted. For example, segments might be slightly older or have slightly different income levels from the 2024 system to the 2025 system. See Migrate to ArcGIS Tapestry to learn more about the new coding scheme.

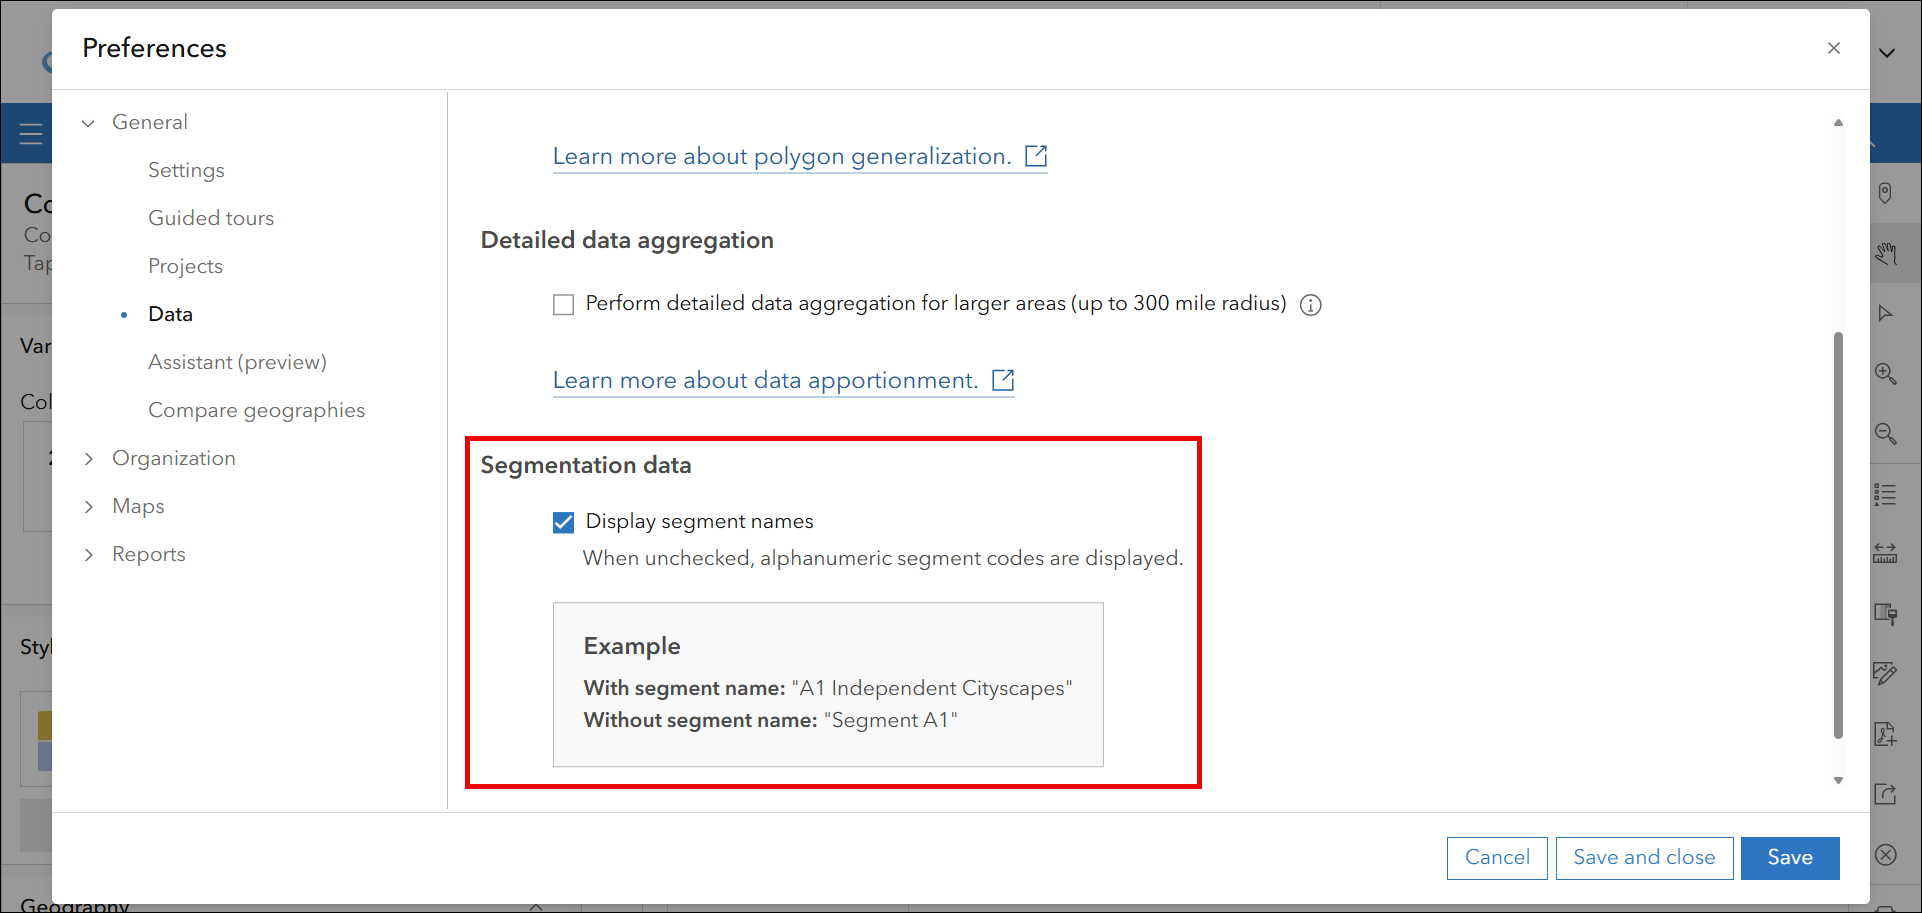
Additionally, when working with Tapestry data in ArcGIS Business Analyst Pro and ArcGIS Business Analyst Web App, you now have the option to display either segment names or alphanumeric codes. This allows you to choose how you want to interact with the data. For example, working with codes can make it easier to search, filter, and integrate Tapestry with other datasets, especially in technical workflows in which concise identifiers are more efficient.
Comprehensive access to urbanicity attributes
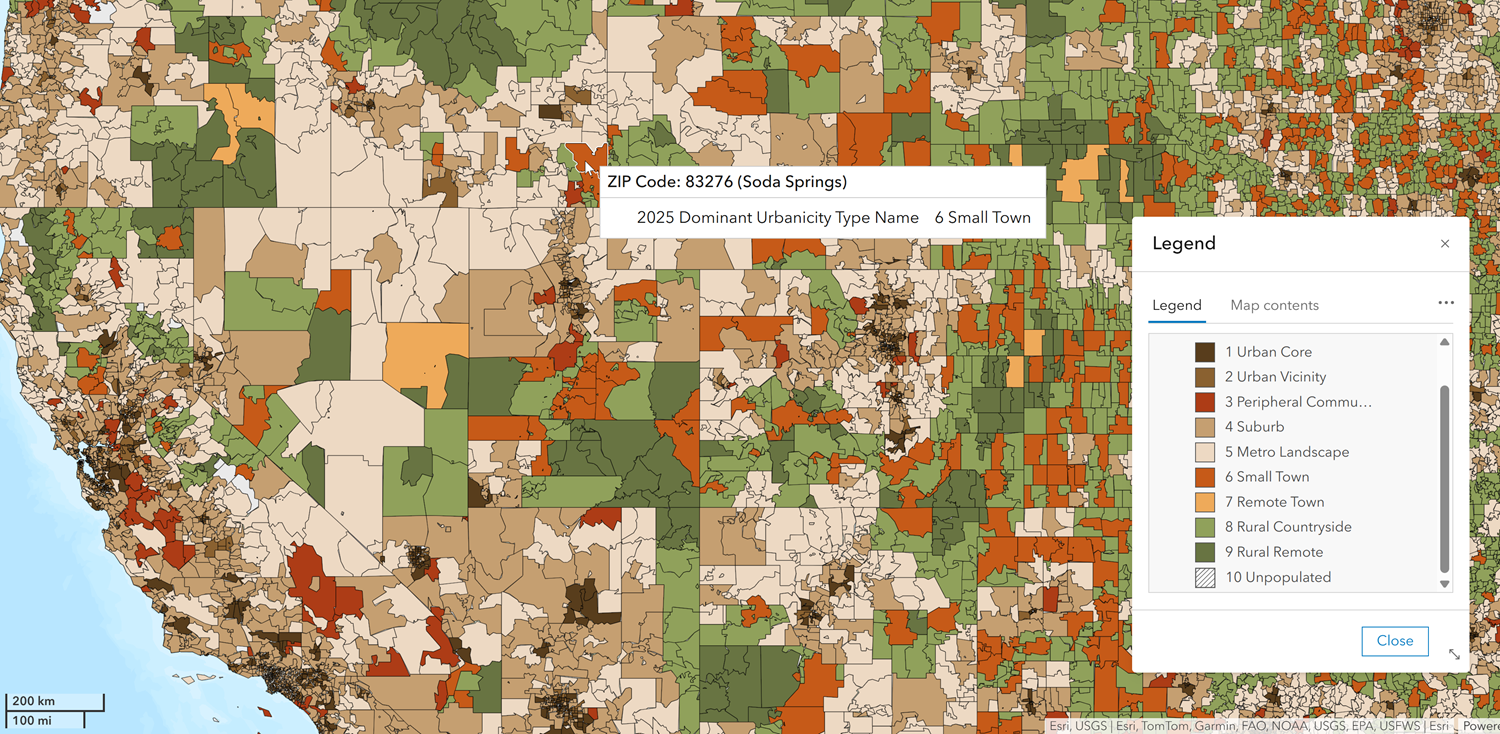
In November 2024, Esri released a new urbanicity classification system as an enhancement and replacement for the six Urbanization groups used in the last system. The Esri Urbanicity Type dataset designates land into 1 of 10 categories that share characteristics used to classify urbanicity, including density, distance, and socioeconomic dependence on urban cores.
Urbanicity refers to the degree of urbanization in a specific area, ranging from highly urban environments (such as big cities) to rural settings. This classification system provides a more granular, current, and nuanced view of the degree to which land is urban or rural. Urbanicity shapes consumer behavior and shopping patterns based on where people live, but these differences are deeply influenced by spatial inequality and uneven access to resources.

Urban areas tend to offer more options and exposure to the latest trends, in large part due to better infrastructure and investment. In contrast, rural communities often have fewer options because of limited resources and services. People tend to buy what’s available, not always because they want to, but because that’s what’s accessible. In this way, urbanicity can provide essential context for understanding the structural basis for market behavior rather than interpreting it as a matter of individual preference.
The new Urbanicity Type taxonomy offers a complete distribution of all 10 distinct urbanicity types for all segments, providing an additional dimension for understanding neighborhoods. For example, for the Metro Renters Tapestry segment, around 85 percent of the residential population is classified as Urban Core, around 8 percent as Suburb, and around 7 percent as Urban Vicinity. For more information, see Esri Urbanicity Type.
Refreshed user experience and expanded data documentation
Looking for the rundown on each Tapestry segment and LifeMode group? You can now access both high-level summaries and specific attributes directly from the dataset documentation. Start with the Introduction to LifeMode groups page, then choose a group to learn more about the segments within it.
These summaries are intended to be used as a guide to explore general patterns across groups and segments. When combined with mapping and data visualization tools, you can use Tapestry data to identify hot spots and compare trade areas within specific sites. You can also overlay relevant data, such as infrastructure, competitor locations, and points of interest, to gain spatial insights. Additionally, generating infographics, reports, and other data visualization products can help you summarize and compare areas of interest.

Tapestry data is most meaningful when incorporated into hyperlocal analysis. The number of neighborhoods that you are generalizing determines your analytic outcome: generalizing large populations tends to reveal broader characteristics and population trends, while classifying smaller populations creates a more detailed and descriptive profile of a community.
ArcGIS Tapestry data is representative of general community-level trends and should not be used to infer characteristics and behaviors at an individual level. For example, a segment associated with a community-level pattern of frequent social media use does not suggest that all individuals residing in that segment are uniformly frequent social media users.
With the appropriate tools and a well-defined approach, Tapestry can provide a powerful, multidimensional lens into the dynamic relationships between lifestyles, life stages, and location. It can be applied to small-scale analysis across a wide range of sectors, offering community-level insights relevant to marketing and commercial real estate as well as urban planning and policymaking.
Let’s say you’re an outreach coordinator for a public health nonprofit. You’ve been tasked with expanding access to mobile primary care facilities, and your goal is to identify priority neighborhoods and develop targeted communication strategies to notify those who could benefit.
Here’s how you could use the Tapestry data documentation as a starting point for creating an effective campaign strategy:
Identify your target audience: Using the Introduction to LifeMode groups documentation, determine your target audience. Based on the summary, narrow your focus to LifeMode group I: Countryscapes. This group is characterized by older individuals and families with long commute times.
Dig into the documentation: Review the segments that make up LifeMode group I. Based on the summaries and data points shown in the Key statistics, Housing and employment, and Lifestyle patterns sections, segment I1 and segment I4 emerge as potential key populations where access to public transportation and health care facilities may be limited.
Refine your approach: Apply the takeaways from how these populations engage with media to your communication strategy. Households in both segments tend to be connected on the internet and social media, so running a digital campaign could be an effective approach to engaging with these communities.
Monitor engagement: Work with partner organizations to track progress over time. Create a dashboard or other system to evaluate expected outcomes, including increased screening occurrences in your target communities, improved engagement with historically hard-to-reach populations, and stronger partnerships with trusted community institutions.
Using the Tapestry data documentation as a starting point gives your strategy an intentional, focused foundation. With clear insights into audience demographics and lifestyles, you can more effectively create campaigns that connect and deliver results.
Updated selection of data visualization products
Along with refreshed data, the June 2025 update of Tapestry brings new infographics as well as an updated poster. In addition to the standard Tapestry Profile and Dominant Tapestry Profile infographic templates, there are seven new Tapestry-specific options—including Tapestry Demographics, Tapestry Multi-area Comparison, Tapestry Targets, and more—that can be found in the infographics gallery.
For the analog Tapestry fans out there, the poster originally launched in 2004 and again in 2015 has received its first update in a decade, incorporating enhanced visuals and updated data to showcase a new chapter in the story it tells. Check out the 2025 ArcGIS Tapestry poster available to download and print.
To learn more about the ArcGIS Tapestry dataset, how it’s built, the LifeMode groups and segments that make up ArcGIS Tapestry, and how to transition from using Esri Tapestry Segmentation to ArcGIS Tapestry, see the following resources:
- ArcGIS Tapestry
- FAQ – ArcGIS Tapestry
- Migrate to ArcGIS Tapestry
- Unraveling segmentation history: how ArcGIS Tapestry stands out
- Working with ArcGIS Tapestry data in ArcGIS Business Analyst
- Enriching maps with ArcGIS Tapestry data in ArcGIS Pro, ArcGIS Online, and ArcGIS Location Platform
- ArcGIS Tapestry StoryMap

Article Discussion: