ArcGIS Business Analyst Web App provides information about specific locations—such as businesses, government buildings, and landmarks—through points of interest data. ArcGIS Business Analyst Web App is designed for non-GIS and GIS analysts alike and provides points of interest data from SafeGraph, Data Axle, DENUE, NOSTRA, and Foursquare. The points of interest search workflow in Business Analyst Web App provides an easy way to access, filter, and save this data as a map and a table.

This article focuses on how to employ points of interest data in Business Analyst Web App and uses shopping center data as an example. In the first part of the article, we’ll share a quick way to find shopping centers. In the second part, we’ll dive deeper into the search and filtering capabilities and their benefits.
Part 1: Map locations with a points of interest search
In this section, we’ll cover the simplest way to search for points of interest such as shopping malls using a points of interest search in ArcGIS Business Analyst Web App.

- In Business Analyst Web App, go to Maps > Create maps > Points of interest search.
- On the workflow pane, select SafeGraph as the data source.
- Click Category, expand Shopping, and choose Malls in the drop-down list. Click Done.
- Click Go.
- In the following screen, click View full table on the bottom to view the results table. (Click Minimize table to minimize.) Click Next.
- You can optionally change the map styles, or click Finish.
- Now that you’ve completed the workflow, you can save the results as a layer, export them to an Excel worksheet, edit the results, start a new POI search, or click I’m done.

Part 2: More options in points of interest search
In this section, we’ll dive into the details and benefits of search options, map styling, filtering capabilities, and saving results and layers from a points of interest search.
Benefit 1: Multiple search options
One of the key benefits of using points of interest data in Business Analyst Web App is that it is searchable by business name, category, and NAICS or SIC codes. In the first screen of the workflow, click More options to expose these search capabilities:
- Select data source. The current workflow supports points of interest data in the United States from SafeGraph, Data Axle, and Foursquare.
- Search by business name. If you are looking for specific business names (i.e., Westfield Mall), you can search by that name here.
- Search by category. If you are looking for all points of interest in a specific category, choose from a preselected list (i.e., for shopping centers and malls).
- Search by NAICS or SIC codes. If you have specific NAICS codes you need to search, enter those here (i.e., for shopping centers, NAICS CODE 531120 or SIC CODE 6512).
- Set search extent. You can limit your search to the map extent or other custom boundaries you have predefined on the map.

Benefit 2: Filter for accurate results
Another benefit of points of interest search is the ability to narrow down your search results by various location attributes. For instance, in searching for shopping centers and malls, we can filter the list of results by the following:
- Keywords within search results
- Site boundary
- Business name
- City, state, ZIP Code
- Employee count range, location confidence, square footage, landmark name, and location parent (if using Data Axle data source)
- Brand name (if using SafeGraph data source)
- Chain name and open confidence (if using Foursquare data source)

Benefit 3: Adjust map styles to communicate your findings
There are seven map styling options available for location symbols, with additional customizations within each style:
- Location (single symbol): This map style shows icon for each location or clusters of locations.
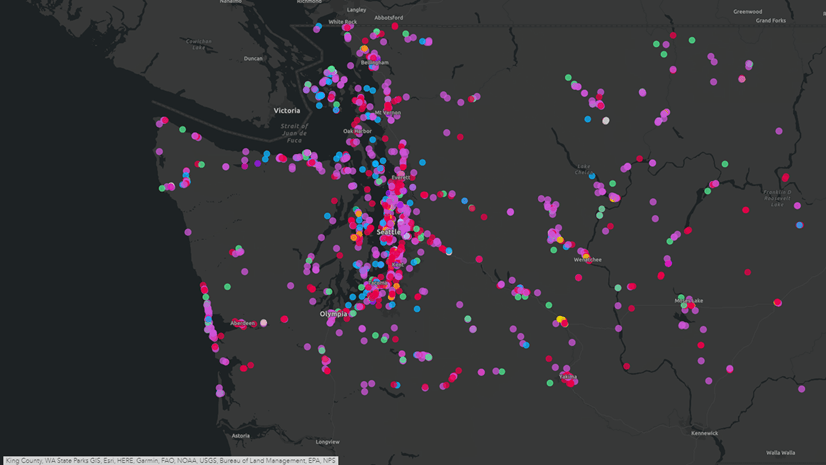
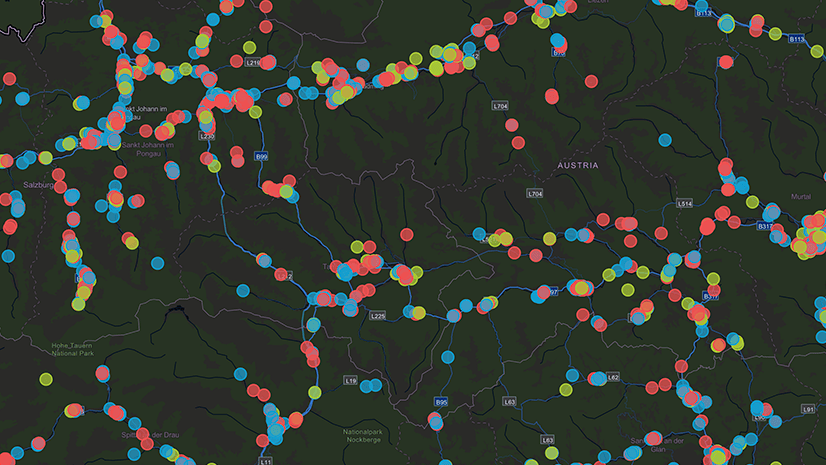
- Types (unique symbols): This map style allows different colors, shapes, and sizes by specific attribute labels. For example, if you are using NAICS codes for shopping centers and other retail businesses, you can show different symbology for each NAICS code.
- Heat map: This map style shows concentrations of specific locations. For example, if you want to show concentration of shopping centers and malls instead of specific locations, this is a good style to choose.
- Counts and amounts (color): This map style varies color gradient by the quantity of attributes selected. For example, you can use sales volume in shopping centers and malls where the darker colors denote larger sales volume. (Map style only available for Data Axle data source.)
- Counts and amounts (size): This map style varies the size of the icon by attribute quantity. (Map style only available for Data Axle data source.)
- Color and size: This map style varies the size and color of location icon by specific attributes’ quantity. (Map style only available for Data Axle data source.)
- Types and size: This map style varies the size and color of location icon by attribute label. (Map style only available for Data Axle data source.)
The default style, Location (single symbol), allows you to cluster points and change the symbol, import custom symbols, and color or size changes.

Style options offer additional customizations including 1) changing the color, size, and shape of the location icon and 2) changing the color and size by attributes as shown below.


The different map styles provide a wide range of flexibility in communicating your spatial analysis. The images below show different map styles of the same data, in this case a POI search for home furniture and furnishings stores.


Benefit 4: See detailed results
You can also see the details of your search results by clicking View full table. The expanded table below includes shopping centers and malls data with business name, address, city, state, ZIP Code, NAICS and SIC code, number of employees, and sales volume.

Once you are satisfied with the search results, you can export the table, save the layer, and share it with your organization. The saved layer can be used as complementary or competitive layers as part of a suitability analysis in Business Analyst Web App.
Additional resources on points of interest search
For detailed step-by-step instructions, you can refer to the following additional resources on points of interest searches:
- Guided tours: Click the Account details drop-down menu and select Guided tours. On the guided tours window, you can select Level 3, the second tour called “Search for businesses and points of interest.”
- Help documentation: Map points of interest
- Tutorial video: Points of Interest Search in Business Analyst
We hope you found this article helpful in learning how points of interest information can be employed through Business Analyst Web App’s points of interest search workflow. Please do not hesitate to reach out with comments or questions to businessanalyst@esri.com.
Other resources
For general information regarding ArcGIS Business Analyst, please use the following links:
- Business Analyst product overview page
- Review pricing and purchase Business Analyst
- Business Analyst resources page
- LinkedIn user group
- ArcGIS Business Analyst Web App video channel
- Esri Community
- Business Analyst Web App login page
- Email the team: businessanalyst@esri.com
Header image created in ArcGIS Business Analyst Web App using points of interest search with Types and Size map style, with Nova Map basemap.
This article was originally published on January 8, 2021, and has been updated.


Article Discussion: