With the June 2026 data release, there are new U.S. geographic boundaries in ArcGIS Business Analyst, including neighborhoods, ZIP Code Tabulation Areas (Census ZCTAs), and Combined Statistical Areas (CSAs).
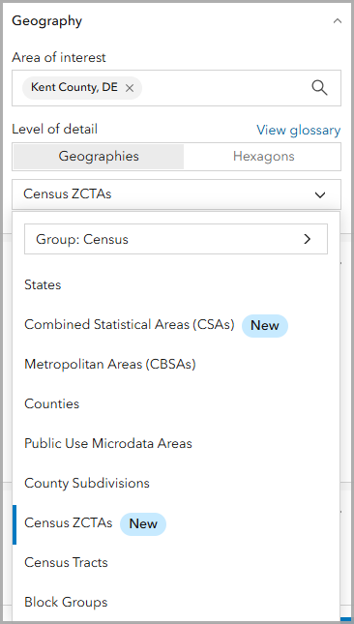
To access new boundaries, set the area of interest then use the Level of detail drop-down menu in mapping and analysis workflows. For example, CSAs and Census ZCTAs are both available in the Census geography group list.
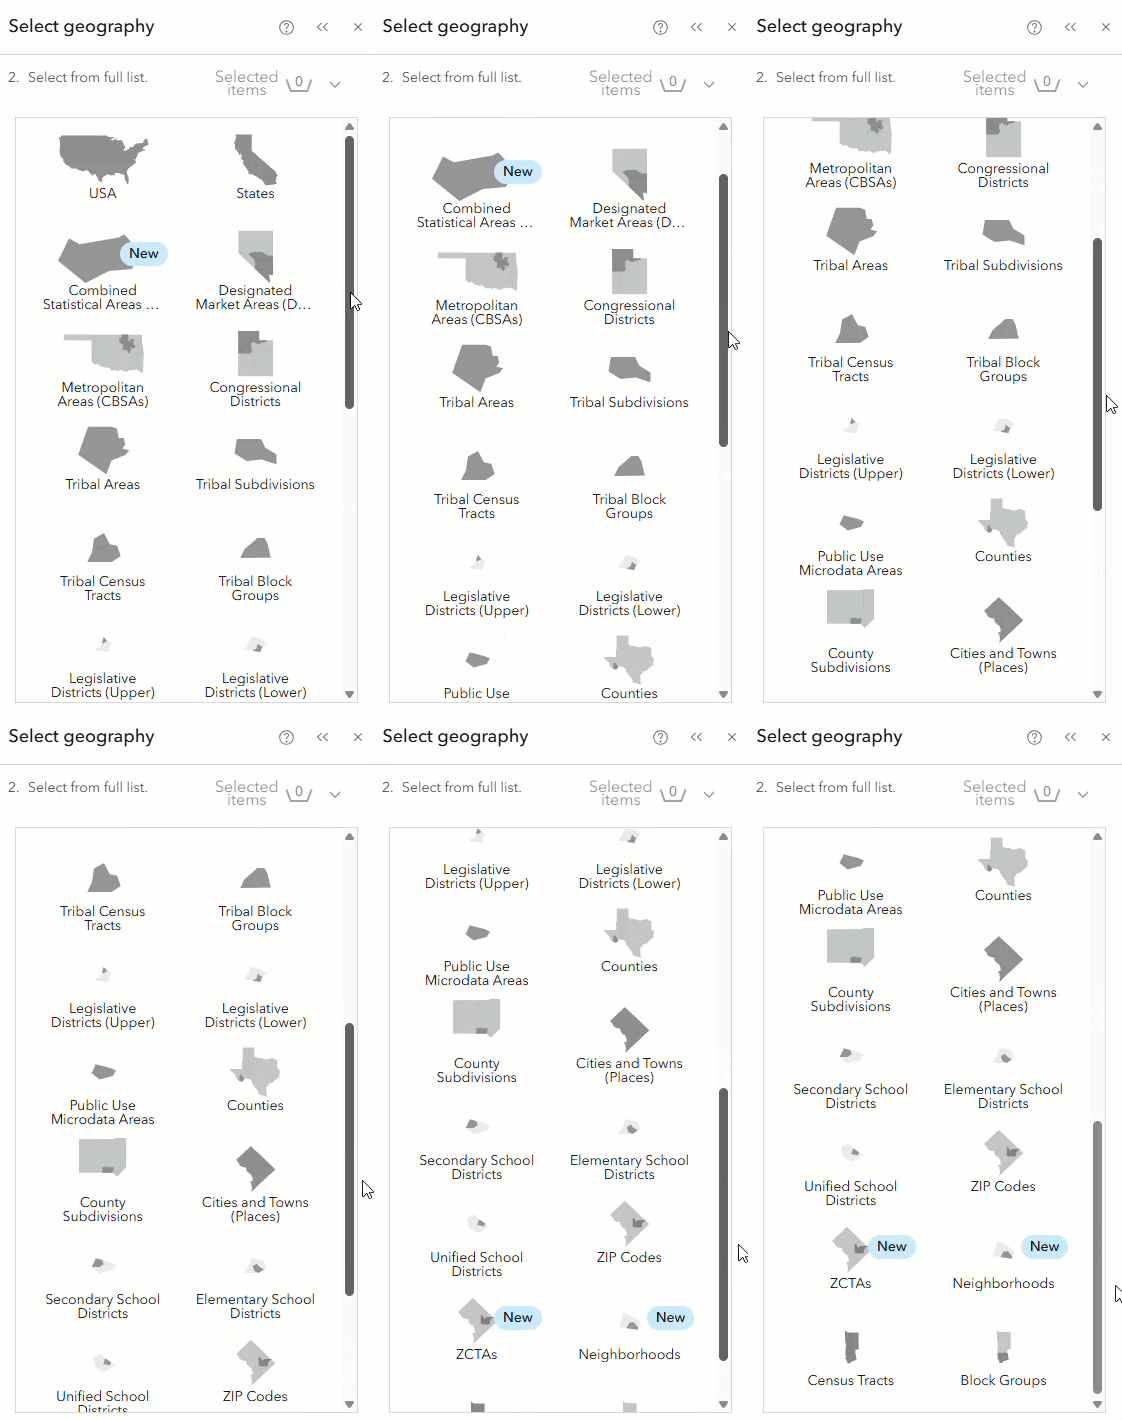
You can also with the new boundaries using the Select geography workflow.
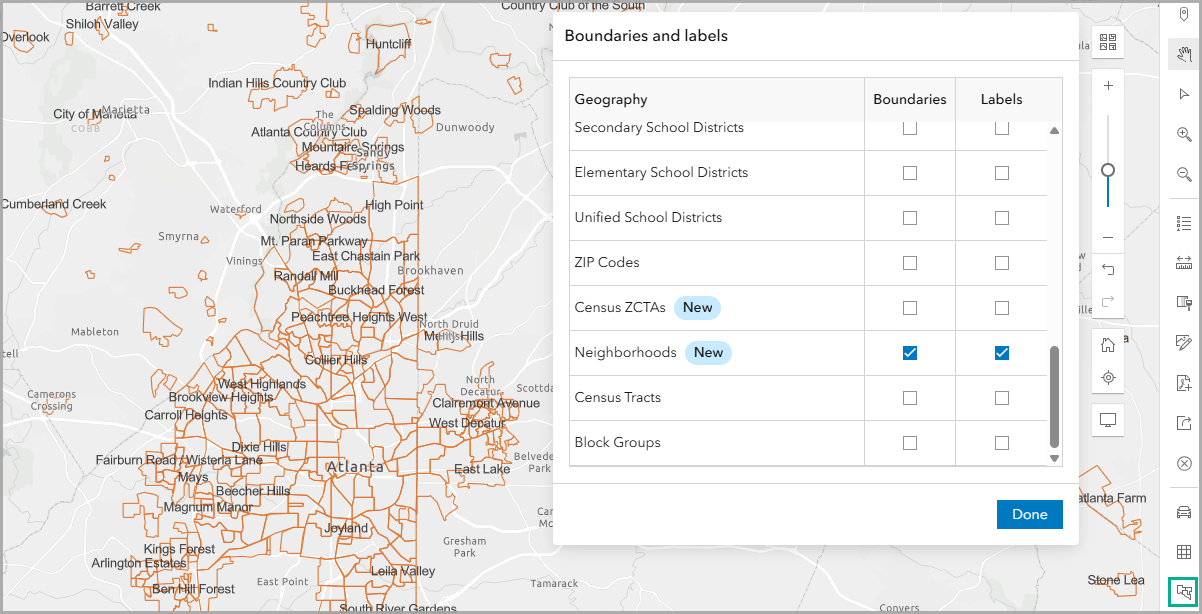
Another way to explore the new geographic boundaries is to use the Boundaries and labels map tool.
Additionally, census tract-level data has been improved and expanded. With the upcoming release, you will be able to use census tract-level data in any workflow that accesses the data browser.
Neighborhoods
Neighborhoods are geographic regions reflecting the consensus of where residents perceive neighborhood boundaries. These hyper-local areas provide a community with a sense of place independent of administrative boundaries. For example, census tracts and block groups are useful for local analyses, but the long numeric identifiers are not recognizable as community areas. Neighborhoods, on the other hand, allow for focused analysis using less formal geographic identifiers. Typically, neighborhoods are mapped in urban areas, such as SoHo in Manhattan.
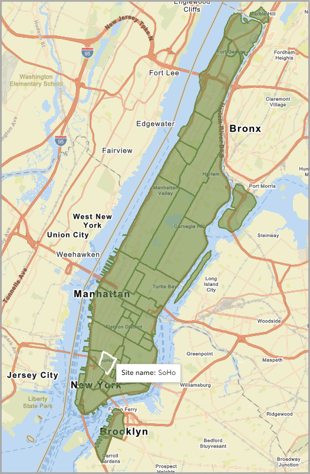
These boundaries are not mapped continuously but instead reflect the reality of where places are distinguishable as neighborhoods. For example, neighborhoods in Los Angeles County are like patchwork. Some areas, like Reseda, are surrounded by other identifiable neighborhood boundaries on all sides. Other neighborhoods, like Sand Canyon, are geographically isolated in terms of surrounding neighborhoods.
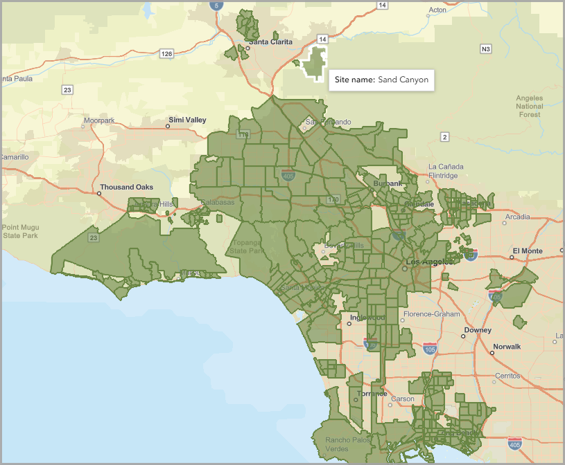
Some potential applications for using neighborhood data in ArcGIS Business Analyst include:
- Map bars and restaurants open late at night in Manhattan to see which neighborhoods are late night hubs.
- Create a color-coded map in Chicago to see which neighborhoods have a high population density of daytime workers.
This data is provided by the ATTOM Data Neighborhood and Residential Subdivision Boundary Project. It includes over 28,000 new neighborhood boundaries.
In Business Analyst Web App, to use neighborhoods as the level of detail, browse either the Marketing or All geography group lists.
ZIP Code Tabulation Areas (Census ZCTAs)
ZIP Code Tabulation Areas (ZCTAs) are geographic areas based on the ZIP codes used by the United States Postal Service (USPS). ZIP codes assess street networks and housing units to determine delivery routes, but do not represent standard census geographic areas for data reporting. Census ZCTAs aggregate ZIP code-level data into generalized areas that can be used for mapping and analysis.
Unlike ZIP codes, Census ZCTAs do not change with each iteration of the census, providing a continual geographic reference for long-term analysis.
In the June 2026 release, you can use both ZIP codes and Census ZCTAs within ArcGIS Business Analyst mapping and analysis workflows. While it sounds (and looks) similar, the geographic boundaries and related data are different for each level.
For example, perform suitability analysis using ZIP codes and Census ZCTAs in Kent County, Delaware. The resulting maps may look similar, but if you look closer, there are some differences. There are 19 Census ZCTAs and 18 ZIP codes. The area northeast of Kent is shaped differently, as is the area north of Felton. These differences show that Census ZCTAs are not a 1-1 replacement for ZIP codes. You can use Census ZCTAs to add to the long-term understanding of an area.
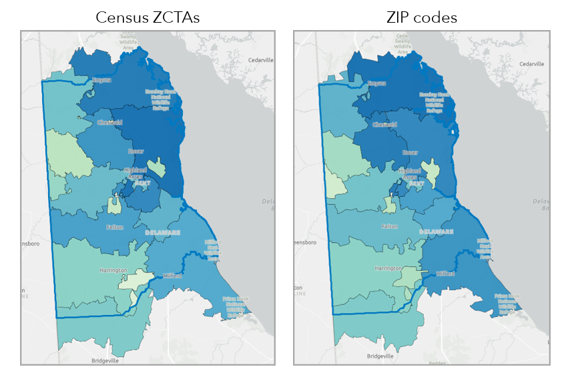
Some potential applications for using ZCTA data in ArcGIS Business Analyst include:
- Use smart map search to create a map that shows Census ZCTAs with high potential for economic development.
- Perform a points of interest (POI) search of essential services, like hospitals. Create an additional layer to visualize population density in a color-coded map based on Census ZCTAs. With the overlay, identify Census ZCTAs with high population density and proximity to essential services to plan road development.
This data is provided by the U.S. Census. It includes over 33,000 new ZCTA boundaries.
In Business Analyst Web App, to use ZCTAs as the level of detail, browse either the Census or All geography group lists.
Combined Statistical Areas (CSAs)
Combined Statistical Areas (CSAs) are geographic areas that combine adjacent Core Based Statistical Areas (CBSAs). A CBSA is either a metropolitan statistical area (MSA) with a population of over 50,000 people in their largest urban area, or a micropolitan statistical area (μSA), with a population of 10,000 to 50,000 people in their largest urban area.
CSAs represent regional economies, with adjacent CBSAs having significant economic synergy. For example, people may commute to work somewhere but live and spend money elsewhere. CSAs visualize our perceptions of where a regional economy is on a map. Instead of mapping multiple CBSAs to create a patchwork map of urban cores, you can create maps using CSAs to represent a massive web of economic interaction.
The largest CSA is New York—Newark, which includes the area surrounding New York City, from Trenton to Danbury and Kingston to Hemlock Farms.
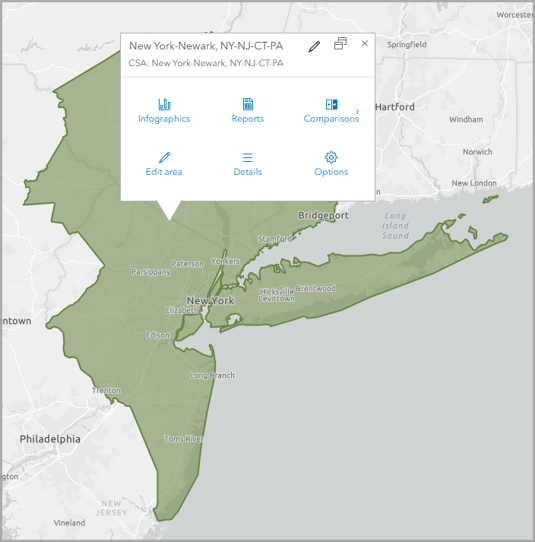
Some potential applications for using CSA data in ArcGIS Business Analyst include:
- Create a color-coded map of uninsured adults in a CSA to guide regional health outreach.
- Perform a void analysis to map the count of senior centers in an analysis area with the local CSA as the reference area.
This data is provided by the U.S. Office of Management and Budget (OMB). It includes 181 new CSA boundaries.
In Business Analyst Web App, to use CSAs as the level of detail, browse either the Census or All geography group lists.
Updated census tract data
In the June 2026 release, census tract-level data has been improved and expanded. Currently, census tract-level data is only available in some mapping workflows. With the upcoming release, census tract-level data will be available in any workflow that uses the data browser, including building infographics.
If you use the Esri 2025 data source and create a color-coded map, when you browse all variables, the ACS 2019-2023 dataset and Census 2020 dataset each have two instances. The census tract-level data is stored separately from the other data.
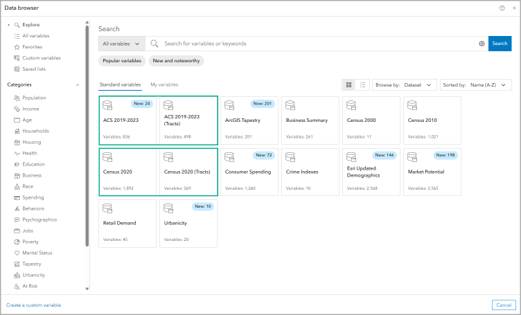
With the June 2026 release, the census tract-level datasets for ACS and Census 2020 are not stored separately and are available for any workflow that uses the data browser. For example, if you use the Esri 2026 data source and build an infographic, when you open the data browser, the ACS 2019-2023 and Census 2020 datasets only have one instance each.
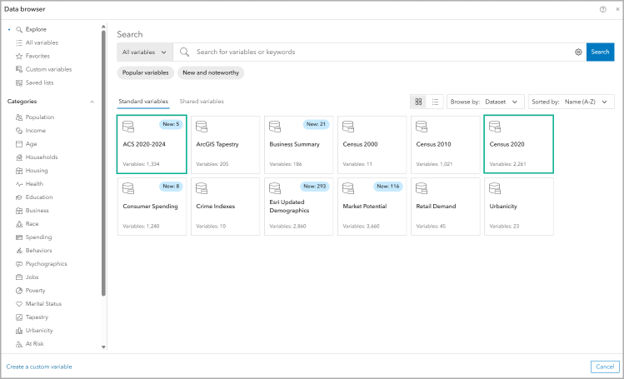
This is significant because now over 480 variables have expanded availability. These variables include:
|
|
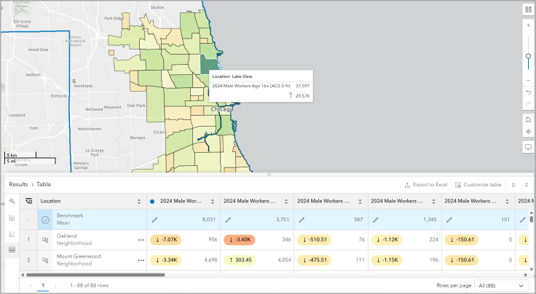
For example, you can run benchmark comparisons to understand how people commute to work based on neighborhoods in Chicago. You can use this information to see which areas have the most drivers and may need expanded public transit options.
Summing it up
This article describes the new and updated geographies available in ArcGIS Business Analyst in the June 2026 release. New geographic boundaries continue to be added to ArcGIS Business Analyst to support customer analysis of nuanced areas.
Resources
Now that you’ve learned about the upcoming geographic boundary updates, we hope you’ll explore more capabilities in Business Analyst. To continue your Business Analyst journey, visit the following resources:
- Business Analyst product overview page
- Review pricing and purchase Business Analyst
- Business Analyst resources page
- LinkedIn user group
- Business Analyst Web App video channel
- Business Analyst Pro video channel
- Business Analyst on Esri Community
- Business Analyst Web App login page
- Email the team: businessanalyst@esri.com
This blog article uses ArcGIS Business Analyst Web App Standard to map geographic boundaries and run benchmark comparisons. ArcGIS Business Analyst Web App Advanced is used to perform a suitability analysis. This article uses the Esri Updated Demographics dataset from Esri. Basemaps are provided by Esri.

Article Discussion: