For more than three decades, Esri’s Consumer Spending product has offered household consumption insights across every neighborhood in the U.S. This covers spending potential on what households are likely to spend their budget on over a broad range of more than 700 products and services. With the October 2023 release we introduce a new retail-focused database that reveals where potential spending is most likely to occur.
Esri’s Retail Demand by Industry data
Retail Demand by Industry is based on a subset of retail and related products captured in Esri’s “Retail Goods” product summary variable (X15001) within the Consumer Spending database. Industry estimates are modeled using a product-to-industry crosswalk from the 2017 Economic Census Products by Industry tables based on the North American Product Classification System published by the U.S. Census Bureau.
Included in the new database are three sets of variables:
- annual total industry potential expenditures;
- annual average industry potential spending per household;
- industry-specific Spending Potential Index (SPI).
These data measures use product and industry linkages from the Economic Census enabling a translation of spending potential estimates (by product) to 13 subsectors and 30 industry groups within Retail Trade and Food Services & Drinking Places.
You can leverage this data to distinguish which industries would be the direct beneficiaries of retail goods product spending.
One of the ways to access the data is using the Business Analyst Web App’s new Retail Demand by Industry report:
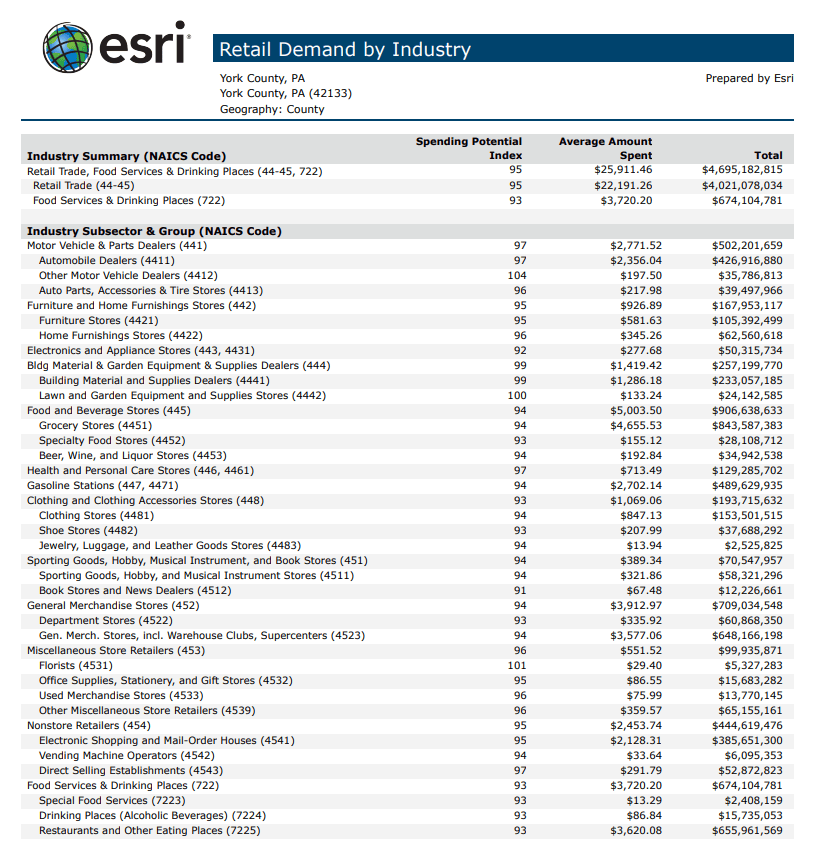
Here’s how to interpret the data…
Starting from right to left, the Total column contains a total dollar estimate that represents the potential aggregate spending by all households within an industry.
The Average Amount Spent is the dollar estimate of the potential average amount spent by all households within an industry.
The SPI, or Spending Potential Index, compares the average potential spending locally within an industry to the average potential spending nationally in that same industry. An index of 100 reflects a U.S. average. For example, a SPI of 120 indicates that average potential spending by local consumers is 20 percent above the national average.
Can I use Retail Demand and Consumer Spending data together?
All modelling aspects and assumptions from Consumer Spending also apply to the new Retail Demand by Industry data and can be viewed as an extension and complement to Esri’s suite of current year Consumer Spending estimates.
Understanding the What and Where of Retail Demand and Consumer Spending
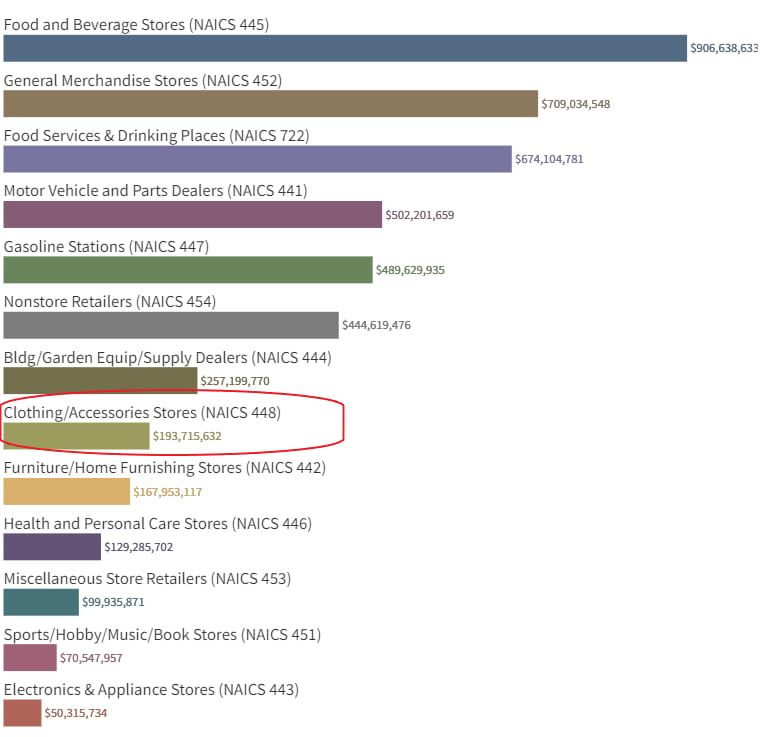
Let’s consider a clothing retailer exploring the York County, Pennsylvania trade area for future store expansion. We’ll look at both Retail Demand by Industry and Consumer Spending data to break down the what and where of spending potential.
The bar chart below isolates the York County report’s total spending by NAICS subsector, sorted by descending expenditures. A Total of $194 million is expected to be spent by consumers in Clothing and Clothing Accessories Stores in the area. From the report, the average amount spent within clothing stores is $1,069. Compared to the U.S., potential demand in this county is seven percent lower than the national average for this industry.
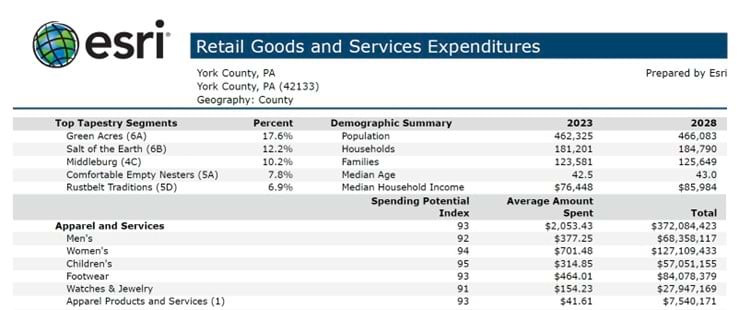
Next, let’s turn to the product expenditure estimates on the Retail Goods and Services Expenditures report from Esri’s Consumer Spending database. This report highlights what kind of items in the Apparel and Services category households have the potential to spend on. For example, out of the more than $372 million dollars spent on items in the Apparel and Service category, the largest expected spending is on women’s clothing ($127 million). Although women’s spending exceeds men’s apparel and services, that index is below the national average by six percent.
Is the Retail Demand comparable to Retail MarketPlace?
For those data users familiar with Esri’s deprecated Retail MarketPlace (RMP), these new demand side estimates are not directly comparable. The RMP model was designed to measure the size of the retail sector with calibration to the Census Bureau’s Monthly Retail Trade Survey (MRTS). The “Retail Potential” estimates in RMP underwent additional realignments to better reflect market scale. These new industry demand variables were developed using a different modelling framework. This means these spending totals may reflect a lower value than what was shown in the RMP database. Like Esri’s Consumer Spending, these new industry demand estimates also represent a share of budget allocation.
Accessing the Data
Explore all of Esri’s demographic products and offerings, including the new Retail Demand by Industry database. U.S. data is available for all geographic levels and any user-defined polygons such as rings or drive times, and accessible across Esri’s suite of products. To purchase this data or other demographic products, contact our data sales team at 800-447-9778 or email your request to datasales@esri.com.

Article Discussion: