Have you ever looked at socioeconomic and demographic data trends for an area and wondered why there was an unexpected change in population? Or how the number of households could increase by 50% in one year?
These are the questions that data users grapple with daily. And the numbers aren’t always what they seem.
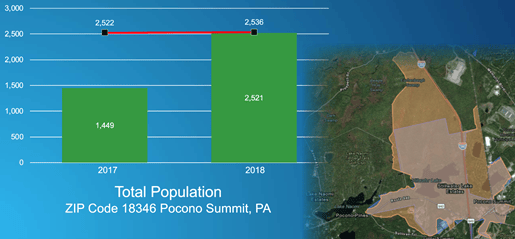
Let’s look at ZIP Code 18346 in the state of Pennsylvania… In 2017, the total population was 1,449. In 2018, the total population was 2,521. At face value, it appears there was a 74% increase in population between 2017 and 2018! Upon further exploration however, we can see that the geographic area represented as ZIP Code 18346 in 2018 was dramatically different from that in 2017, and was much larger. In essence, the two population counts were not comparable because they were not representative of the same geographic area. When normalized for geography, there was minimal growth in this ZIP Code.
This is all good background for what’s happening right now, and only happens every 10 years, in the U.S. Can you guess? It’s the decennial census. In addition to counting every person in the U.S., the U.S. Census Bureau also adjusts the boundaries of census geographies to better reflect visible features and nonvisible legal boundaries, as well as maintain an optimum population size within geographic units.
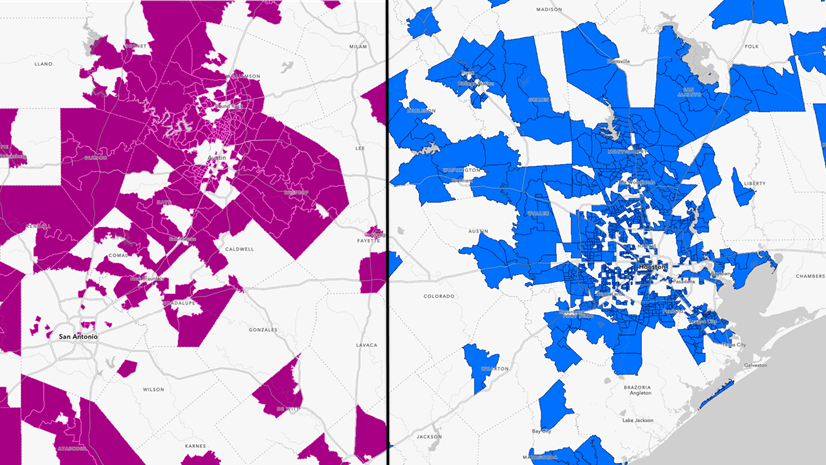
For example, the area represented by a single San Diego County Census Tract from the 2010 Census is now represented by seven (7) new Census Tracts in 2020. Additionally, only a portion of new Census Tract 133.16 covers area originally contained in Census Tract 133.1.

Measure change with confidence…
So, given geographic change between decennial censuses, how does one measure demographic change from 2010 to 2020? Esri has developed a methodology to convert data from previous census releases into 2020 geography, which enables temporal analysis for total population, household population, group quarters population, households, housing units, and average household size. Converting 2010 and 2000 census data into 2020 geographic boundaries enables comparisons across three time periods. This means data users can easily discern real demographic change from geographic change.
Access more data…
In June, Esri will expand the available datasets in 2020 geography by releasing a full complement of 2010 Census data as well as Esri’s annual 2022 estimates and projections for the U.S.
Available Now
-
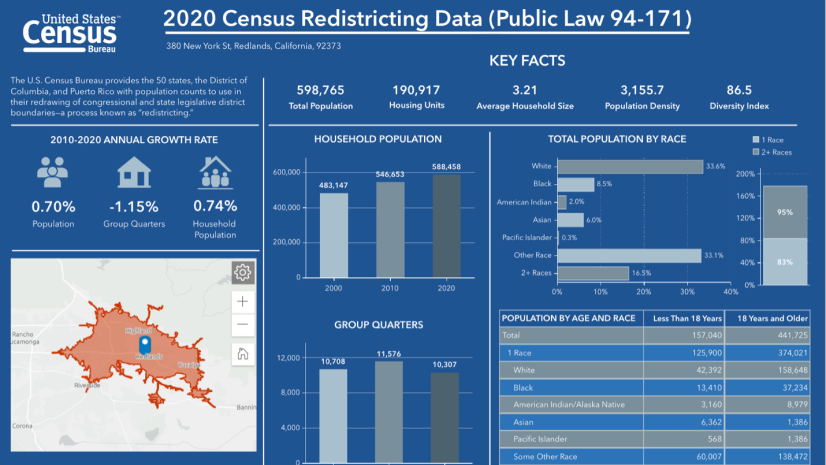
- Census 2020 Redistricting Data
- Census 2010 and 2000 (20 data variables)
Coming Soon
-
- Census 2010 and 2000 (1,000+ data variables)
- Esri Updated Demographics
- Esri Tapestry Segmentation
- Esri Consumer Spending
- Esri Market Potential
- Esri Business Summary
- American Community Survey (ACS) 2016-2020
Save time working with data…
Esri has also built some shortcuts for working with this data:
Non-Census Geographies: For the U.S., data are available in 11 geographic schemas, including HERE residential ZIP Codes and Nielsen Designated Market Areas (DMAs). Neither ZIP Codes nor DMAs were part of the Census Bureau’s data release. For Puerto Rico, data is available for eight geographic schemas, including HERE residential ZIP Codes.
Calculated Items: Esri produces a set of derived statistics, including compound annual growth rates for all totals, vacant housing units, average household size, population density, and Esri’s Diversity Index.
Hispanic by Race: The Census Bureau releases data tables for the non-Hispanic population by race and non-Hispanic population by race for the population 18 years of age and older. Esri uses the released census data to calculate the residual Hispanic data tables. These include Hispanic population by race and Hispanic population by race for the population under the age of 18.
Get Started
Esri Demographics including Census data are available in various products including:
- ArcGIS Living Atlas of the World—Access ready-to-use maps.
- ArcGIS Business Analyst
- ArcGIS for Office
- ArcGIS GeoEnrichment Service
- Buy Esri Reports online.
For information about purchasing data as a stand-alone dataset, contact datasales@esri.com.
Additional Resources
- Esri Data Catalog
- Esri Data Catalog (2020 Census Edition)
- 2020 Census (Esri Methodology Statement)
- Learn Lessons – Get started with Demographics
- Learn more about boundary changes introduced with the 2020 Census.
- Has your neighborhood changed? Check out the 2019 vs 2020 Census Tract Comparison App


Article Discussion: