Every ten years, the United States TIGER boundaries are re-evaluated to align with any major changes in the US population. Since the 2016-2020 5-year American Community Survey (ACS) overlaps with the 2020 decennial Census, the newest TIGER boundaries have brought changes to the ACS data release.
You might have questions like: How will this impact my ACS maps? or What does this mean for my area? This blog will outline a few things to expect when working with these new TIGER boundaries.
One way ACS estimates can be accessed is through ArcGIS Living Atlas of the World. These Census ACS layers are updated annually to match the U.S. Census Bureau’s data releases, so you can always have access to the most current ACS estimates. These Census ACS layers provide ACS data at the state, county, and tract level geographies, and cover a wide range of ACS tables. If you use the Census ACS layers from Living Atlas, this blog will help you learn what to expect with the 2016-2020 boundary changes for your area.
Boundary Updates/Changes
The 2016-2020 ACS estimates should be joined to 2020 TIGER boundaries, as specified by the U.S. Census Bureau. Since the 2020 boundaries overlap with a decennial Census year, there are many changes to expect in regards to the county and Census tract boundaries used with the Census ACS layers. The decennial Census gives the U.S. Census Bureau a chance to re-evaluate boundaries based on how the population has changed over time. Because of this, some tracts are grouped together, while others are split into multiple tracts to accommodate new housing built in the past 10 years. Let’s explore what major changes to expect for the county and tract geography levels included in the Living Atlas layers.
County
In the previous years, there have been 3,220 counties in the US, including Washtington D.C. and Puerto Rico. In 2020, one Census Area was split into two Census Areas, so there are now 3,221 counties.
The Valdez-Cordova Census Area in Alaska (FIPS 02261) has been split into two new FIPS: Copper River Census Area (FIPS 02066) and Chugach Census Area (FIPS 02063).
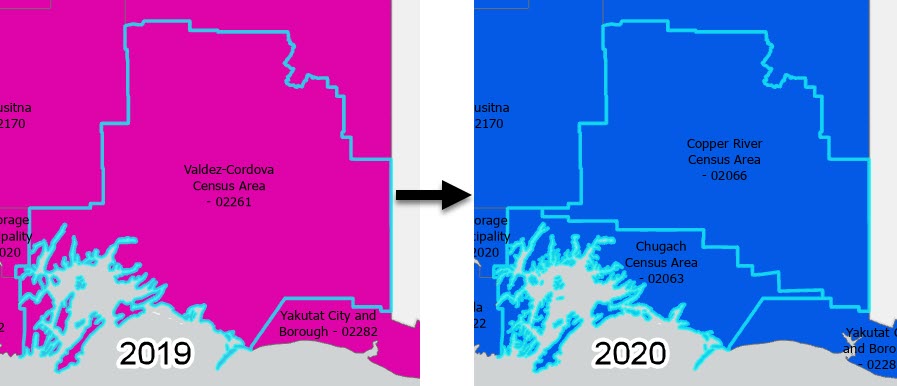
What this means is that not only do the counties have a new GEOID FIPS, but so do the lower levels of geography such as tracts, block groups, and blocks that fall within these Census Areas. This is something to keep in mind if working with these areas in Alaska.
Census Tract
In some scenarios, population decline in certain areas can result in tracts merging into a single tract. In other scenarios, population growth or new housing structures can result in tracts splitting into two or more new tracts. The 2020 tract boundaries contain a large number of updates from the previous 2019 boundaries.
Some key things to note as the 2019 ACS boundaries are updated to reflect the new 2020 boundaries:
- The Living Atlas Census ACS layers contain census tracts with area, meaning tracts without any area are not included in the counts below (areas fully in the ocean or other water bodies).
- In 2019, there were 73,642 tracts with area. In 2020, there are now 85,034 tracts with area.
- 62,163 tracts remain the same from 2019
- 11,479 tracts were changed/deprecated. This will mean that they have new boundaries and new FIPS codes (the GEOID field). These deprecated FIPS codes will be removed from the Living Atlas Census ACS layers since they do not have any matching 2016-2020 data estimates.
- 22,871 new tracts with new FIPS codes and boundaries were created. Many of these are derivatives from the deprecated FIPS, mostly where tracts were split into two new tracts.
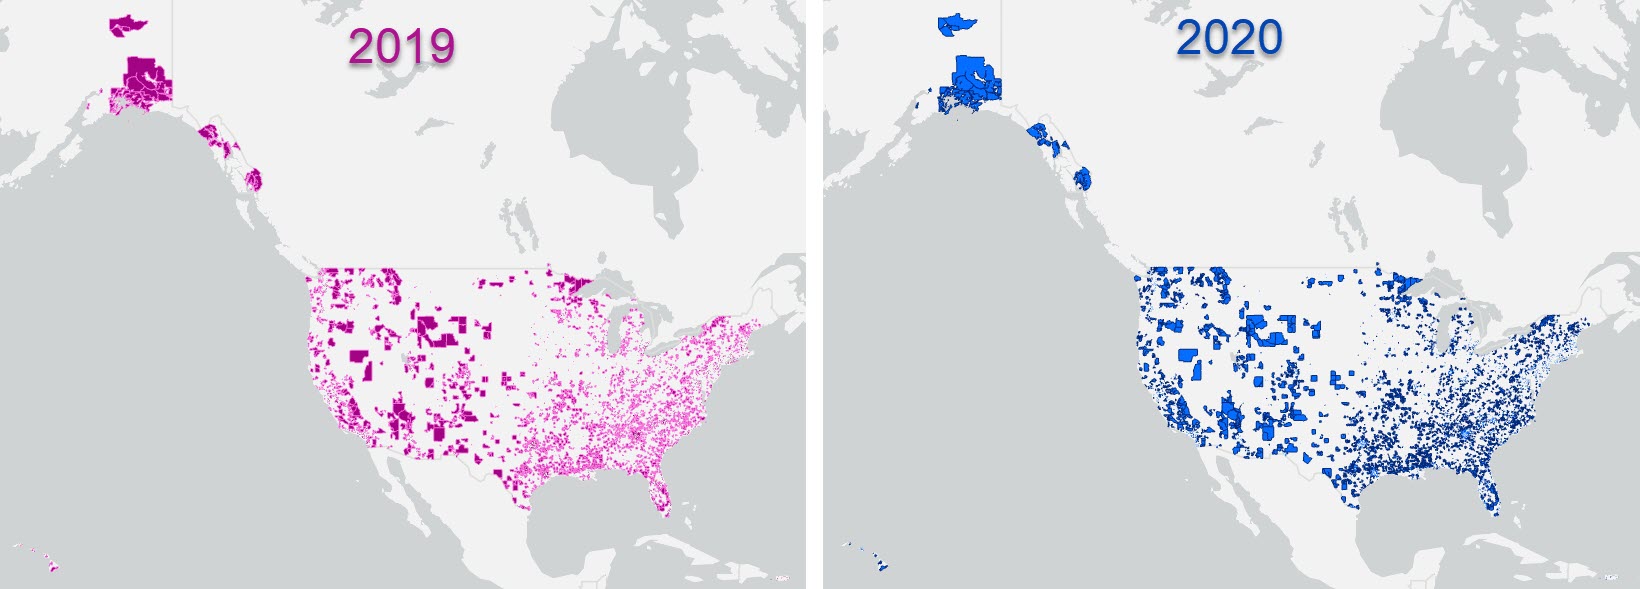
To see just how many tracts this impacts in the US, see the visualization below:
For example, here’s a tract that was split into two tracts in Georgia due to population growth in areas of Neese and Sanford:
What does this mean for my area?
To better understand what this means for your county or neighborhood, it helps to understand which tracts have had changes. The swipe app below allows you to find your area in the US and explore which tracts have changed. Click on a blue tract to see the new FIPS code, and swipe the app to see how this compares to the older 2019 tract FIPS (in purple).
Compare 2019 and 2020 FIPS codes in your area
Search for your area and click on a Census tract to learn more. Swipe the app to compare the boundaries, FIPS, and area between 2019 and 2020.
What does this mean for my maps?
In general, if you have maps that use the Census ACS layers from Living Atlas, you should not have to make any changes to your existing maps. The data for the Living Atlas layers is swapped behind the scenes, so all the old FIPS will be removed, and the new ones will be added to the data table. This will mean that the data tables will contain a higher number of features than with the 2015-2019 ACS data.
However, if you have a FIPS-driven filter or query, you may need to make appropriate updates to reflect the new GEOID values. The app above, which can also be found here, can be helpful for understanding the changes to the FIPS. Similarly, if you have created an app or JavaScript application using a custom filter or query, you may need to make updates.
Another way the boundary change may impact your maps is if you are using the Area Water or Area Land values from the TIGER boundaries. Since many tracts were split or combined, area values will change. For the Census ACS layers, the most current AWATER and ALAND attributes from TIGER are included within the services for reference.
For detailed information about how the 2020 boundaries compare to previous FIPS codes and boundaries, visit this page and this page from the U.S. Census Bureau. For technical boundary change notes from the U.S. Census Bureau, visit this page.
More information
2019 vs 2020 Census Tract Comparison App
For more information about the upcoming update to Living Atlas Census ACS layers, visit this blog.
For additional information, the U.S. Census Bureau offers News & Updates through their website. There, you can find news, updates, information about data releases, and you can even sign up to receive email updates. To see the 2020 Data Release schedule, visit this page.

Article Discussion: