In the June release for ArcGIS Online, updates to demographic data for several countries are planned.
The following countries will be updated from 2016 to 2018 demographic data from Michael Bauer Research:
- North America: Greenland
- Central America: Guatemala, Honduras, Nicaragua
- Caribbean: Aruba, Bahamas, Bermuda, Cayman Islands, Dominican Republic, Guadeloupe, Jamaica, Martinique, Puerto Rico, Trinidad and Tobago
- Oceania: French Polynesia, New Caledonia
In addition, Esri is releasing its 2019/2024 U.S. demographic data which includes updates to the following datasets:
- 2019/2024 Updated Demographics
- 2019 Tapestry Segmentation – incorporates Esri’s latest demographic estimates.
- 2019/2024 Consumer Spending – incorporates the latest Consumer Expenditure Surveys (CEX), 2016-2017, from the Bureau of Labor Statistics (BLS). New with this release are the five-year forecasts of Consumer Spending data.
- 2019 Market Potential – incorporates the latest Doublebase 2018 survey data from GfK MRI.
- 2013-2017 ACS 5-year Estimates – includes new topics: Class of Worker, Gross Rent, Number of Earners, Computers & Internet Subscriptions.
- 2019 Business Summary – incorporates Infogroup business data from January 2019 summarized by SIC and NAICS categories.
- Business Locations – from Infogroup, April 2019.
- Traffic Counts – from Kalibrate, Q1 2019.
- Crime Indexes – from Applied Geographic Solutions (AGS), 2019A.
- 2017 Retail MarketPlace – While there are no updates to the data, the 2017 Retail MarketPlace data and report will continue to be available.
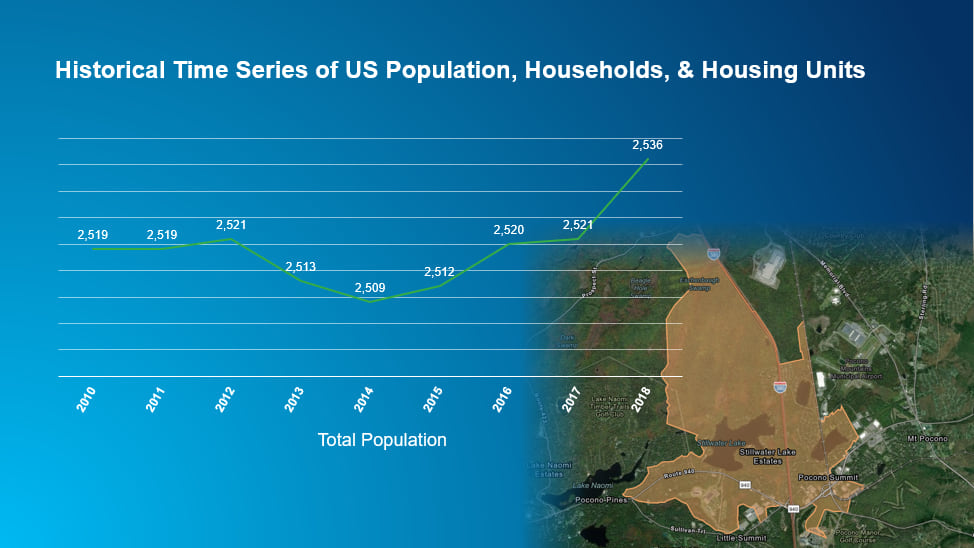
Historical Time Series
Generally speaking, geography changes and methodology improvements make comparing data from one year to the next a tricky business. New with this release, Esri’s vintage-based time series enables users to see an apples-to-apples comparison of population, household, and housing unit change over time. Standardizing multiple years of data on a single vintage base, results in a true understanding of growth, or decline, in an area. With the historical time series from Esri, you can see how things are changing on an annual basis from 2010 through 2019.
Wealth Index
Esri’s Wealth Index is compiled from a number of indicators of affluence including average household income and average net worth. The concept of wealth is defined by more than just above-average household income. Wealth also includes the value of material possessions and resources. Esri captures both income and the accumulation of substantial wealth, or the abundance of possessions and resources in its identification of the wealthiest areas in the country. The index represents the wealth of the area relative to the national level. Values exceeding 100 represent above-average wealth.
Housing Affordability
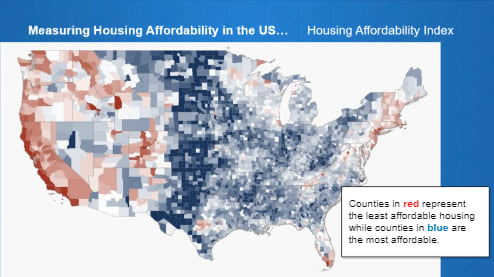
Housing Affordability is the financial ability to purchase a home and is largely driven by the gap between household income and home value. Housing affordability has wide ranging effects including influencing migration patterns and affecting the ability of renters to become home owners.
Esri’s housing affordability index quantifies the ability of a typical resident to purchase an existing home in an area. The model employs a national average effective mortgage rate from the Federal Housing Finance Agency, an interest rate of 4.55 percent, and a 30-year mortgage is assumed with a down payment of 20 percent of the home price. Regional property tax rates are determined from the latest American Community Survey and Esri’s model follows the Federal Housing Administration’s guidelines for debt service ratios.
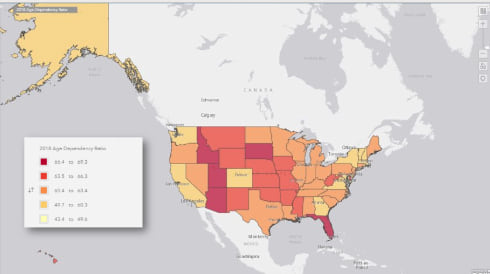
Life-stage and Age Dependency Ratios
The Age Dependency ratios measure the ratio of children and seniors, to the working age population and are available for 2019 and 2024. Children are defined as population aged 0-17. Seniors are defined as population aged 65 and over. The working age population is defined as population aged 18-64.
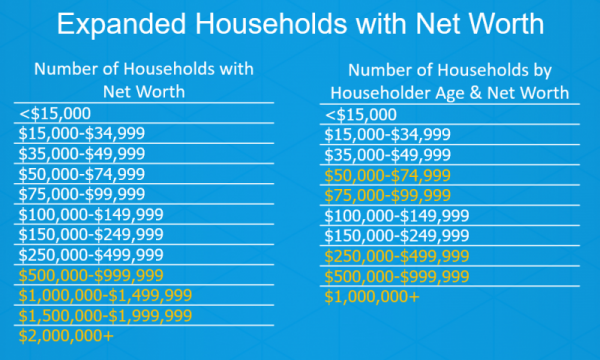
Expanded Net Worth
Esri has developed new methods to trend high net worth ranges. As a result, more detail is available when analyzing households by net worth.
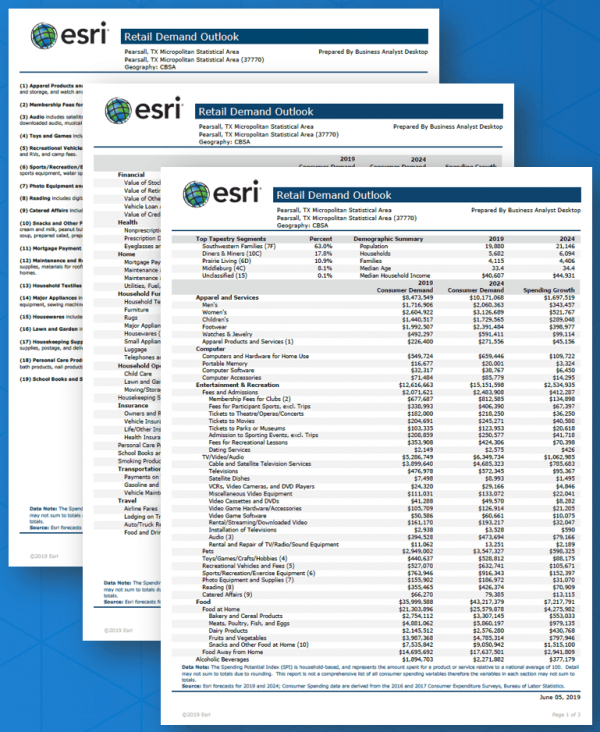
Consumer Spending
Esri’s five-year forecast of Consumer Spending provides a glimpse of future spending for consumer products and services five years out. The data can be viewed in a new report called Retail Demand Outlook.

Commenting is not enabled for this article.