The goal of image analysis is to transform imagery into meaningful information. When paired with GIS workflows, users can get more value from each pixel by extracting features from imagery. In a typical GIS workflow, these extracted features may exist in a siloed dataset or feature class, causing users to miss critical insight or connections to data that exist elsewhere in their organization.
Leveraging the power of ArcGIS Excalibur, a focused web-based imagery analysis application aimed to create content from imagery sources, and its integration with ArcGIS Knowledge, users can identify important and key features from imagery to store as observations in an entity-centric model. This allows users to collect observations directly from imagery into a knowledge graph, where new spatial entities can be immediately related to other entities already known within your graph network, adding additional context to observed features that can be used across an organization in further downstream analysis.
In the rest of this blog, we’ll cover how to work with graph-based observation layers in an Excalibur project to help streamline and enhance data collection workflows.
ADDING OBSERVATION LAYERS TO AN EXCALIBUR PROJECT
Observation layers can be used in Excalibur projects to collect features from imagery and video. In this example, an analyst was tasked with using imagery to collect aircraft observed at the Billy Bishop Toronto City Airport. The source of the observations was a knowledge graph, allowing the aircraft collections and relationships to be written directly to the graph.
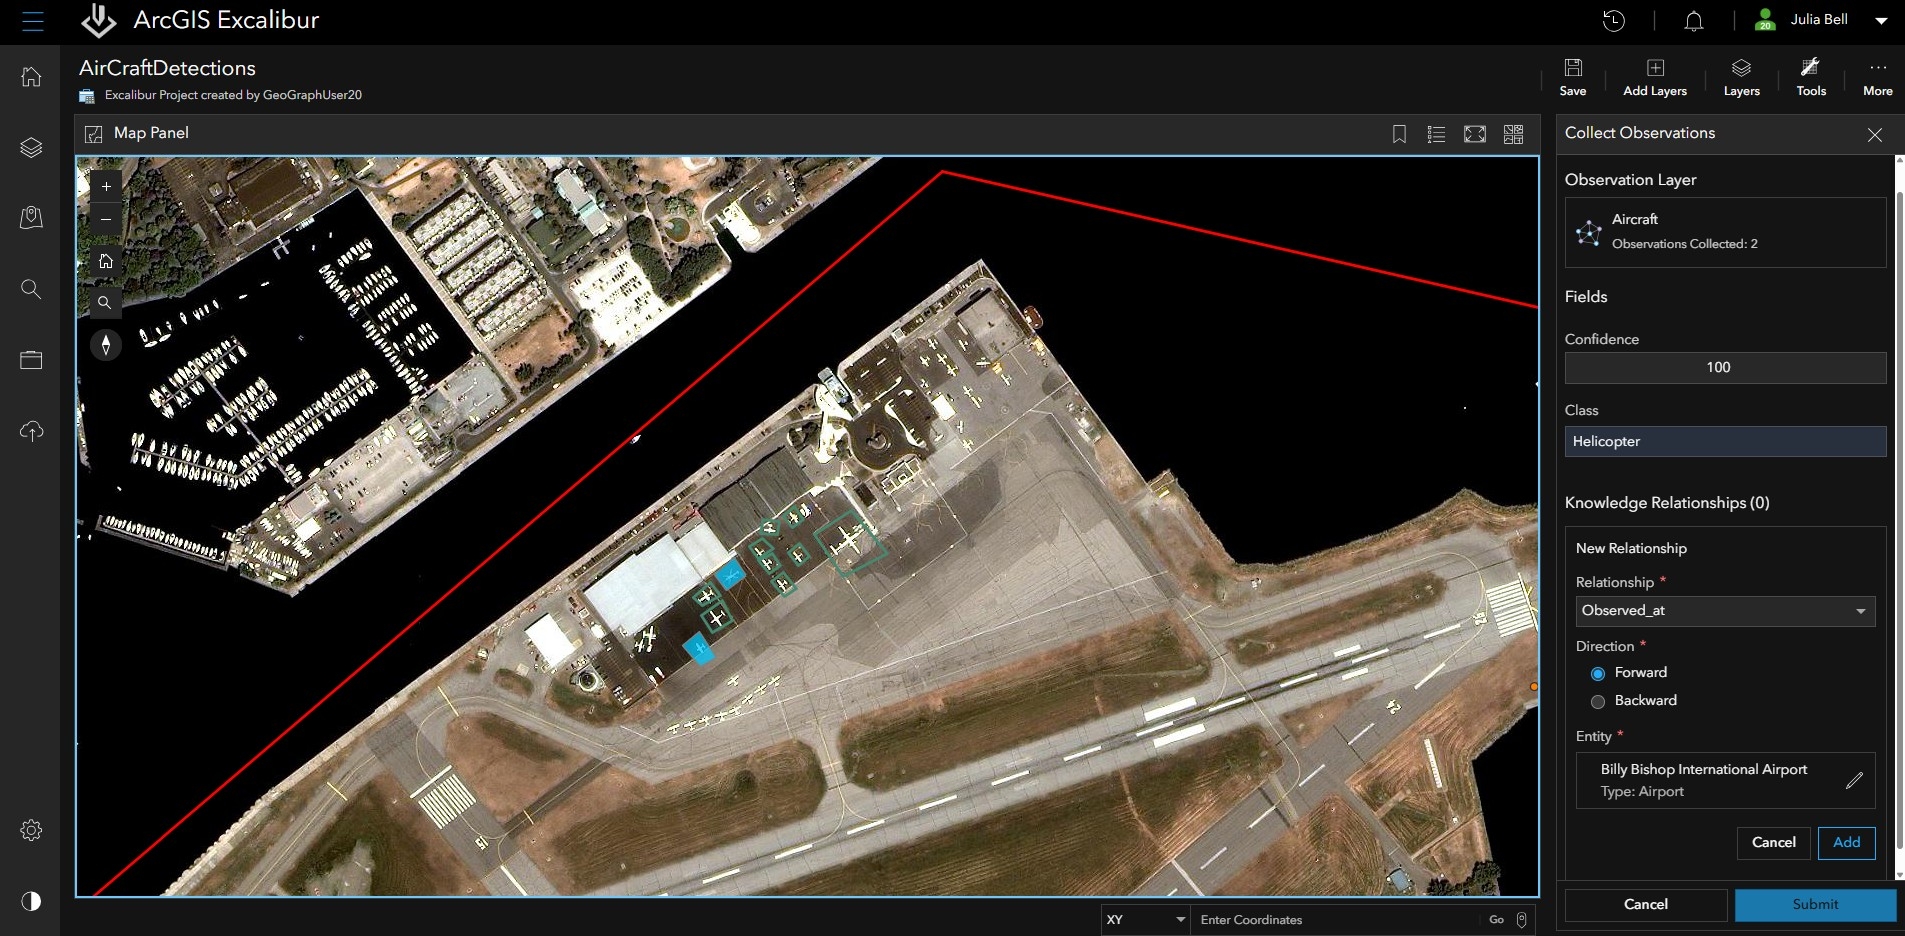
But how was this all configured for an analyst to easily leverage? Through the Excalibur project settings, users can manage their project by adding resources such as their source imagery and their authoritative observation layers to include graph layers, where spatial entities are automatically included as individual observation layers.
When all updates are made, the project can be opened where the newly added observation layers (Airports and Aircrafts) derived from the knowledge graph appear in the map’s layer pane. Existing spatial entities from those graph layers are automatically displayed on the map, allowing users to immediately visualize features such as the red polygon outline of the Billy Bishop Toronto City Airport, which was the area of interest for the collections.
COLLECTING OBSERVATIONS
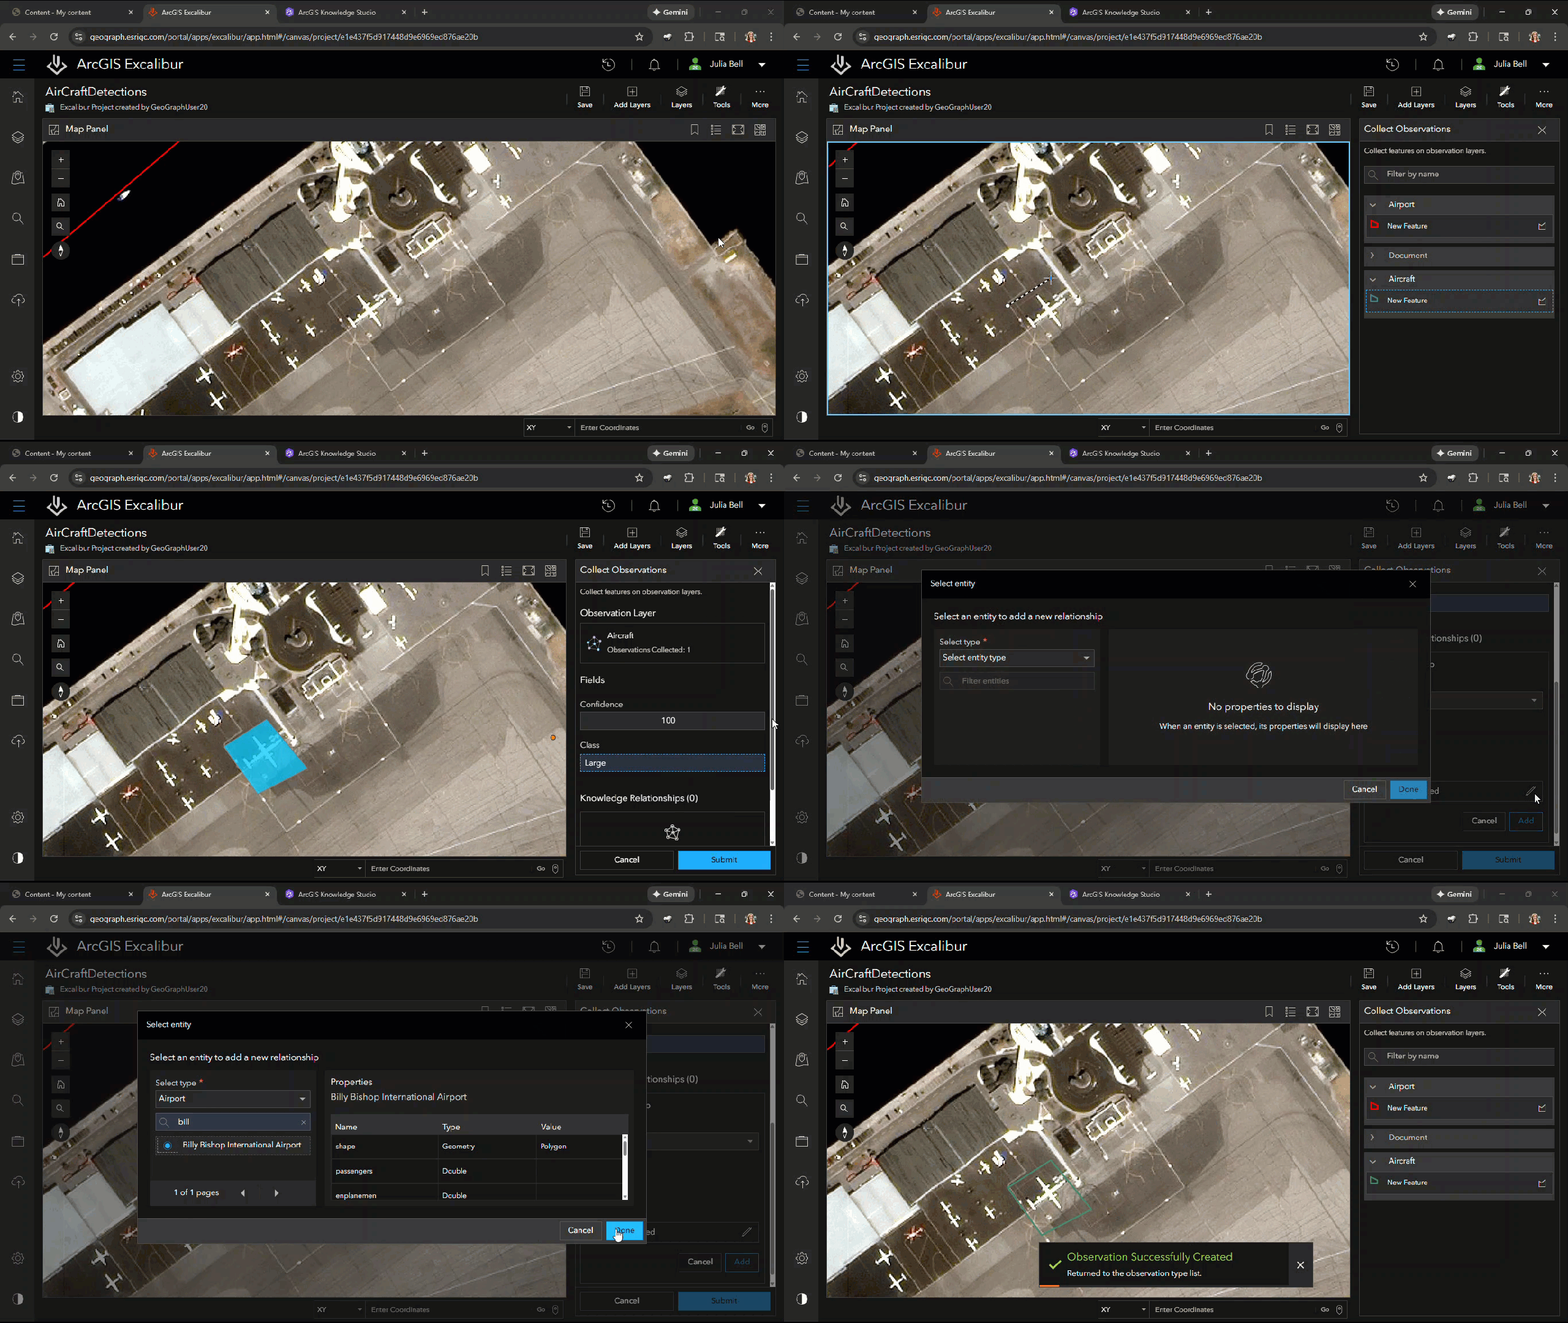
Once the graph observation layers are added to the map, analysts can begin to collect new observations for any observed aircraft which will display on the map and be written directly to the knowledge graph for use in additional analysis.
Collecting observations leverages a focused set of project tools to create and enrich entities directly from the source imagery. Using the Collect Observations tool allows analysts to select and focus on a specific layer that is centered around their workflow task, such as the Aircrafts layer. Observations are then created by drawing directly on the image where aircraft is observed, after which relevant attributes or properties (such as Confidence Level and Classification) are captured for the new entity.
During this process, analysts can also define the relationships that connect the observation to other existing entities in the knowledge graph. In this workflow, an Observed_at relationship was created, linking the aircraft just collected to the airport where it was observed. Adding relationships enables analysts to capture more than just attribute information, but also meaningful connections to other data within our organization.
VIEW COLLECTIONS IN KNOWLEDGE STUDIO
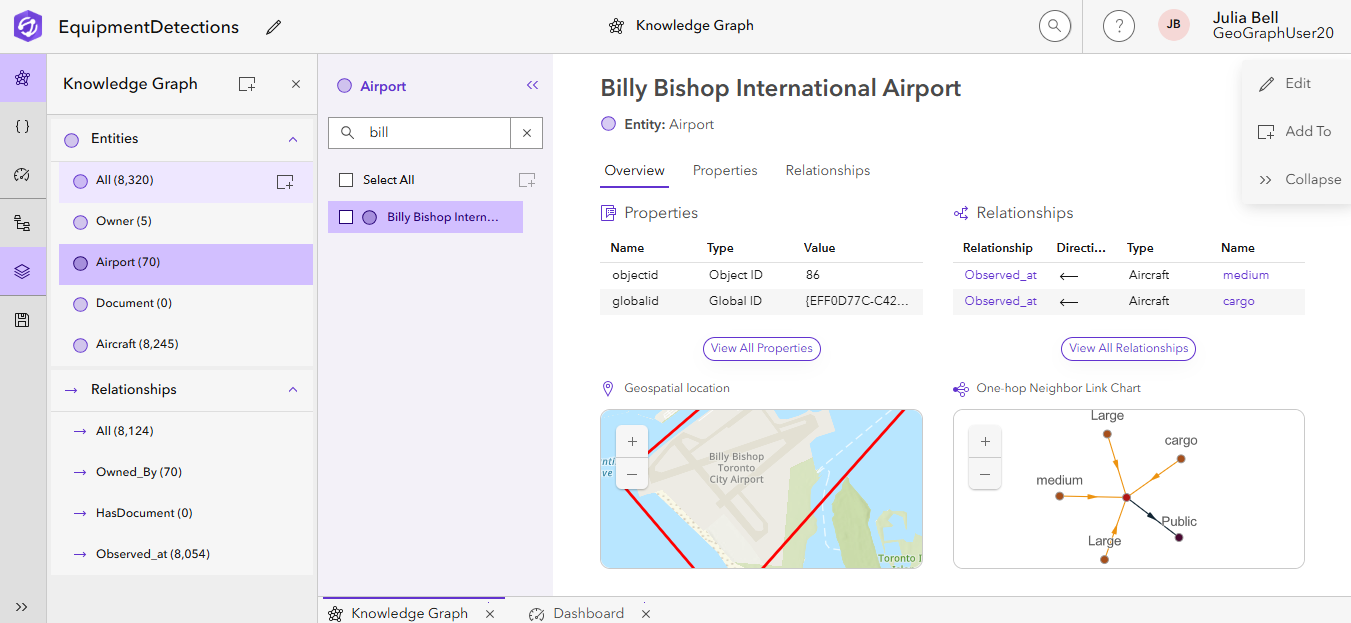
Analysts can explore observation entities and relationships and how they fit in the context of the existing graph by opening and exploring their graph in Knowledge Studio, a web-based application for working with knowledge graphs.
With the new workflow and integration of ArcGIS Excalibur and knowledge graphs, analysts can now select any existing spatial entity observation of interest and, through the pop-up, view it in Knowledge Studio. This automatically opens the Knowledge Studio, centered directly on the entity observation of interest.
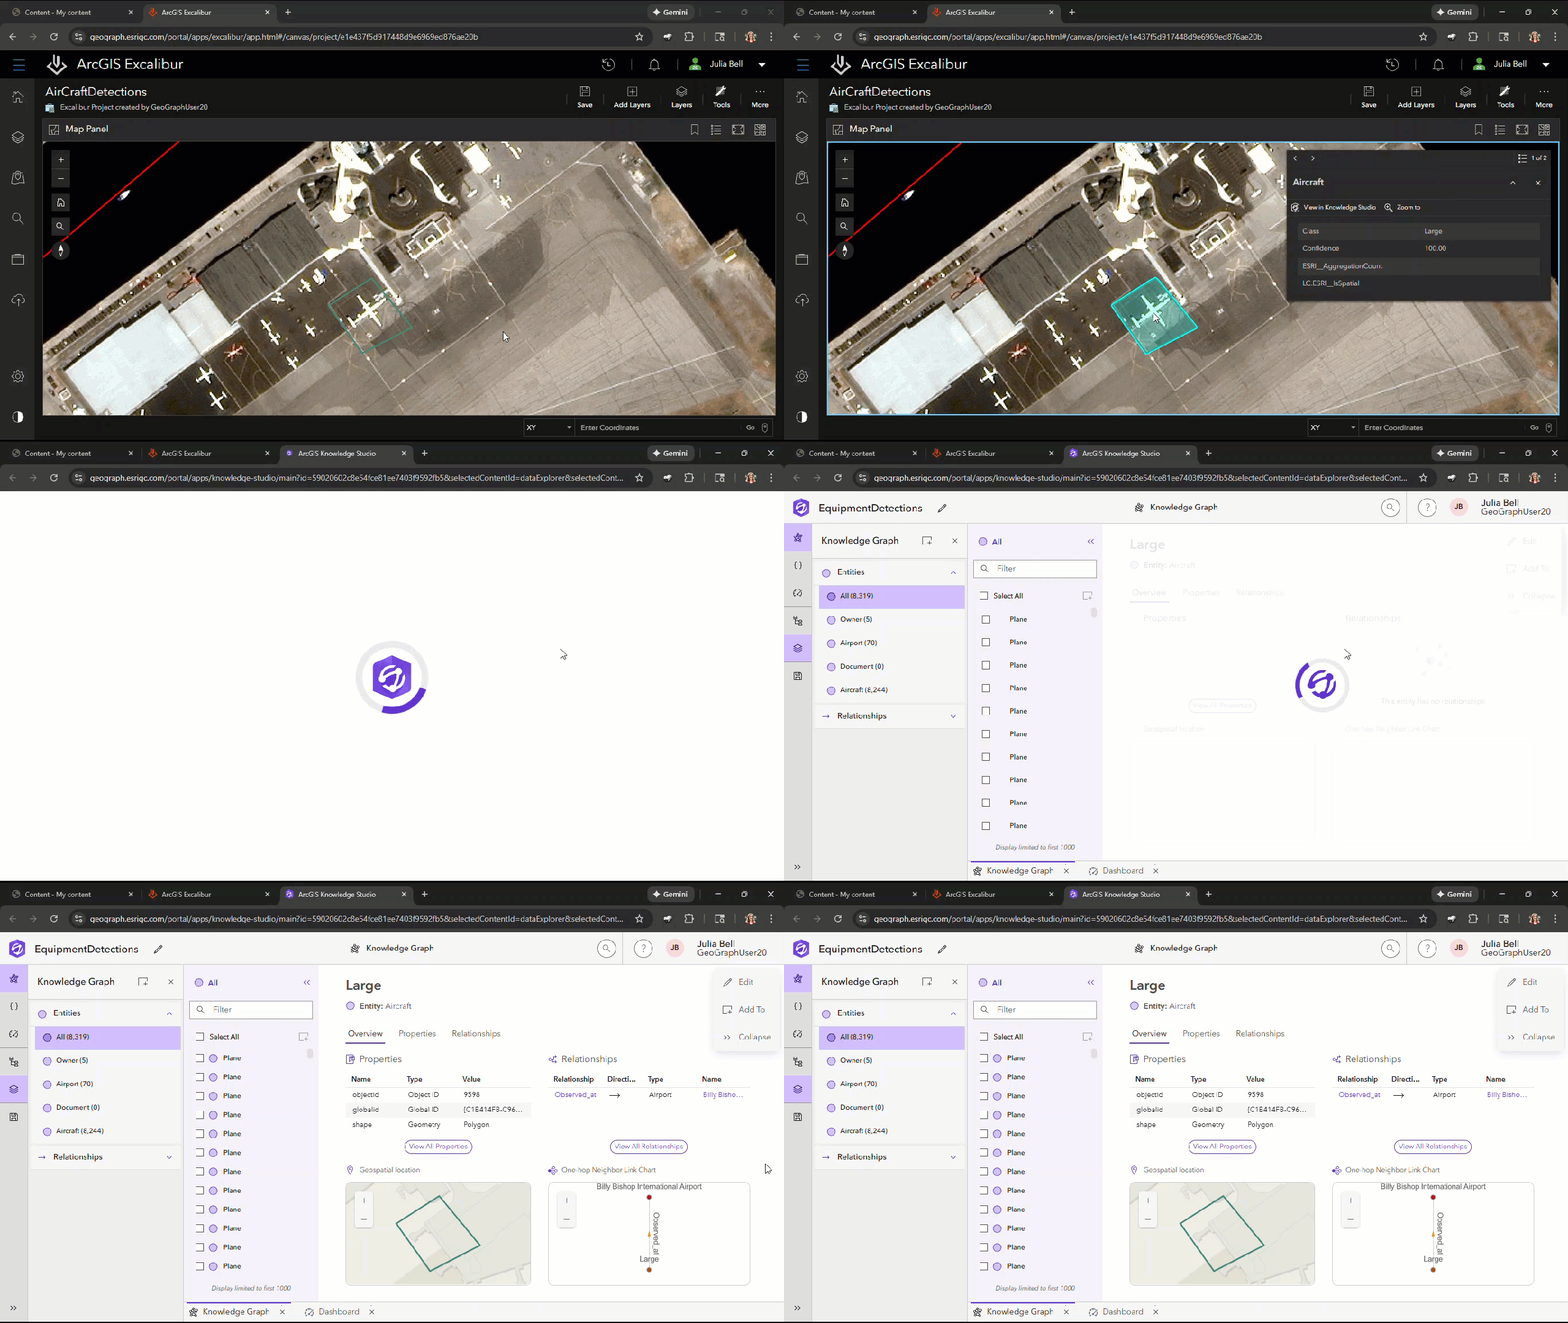
In Knowledge Studio, analysts can see the properties and relationships associated with the entity of interest, such as an aircraft observation, as well as the geospatial location of the collection. Analysts can then further explore and interrogate their data in an interconnected system.
Unlocking the Full Potential of Imagery for Downstream Analysis
Collecting observations in ArcGIS Excalibur allows users to streamline the imagery collections process and more easily contribute to the larger system of record. The integration with ArcGIS Knowledge gives users a more efficient way to capture observation entities and manage complex relationships.
By enabling users to create entities and relationships from imagery, directly at the web tier, this feature simplifies the data creation process and makes powerful data and workflows accessible to more analysts than ever before. This integration allows for intelligence to be presented to the operations community, entirely in the web, in a conducive way that promotes rapid decision making.

Article Discussion: