The June 2025 release for ArcGIS Experience Builder in ArcGIS Online introduces many new features to help you easily build web apps you envision.
We’ve added support for Arcade expressions. You can use Arcade to add data and display advanced dynamic content and styling. We’ve also introduced three new widgets—Document Explorer, Document Viewer, and Link Explorer—that connect to Autodesk Construction Cloud (ACC). Additionally, the new Display Order widget defines the rules for mosaicking and displaying overlapping images from an image layer. Other highly anticipated enhancements include batch attribute editing in the Edit widget, the ability to export data to more file types including Shapefiles, File Geodatabases, and KML files, and support for restoring the app state. Let’s dive into these new features.
Quick links:
- Arcade expressions
- Restore app state
- Widgets work with Autodesk Construction Cloud (ACC)
- Display Order widget
- Enhancements
- Accessibility update
- Emergency Response Guide (ERG) web tool

Arcade expressions
Many of you have expressed interest in advanced formatting with Arcade expressions in Experience Builder. We are excited to announce that you can now utilize Arcade to create sophisticated dynamic content and styling. You can also use Arcade to add data to your apps.
Advanced formatting
Advanced formatting includes advanced dynamic content and dynamic styling.

Rather than configuring content directly using fields or statistics, you can now use Arcade expressions to calculate values based on data and display them as dynamic content in text, dynamic URL for image sources, or links defined by URL.

There are two dynamic styling options- Condition and Script. The former is for applying simple rules without coding, and the latter enables you to create complex and flexible style logic using Arcade. Currently, you can set dynamic style in Text, Button, and List widgets.
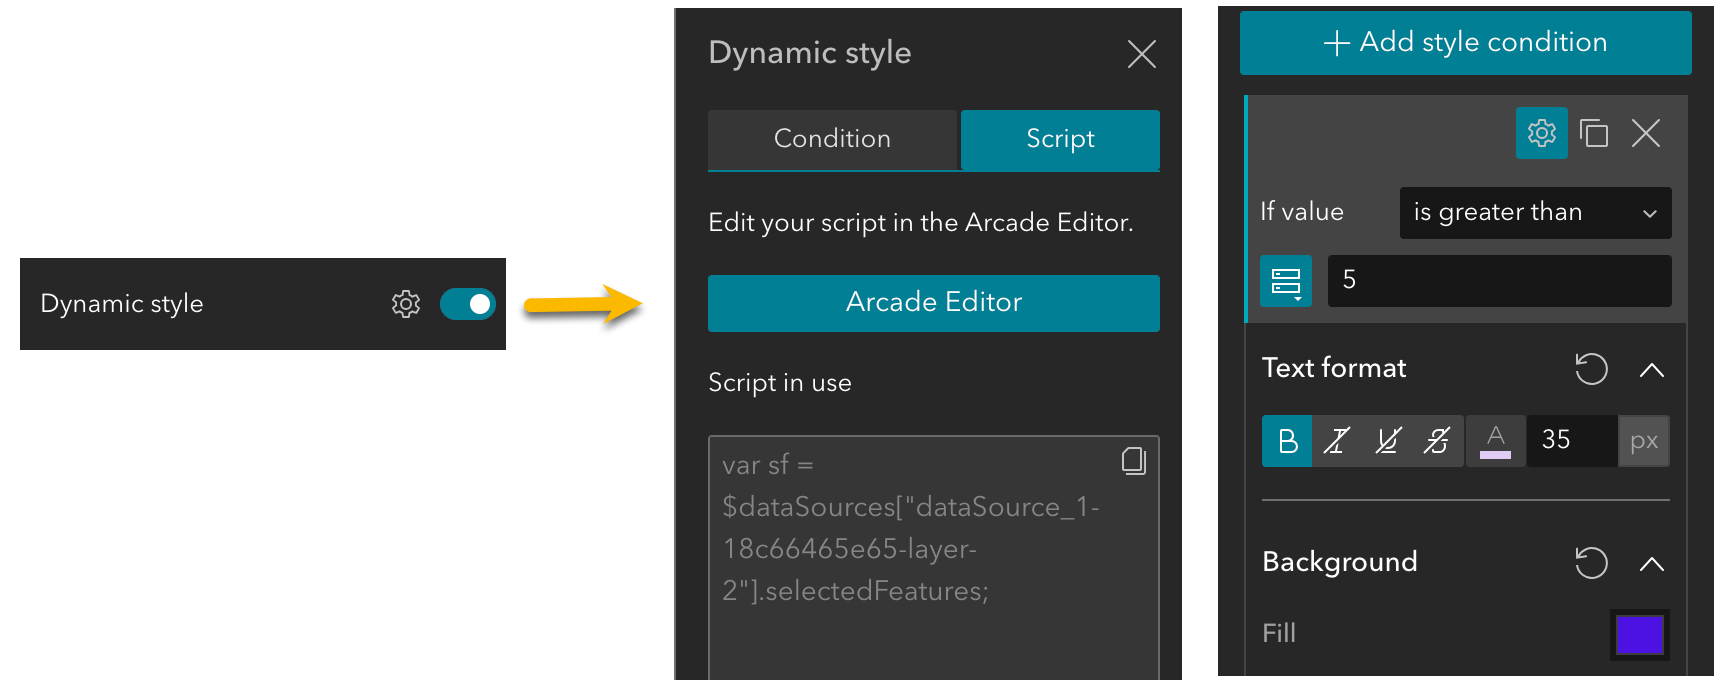
Add data with Arcade
Arcade expressions serve as powerful tools for enhancing and modifying data without making direct changes to the original data source. They allow you to extract information from data layers that you do not own, such as the World Cities layer available on ArcGIS Online as shown in the screenshots below. With this example script, we generate a data layer that includes only the features where the POP_RANK field value is equal to 7, along with three fields – CITY_NAME, POP_RANK, and POP_CLASS – from the original layer.

The resulting data can then be utilized like any other layer, and in this instance, we add it into a Table widget to display the field attributes. For more information, see Add data with Arcade in the Manage data documentation.


Restore app state
Like you could with Web AppBuilder, you can now restore an Experience Builder app to its previous state which includes layer visibility and the map extent when reopening the app. This feature enhances user efficiency, especially when working with numerous layers on the map. In Experience Builder, app state information includes the currently open page, view, or window, the map viewpoint, and layer visibility. This information is stored in the browser cache. When the Experience state setting is activated in the builder, the Restore experience state banner will appear when you launch the app and will automatically disappear after 10 seconds.


Widgets connect to Autodesk Construction Cloud
To improve the integration of architecture, engineering, and construction (AEC) data from Autodesk Construction Cloud (ACC), we have introduced three new widgets.
- Document Viewer: View and interact with linked 3D models and 2D documents.
- Link Explorer: Explore all project data linked to features in web maps or scenes.
- Document Explorer: Easily explore a folder tree of all project documents and data.
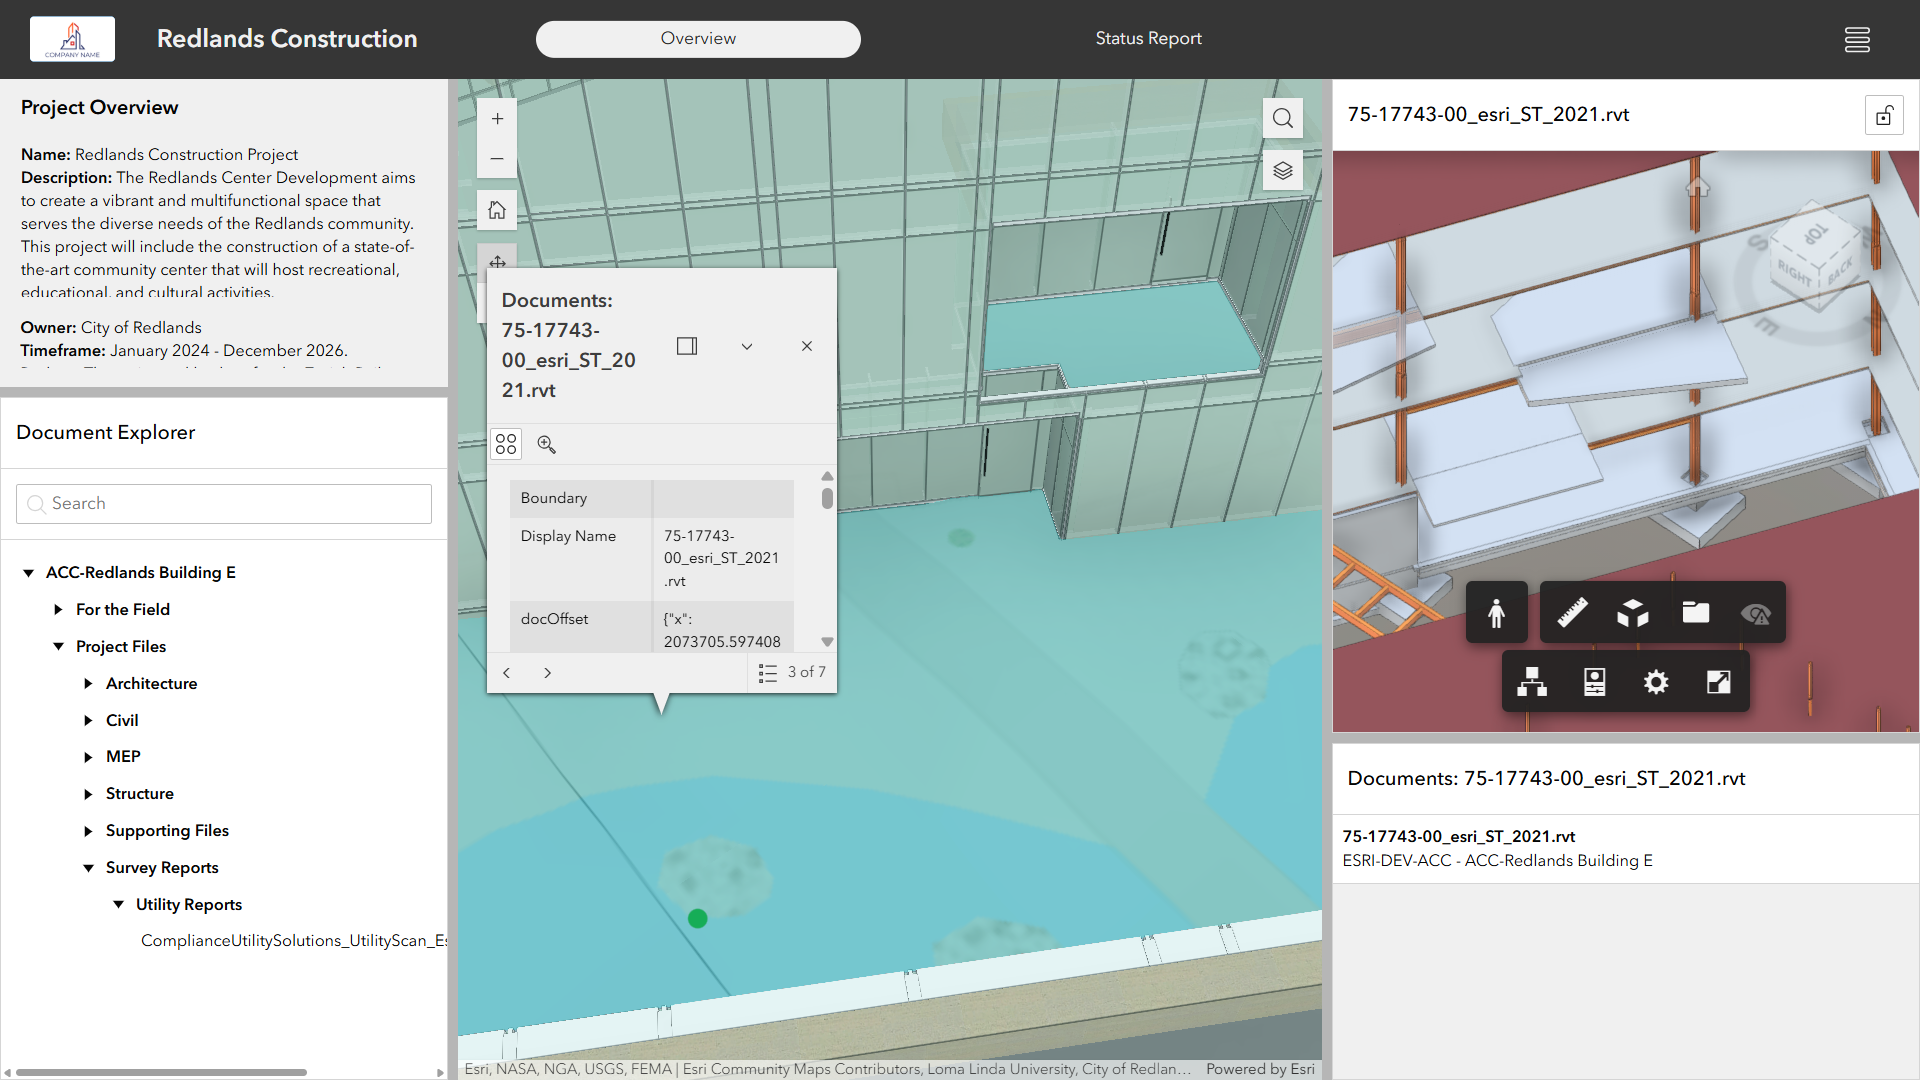
These widgets seamlessly incorporate the ArcGIS GeoBIM experience into the builder environment, enabling you to create web apps tailored to your needs for exploring BIM models, CAD drawings, and associated documents. For more information, see the blog post.

Display Order widget
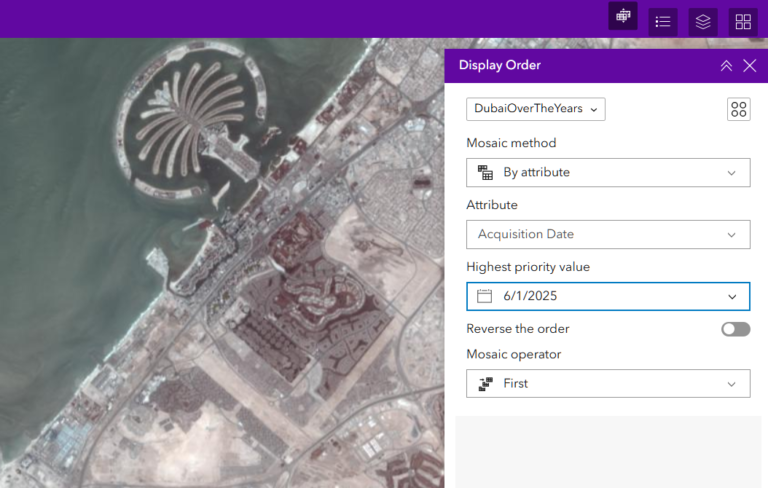
The Display Order widget sets the display order for overlapping images within an imagery layer. This widget works with imagery layers that originate from Image Server or are dynamic image collection imagery layers. Using this widget, you can modify the display order of any overlapping input images.

Enhancements
Edit widget
With the new Batch editing option, you can perform bulk update of attributes by selecting multiple features from a layer on the map. This feature is commonly utilized for asset management.
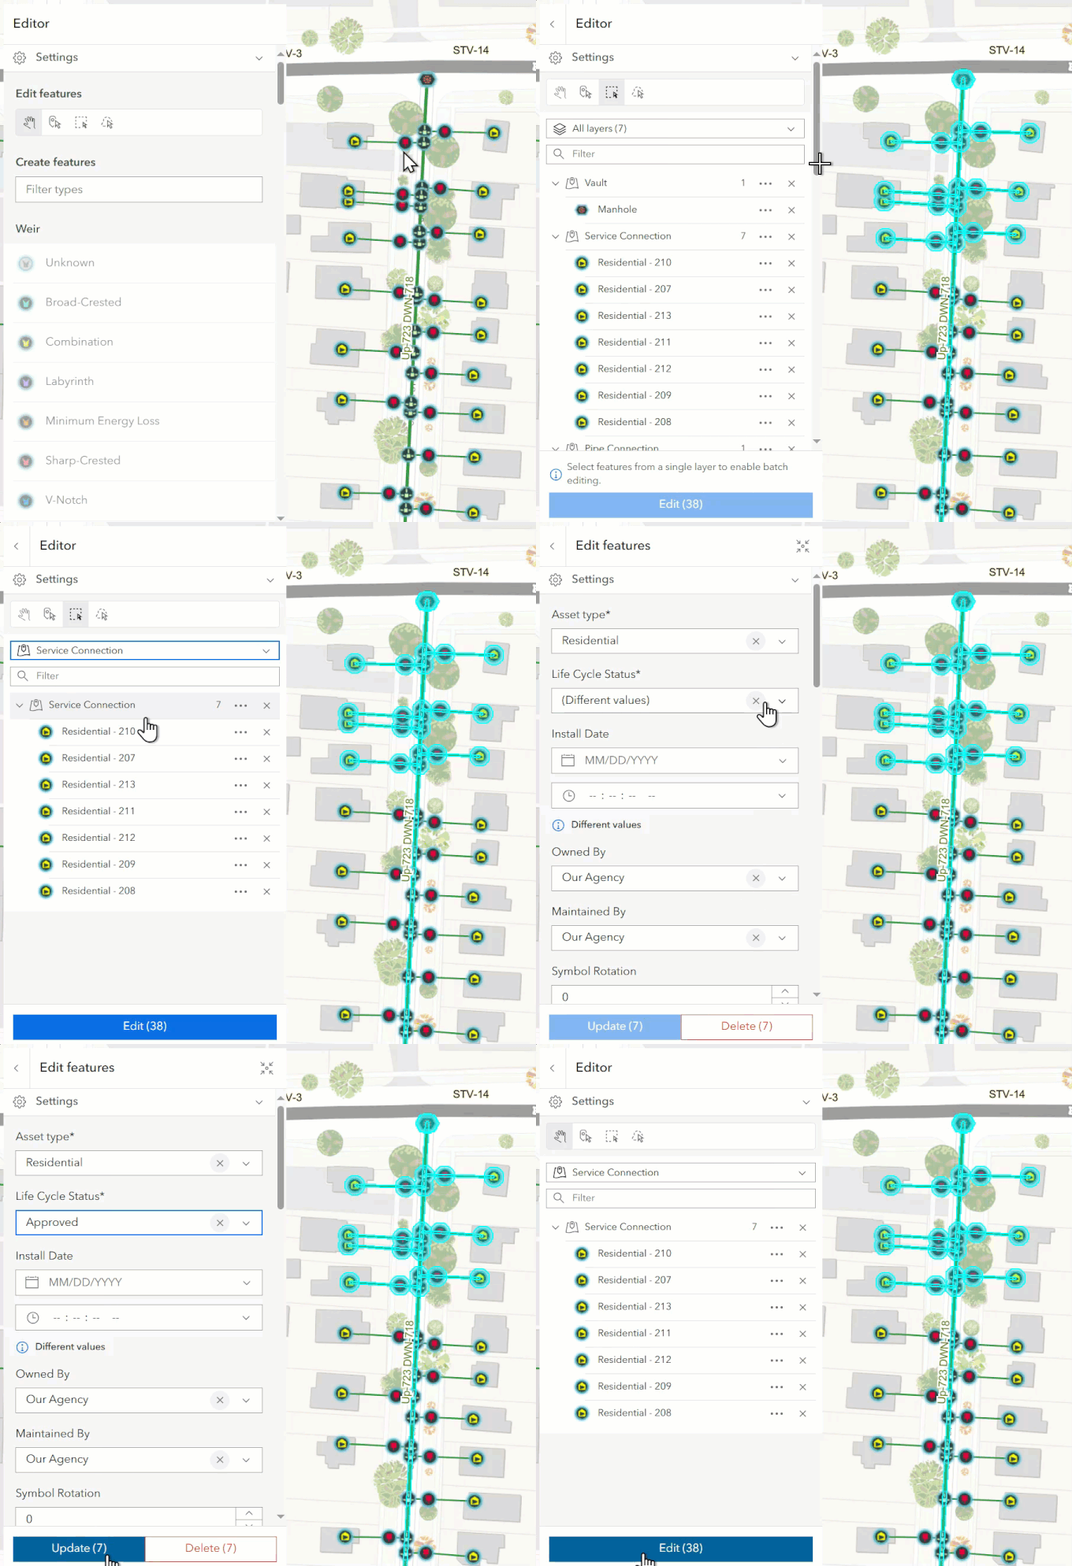
Please be aware that this functionality is currently not available in the Attribute Only mode, but it is planned for inclusion in a future release. Furthermore, there are limits on the maximum number of features you can select and edit at a time. For more information, see the Edit widget documentation.
Export to more formats
You can now export data to Shapefile, File Geodatabase (FGDB), and KML.
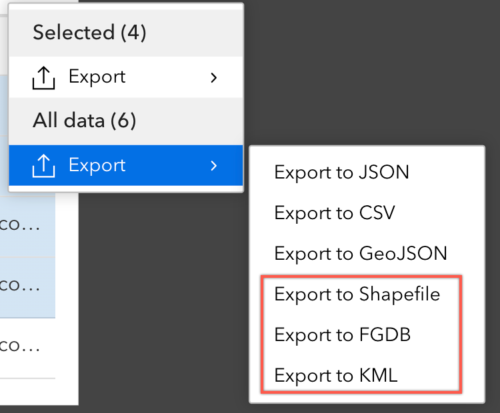
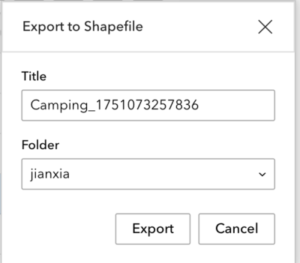
Please be aware that when you export all data to these formats, files will be downloaded directly to your computer. However, if you are exporting selected data, you need to have a user type that grants you the privileges to create content. This process first involves creating an item in your ArcGIS account as shown below, followed by downloading the files to your computer. There is no credit consumption. For more information, see Export settings.
Map Layers widget
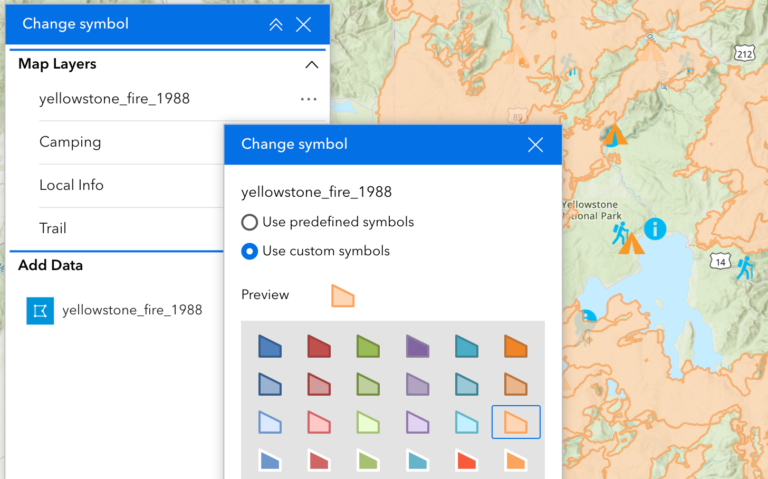
At times, the default colors for layers added dynamically through widgets like Add Data, Query, Analysis, and others may blend into the map, making it challenging to differentiate them from other layers. By enabling the following option in the Map Layers widget settings, you can change symbols for these run time layers by selecting Use custom symbols.

Legend widget
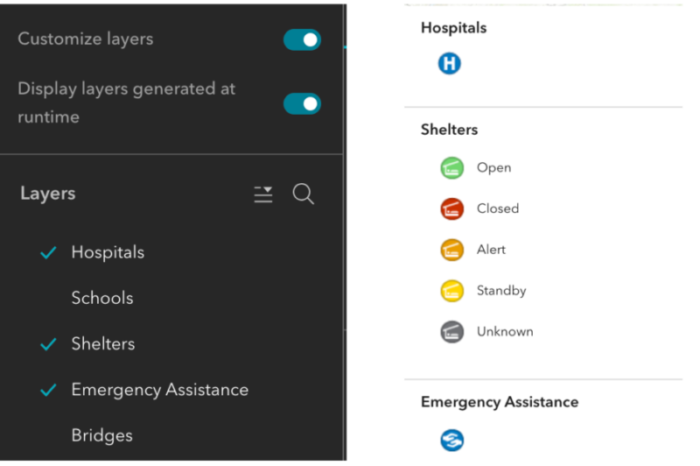
When a map contains numerous layers, including all of them in the legend can become overwhelming. You now have the option to choose which layers appear in the legend, allowing for a more user-friendly experience.
Draw widget
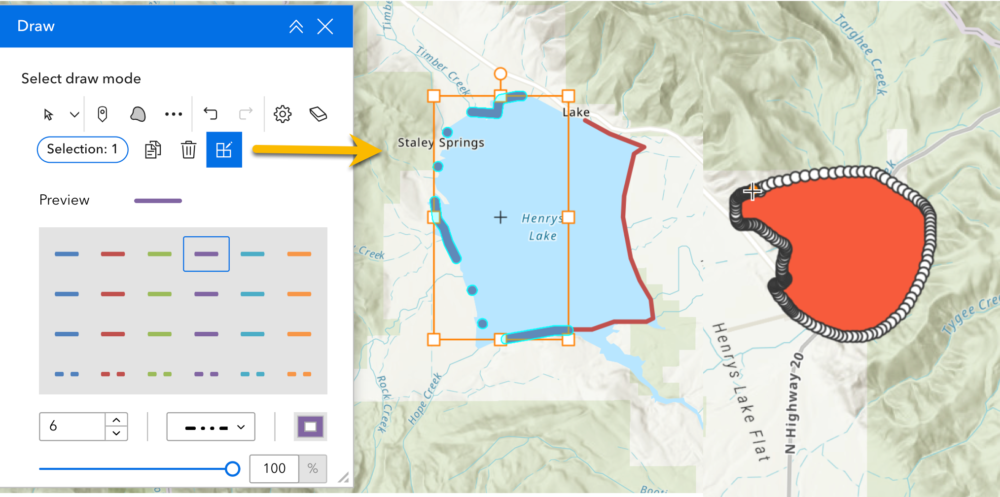
You can use the freehand tools to draw polylines and polygons on the map. You can also adjust the symbology of previously drawn graphics by changing their color, size, or style.
Near Me widget
Several exiting enhancements have been made to the Near Me widget. These include the activation of a default drawing tool, the ability to display multiple field values as the feature title, and the inclusion of additional elements such as the map legend and attribution in PDF reports. For more information, see the blog post.
Directions widget
Like you could with Web AppBuilder, you can configure default barrier layers in the widget settings to offer routing information for road closure maps. You also have the option to set default starting and ending points.
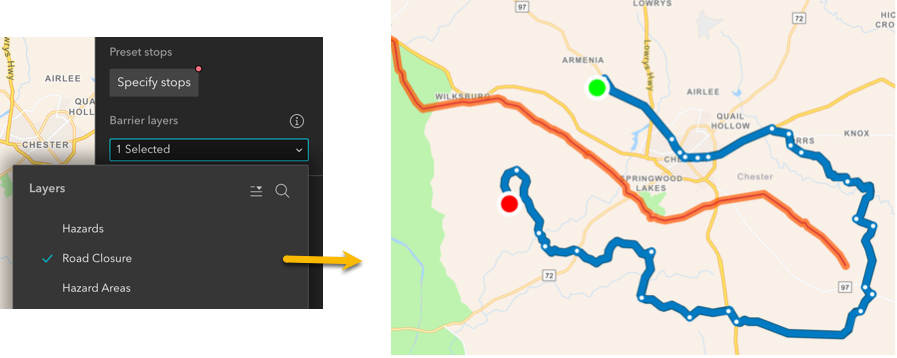
Furthermore, you can toggle off the Save button in the widget settings, as most users typically do not require the ability to save the route.

Table widget
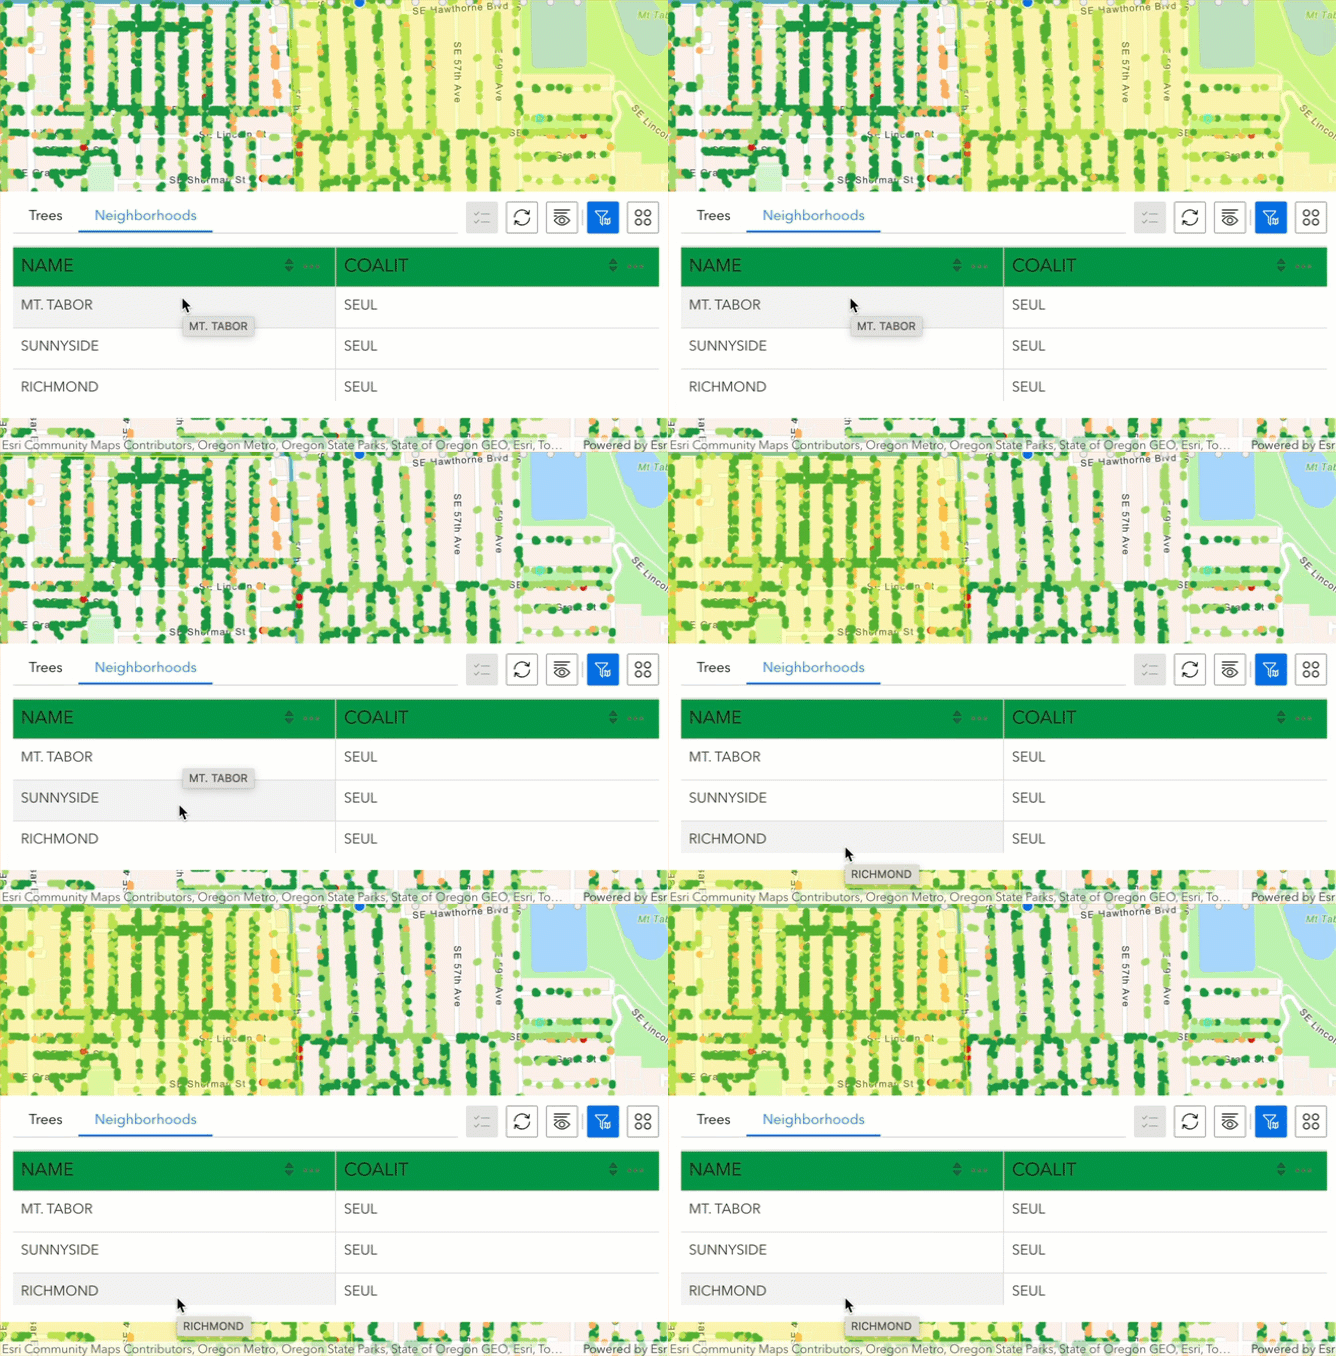
You can view related data in a table directly within Experience Builder, just as you can with the attribute table in Map Viewer,

Additionally, when you hover over a row in the table, the corresponding feature on the map is highlighted in yellow on the map.
Floor Filter widget
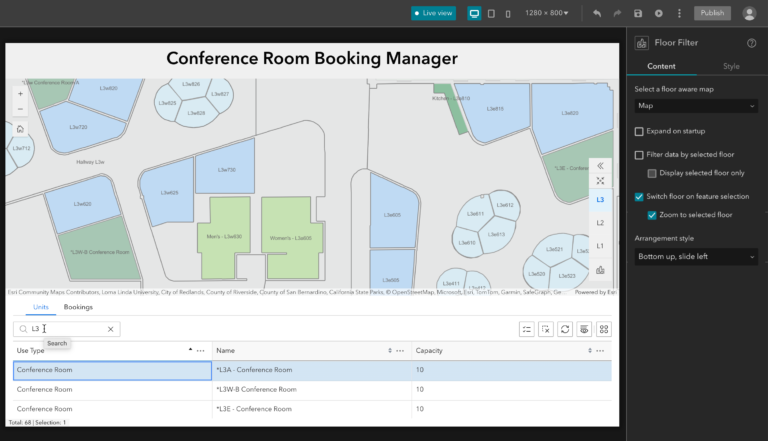
The Floor Filter widget has been improved to not only filter the data shown on the map but also filter data in other widgets such as Table, Search, and Chart. It now includes two new options:Filter data by selected floor and Set floor based on selection. For instance, when you choose a specific floor of a building in the Floor Filter widget, the Chart widget can be updated to display data relevant to that selected floor.
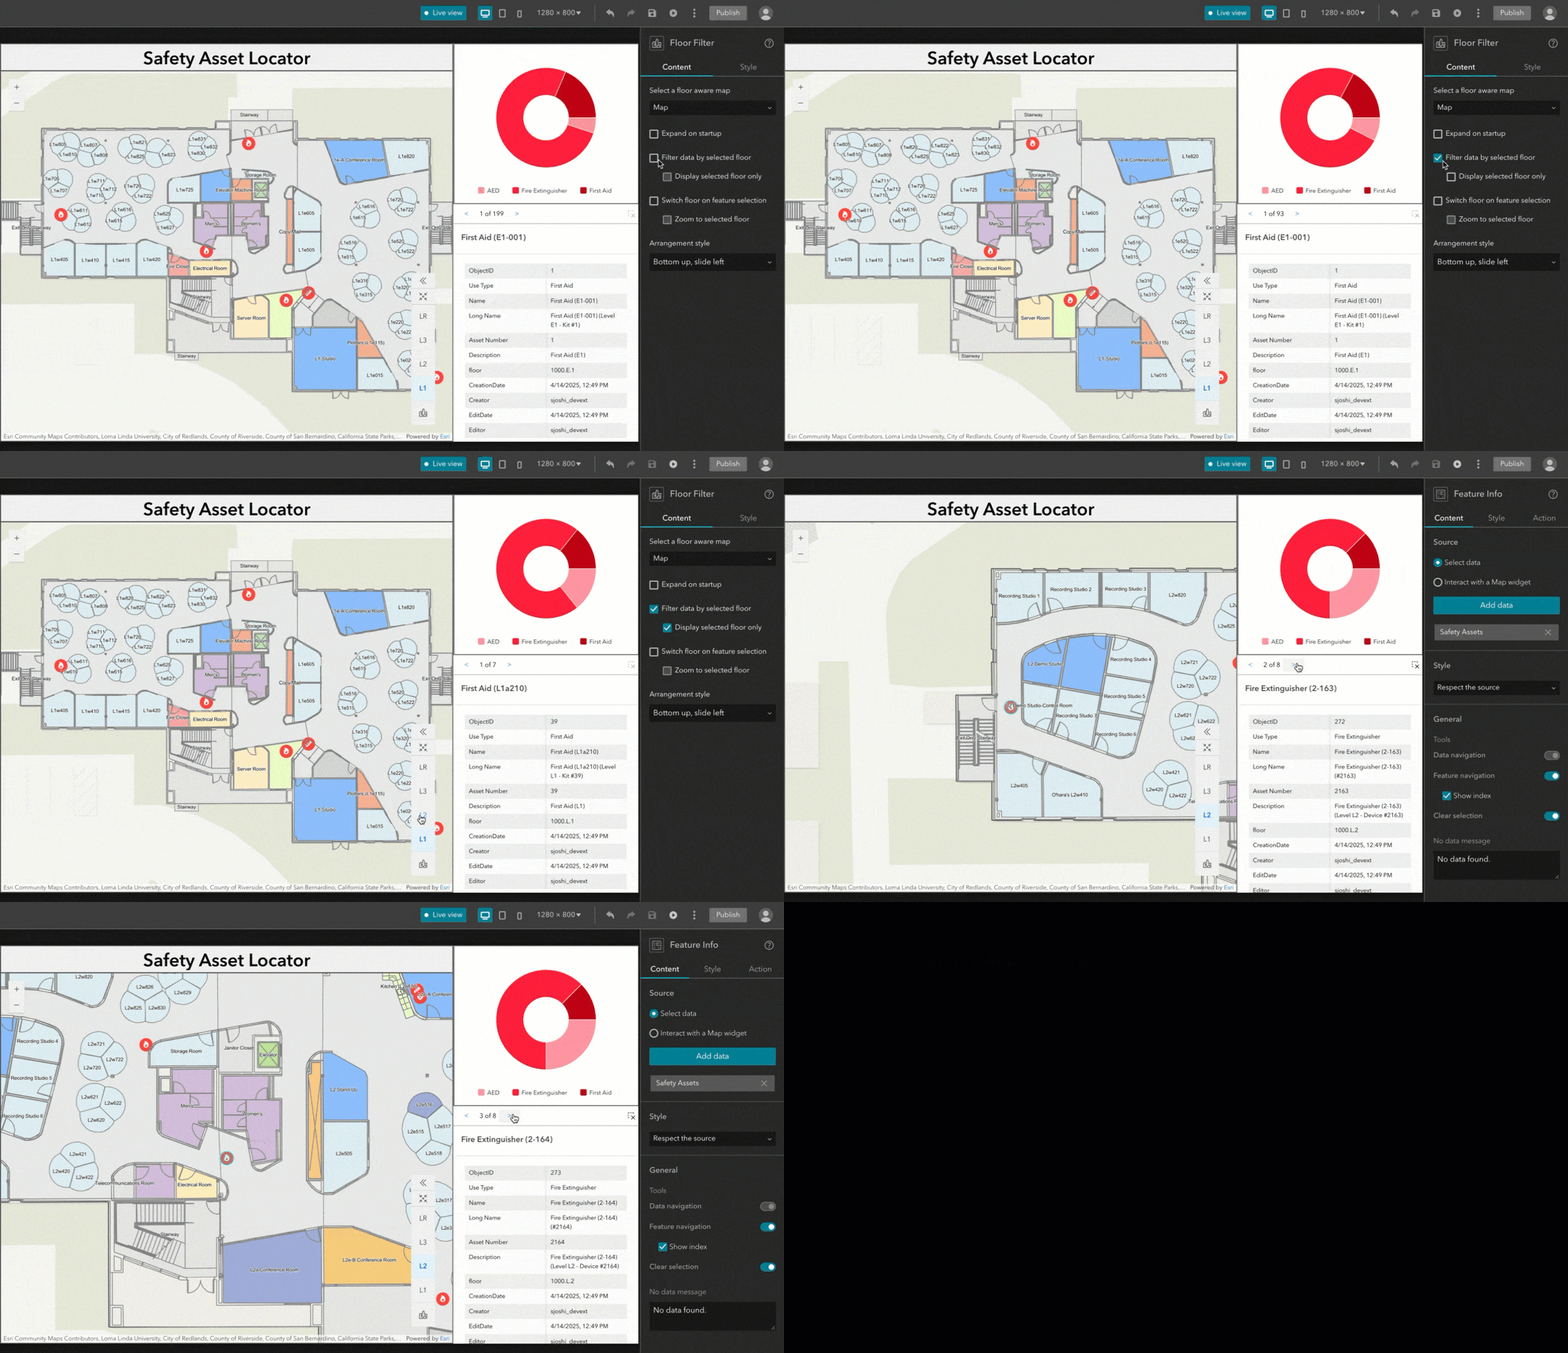
Additionally, with the Set floor based on selection option, selecting a record in the Table widget will make the map switch to the corresponding floor of that record and zoom to the feature. For more information, see the blog post.
Feature Report widget
You can now generate reports from feature layers, even when they are not associated with an ArcGIS Survey123 survey. To authorize the report, you must either be the owner of the feature layer or hold an administrator role within the organization.

Image widget
The new Image viewer option enables you to open a large version of the image. If a feature has multiple image attachments, you can easily cycle through them.

Add Data widget
When uploading a file, any layer symbology from the file is preserved when you add data to the map. Additionally, you can use the Data type restriction drop-down menu in the widget settings to limit which types of data can be added. In the example below, only three types of data are allowed.

Marker URL parameter
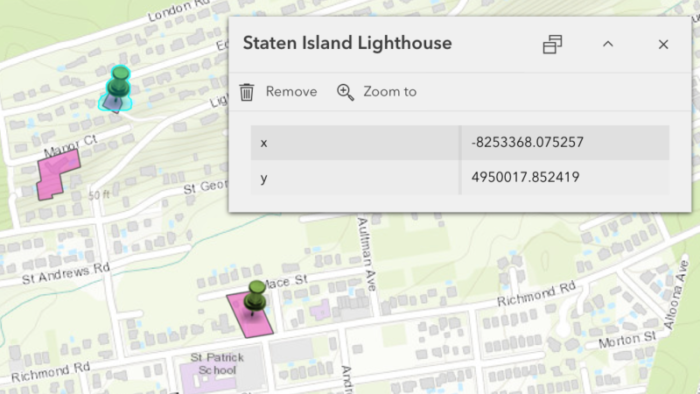
You can use the marker:<x><y> URL parameter to place a marker on the map. Furthermore, you can add multiple markers with different properties in JSON format within the URL. For more information, see Add a marker to the map.
Additionally, markers can be added to a map using the Add marker data action.
Open view message action
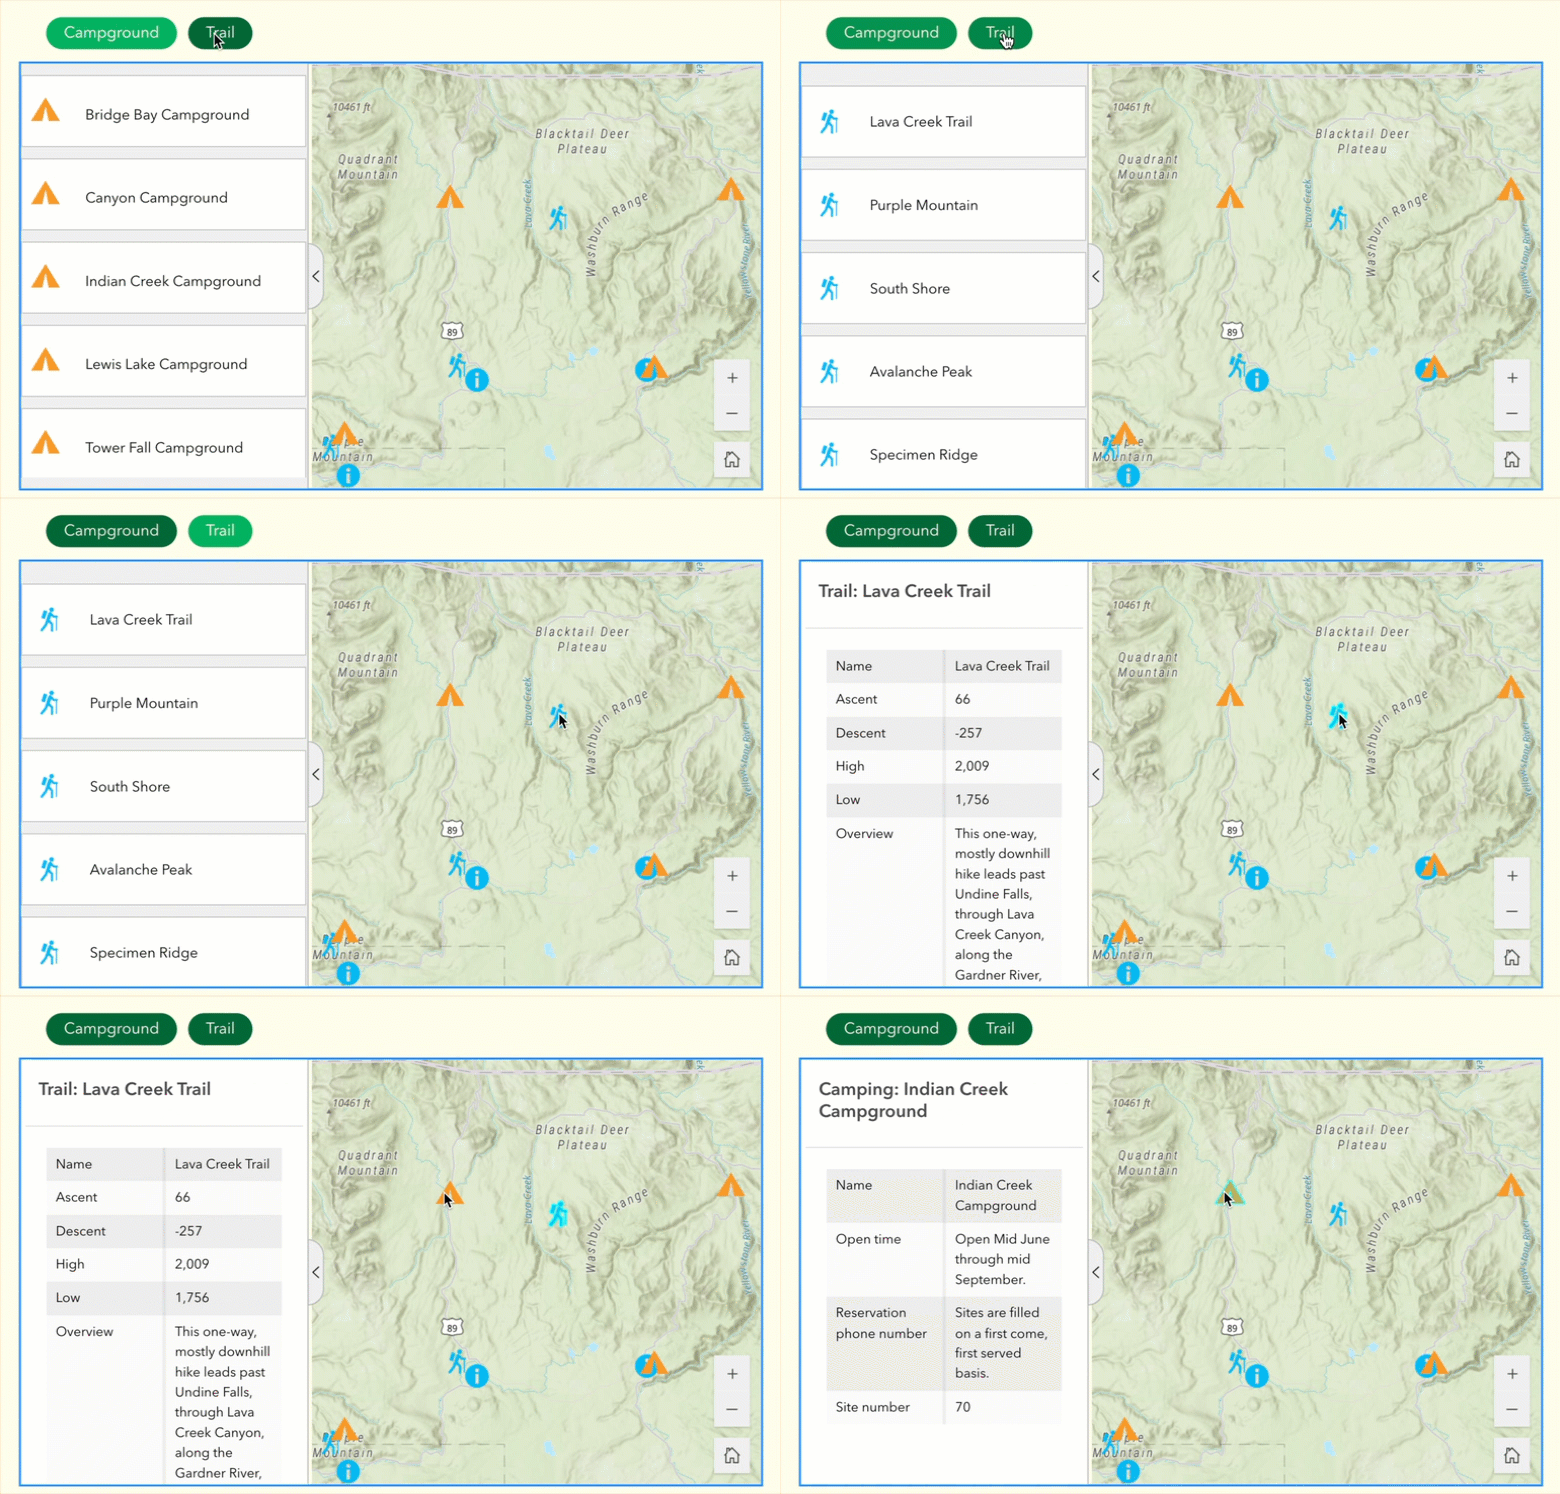
A Section widget may contain multiple views. There are instances when you may want to select a feature on the map and view its information within a specific view. This can now be accomplished using the Open view action, which is activated when the Record selection changes message is triggered.

Copy data source ID
Data source IDs are necessary for performing data related tasks with URL parameters, such as filtering data from a layer. You can now conveniently copy them by clicking the ID button in the Data pane.


Accessibility update
We have been enhancing accessibility through incremental releases. The following features are improved in this release:
- Seven additional widgets now support accessibility features including Add Data, Feature Info, Feature Report, Flow Row, Measurement, Select, and Sidebar.
- The Print widget’s Compact mode supports accessibility features.
- You can use the Shift+Space keys to select rows in a Table widget.
- Four more default templates have been optimized for accessibility: Gallery, General, Skyline, and Summary.
The Job Hunting (A11Y) public template in ArcGIS Online is designed to showcase accessible experience with keyboard interactions and labels for screen readers. For more information, see Accessibility.

Emergency Response Guide (ERG) web tool
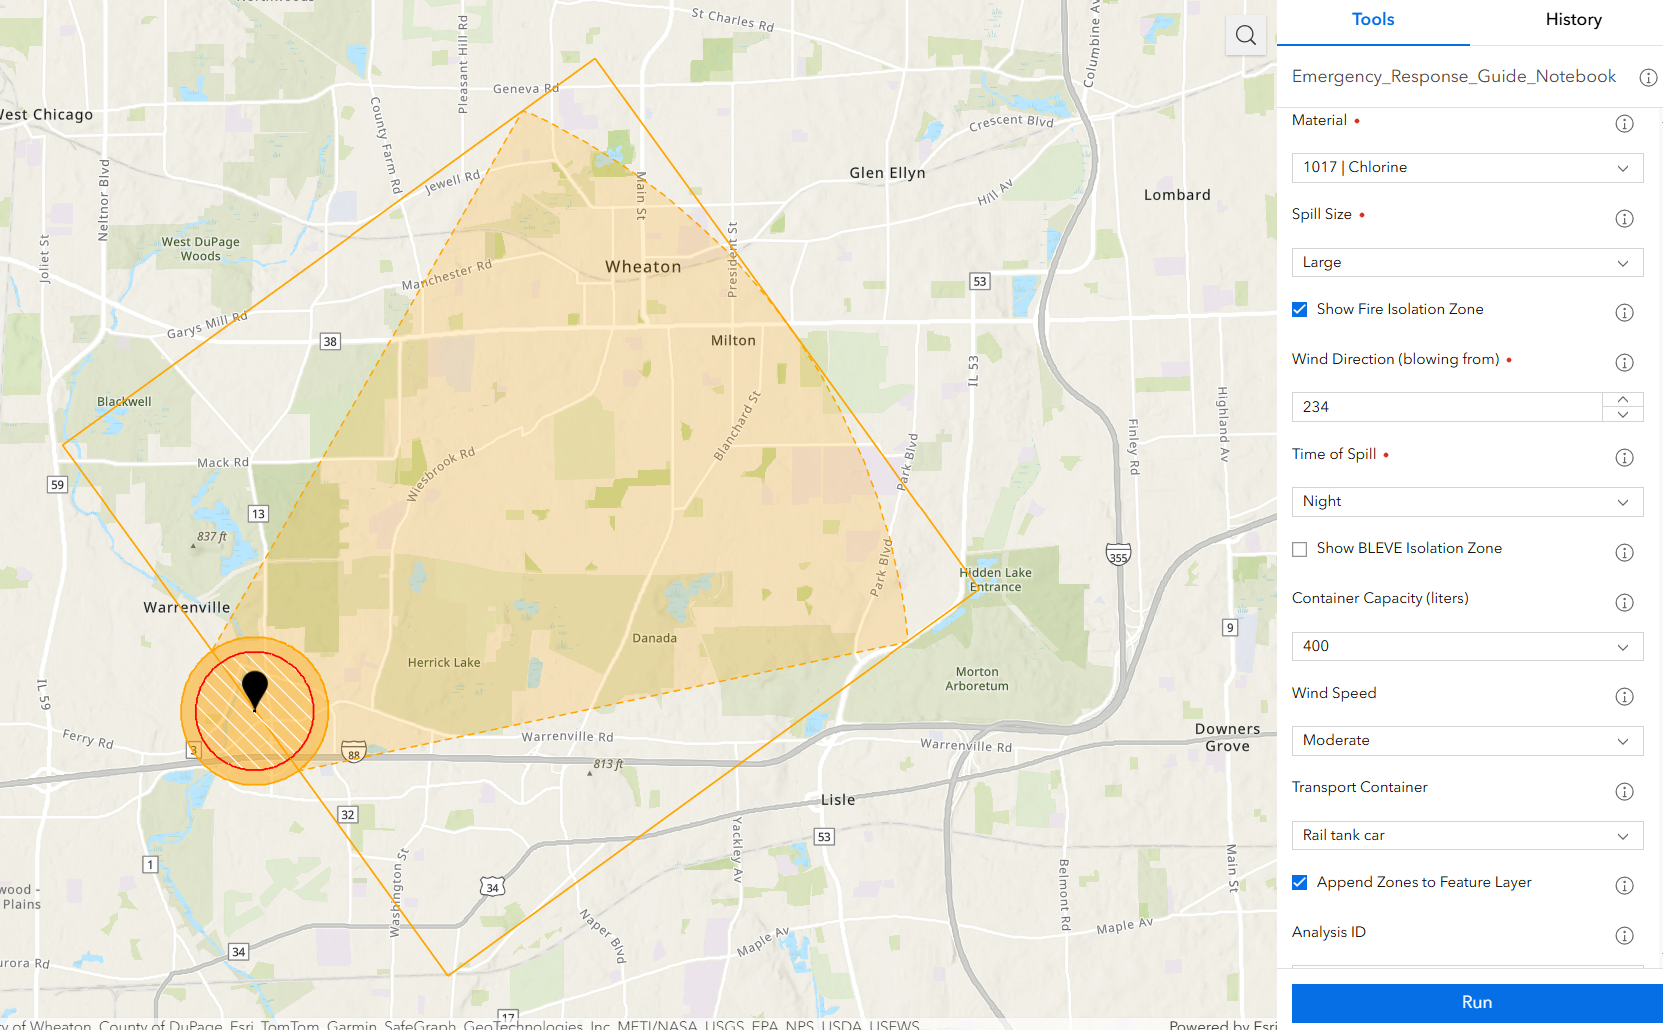
The Emergency Response Guide (ERG) web tool allows users to visualize and analyze hazardous material spills and can be operated through the Analysis widget. This tool offers the same functionality that was previously available through the Emergency Response Guide widget in ArcGIS Web AppBuilder. For more information about the tool, visit the ArcGIS Blog and Esri Community.
Identify equivalent widgets
In addition, a Python scrip tool for identifying equivalent widgets from Web AppBuilder to Experience Builder is available for download. It helps organizations make informed decisions on migration strategies. For more information, read this article.
Lastly, check out these two new best practice documents:
- Designing responsive layouts
- Best practices for using windows
For more information, see What’s new in Experience Builder. Please reach out to experiencebuilder@esri.com with questions.
Thank you,
The ArcGIS Experience Builder Team
The new 20 Essential Skills for ArcGIS Experience Builder book is coming July 29. Pre-order now. Copies will also be available for purchase at the 2025 Esri User Conference.
Subscribe to our newsletter to receive the latest ArcGIS Experience Builder updates, news, and content.


There are some great features in this update. In particular there are two things my users are going to love: Restore app state and the ability to Expand all layers by default in the Map layers widget.
Thanks to the team for continuing to improve Experience Builder!