The June release of ArcGIS Maps SDK for JavaScript brings advances across performance, visualization, interaction, 3D, and AI-assisted workflows – without breaking changes, so you can upgrade with confidence.
Parquet: optimized performance and new functionalities
Performance of Parquet Layer (beta) is further improved with support for Spatially Optimized Parquet files, which combine spatial clustering with a multiscale index to stream only the portions of a file needed for display. With the June release of ArcGIS Online, Spatially Optimized Parquet files can be authored with ArcGIS GeoAnalytics Engine or ArcGIS Data Pipelines, and parquet layer can be customized in Map Viewer. We also improved the performance for querying parquet layers, added supports for filtering data directly with definition expression, added advanced querying options, and more.

With these new updates, Parquet, the open-source columnar file format designed for efficient storage and analytics of large tabular datasets, becomes an important part of the big data workflow in Web GIS. Parquet Layer is best suited for large, read-only datasets where scalability, efficient storage, and high-performance visualization are critical, offering a strong alternative to vector tile layers by preserving continuous feature geometries. Feature layers remain the recommended choice for operational and typical-sized datasets.
Advanced ArcGIS Pro symbology in web
Scale-based rendering with alternate symbols: Use the new alternateSymbols property to specify an array of CIM symbols to achieve scale-based rendering in unique value renderer and class breaks renderer. When the view is zoomed beyond the symbol’s defined scales, the renderer will automatically use the next symbol in the alternate symbols array that meets the scale criteria. Scale-based rendering makes it efficient to visualize large datasets at smaller scales, saving the effort to create multiple renderers with different scale dependencies.
Control drawing order with symbol layer drawing options: Feature Layer now supports symbol layer drawing, allowing developers to override the default drawing order of CIM symbols in a 2D map.
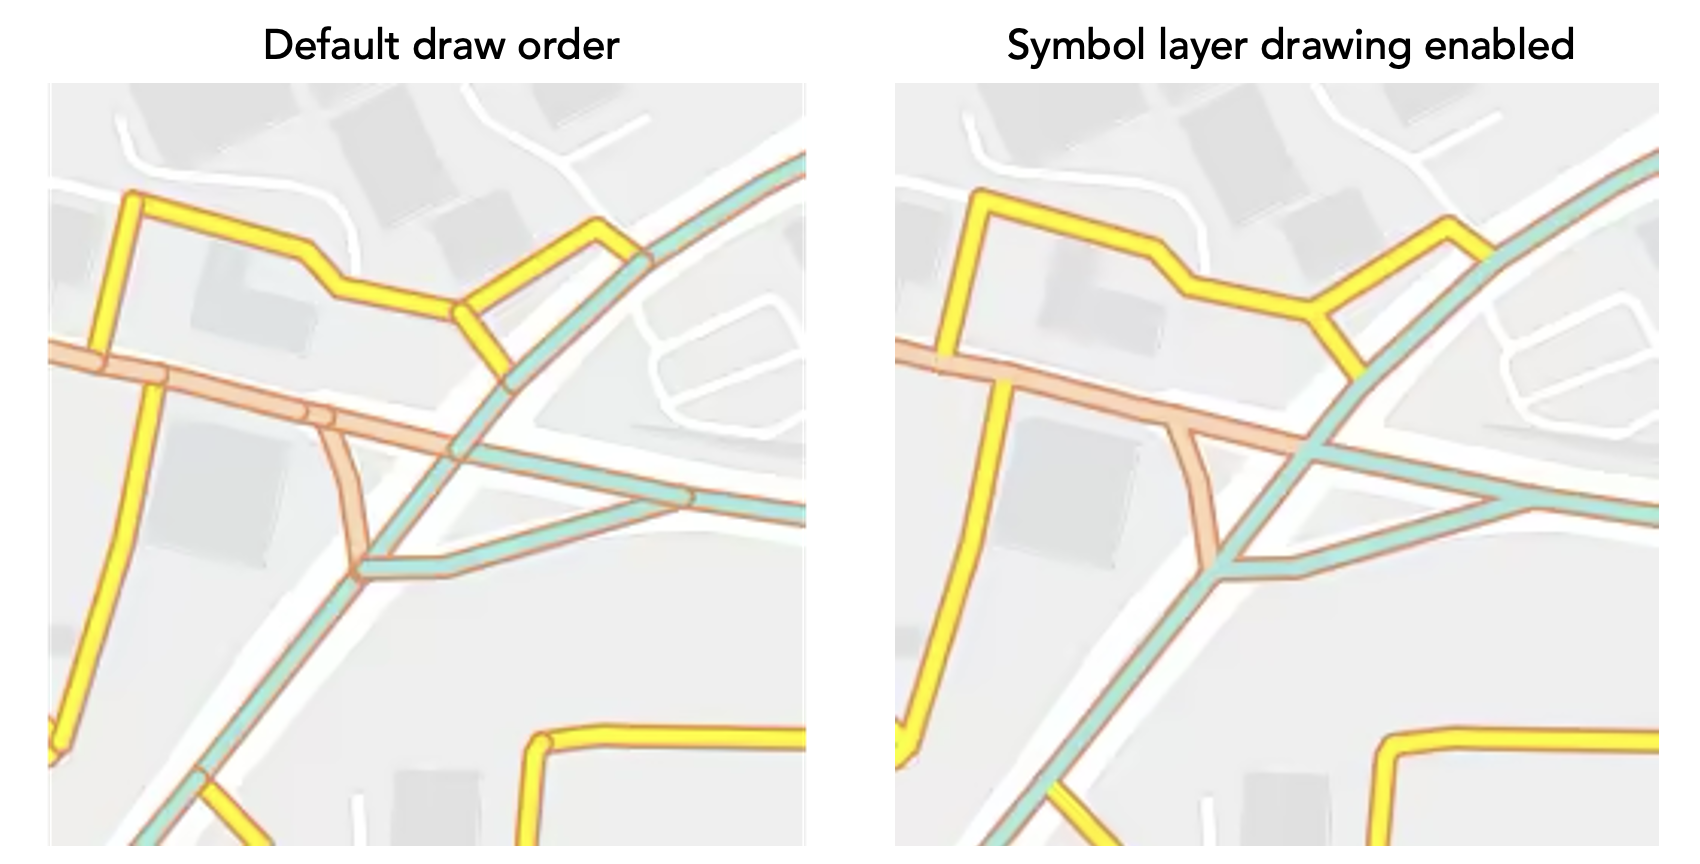
In addition to defining these advanced symbology options programmatically, layers published from ArcGIS Pro with alternate symbols and symbol layer drawing are also respected on web. Symbol layer drawing can be authored in Map Viewer as well.
Animations along a line
Create dynamic and engaging visualizations with a new CIM symbol animation type, CIMSymbolAnimationMoveAlongLine (beta), which animates markers along line geometries, such as showing plane along a flight path or flowing traffic patterns.
Please note that this CIM animation type is for visualization only. Use Stream Layer to track and visualize real-time location of objects.
Editing updates
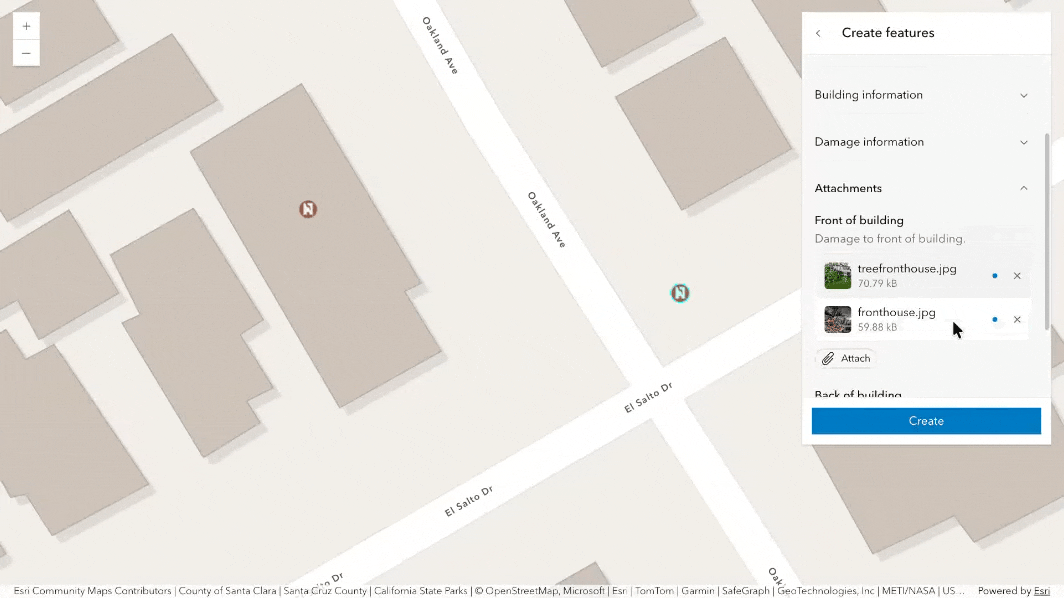
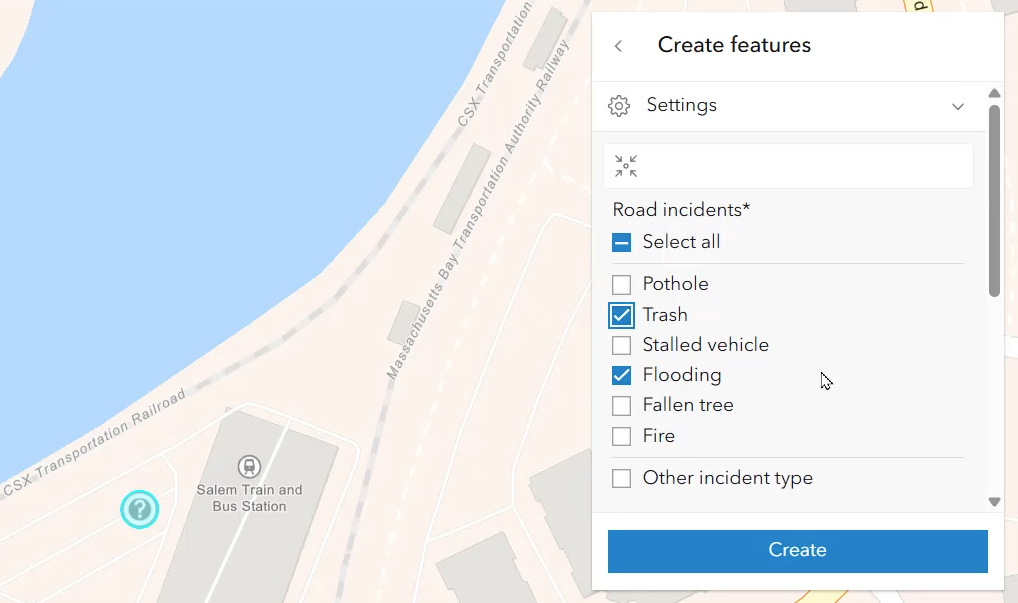
Attachment elements in Editor: With attachment elements directly supported in the Editor component, the attachment authoring experience is integrated into the same configurable form experience, providing consistent layout and behavior.
Multiple-choice input in Editor: The feature form used directly within Editor now supports multiple-choice input, improving editing workflows for data collection, inspection, survey, and classification use cases.
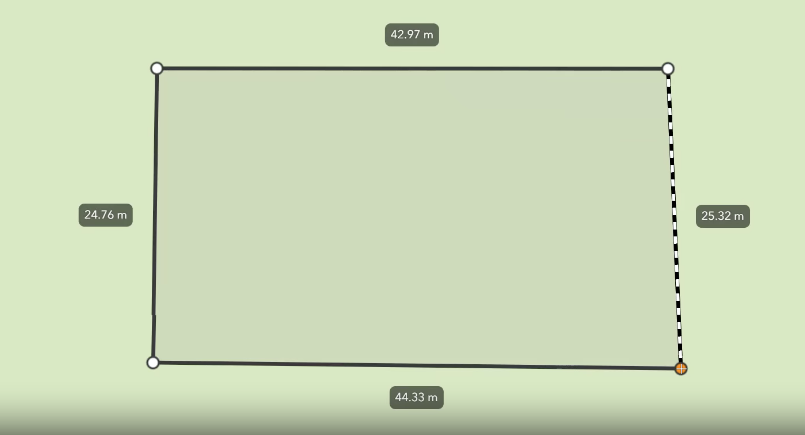
Display segment length while drawing in 2D: In Editor and Sketch components, users can now display segment length labels while drawing or editing polyline and polygon geometries, matching the behavior in 3D editing workflows.
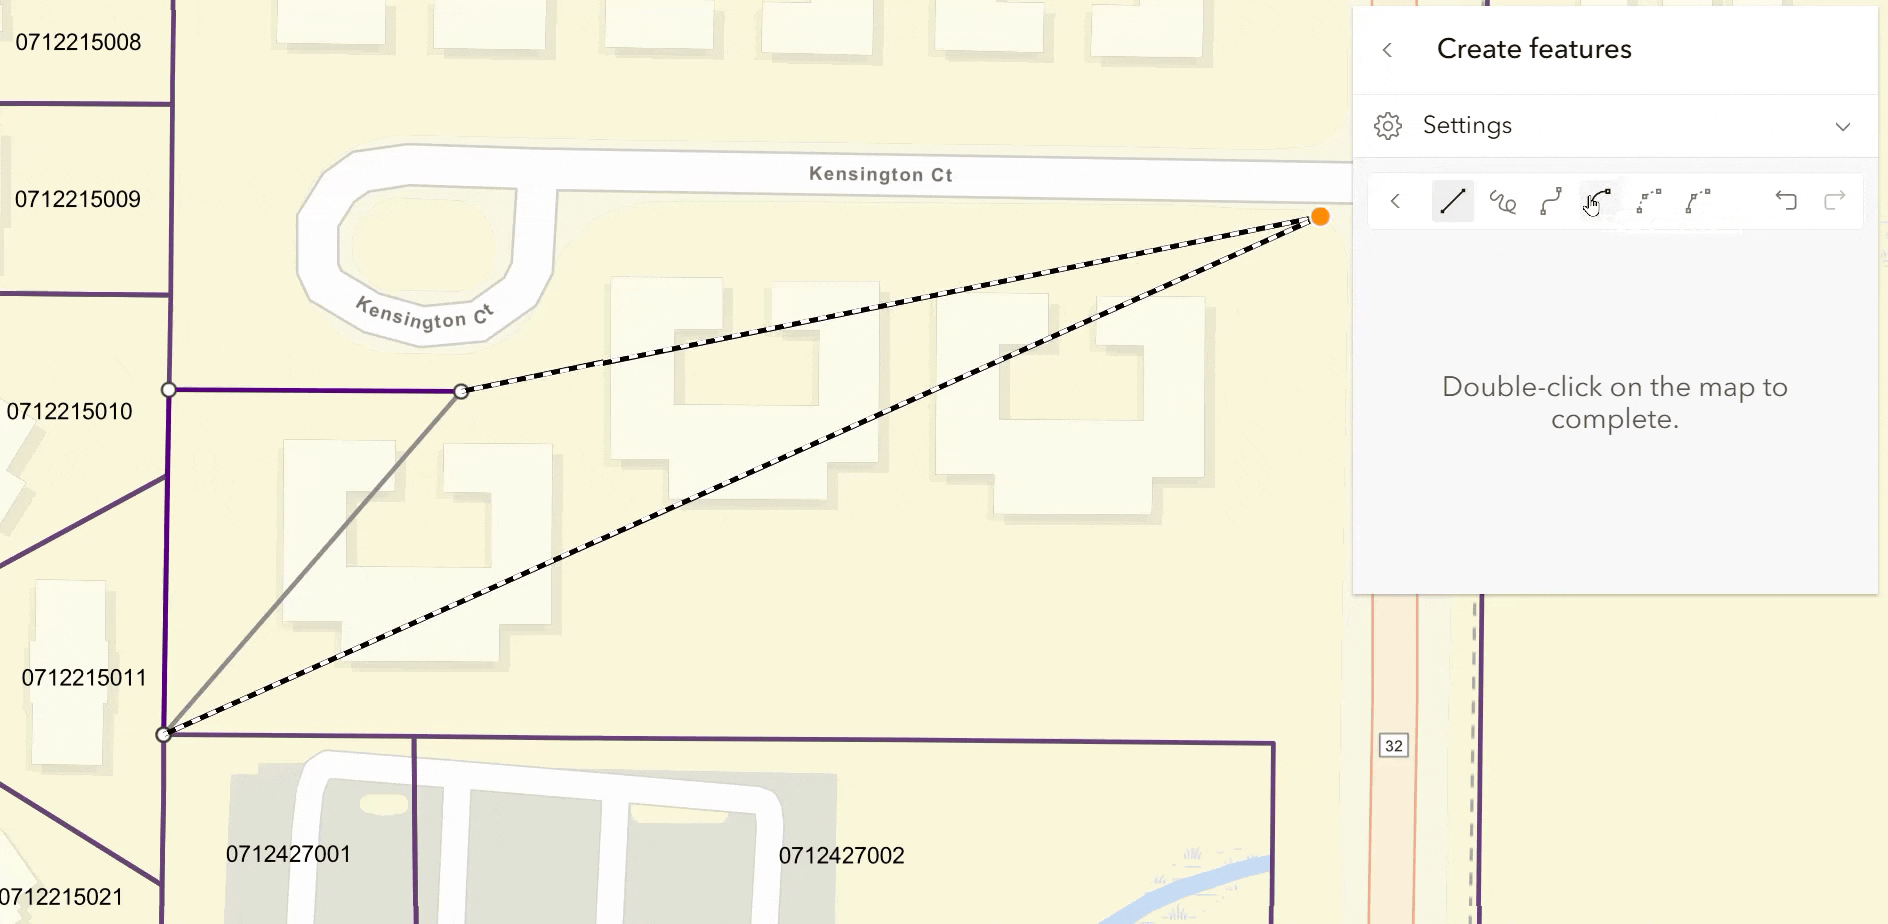
New tangent curve tool: We added the tangent curve segment drawing tool to Editor and Sketch components. A tangent curve is a circular arc segment that passes through an endpoint where the tangent line and existing line segment meet.
M- and z- values support in 2D
M- and z- values are supported in feature layer in 2D maps. When visualization depends on these values, 2D rendering queries now fetch m- and z- values and make them available on client-side feature geometries. M-values are a measure attached to a vertex, such as distance along a line feature, speed limit, or start and end vertices on a route. We also introduced a new CIM symbol type, CIMMarkerPlacementAtMeasuredUnits, for placing markers along a line at interpolated M values, such as visualizing mile markers along a route.
Z-values are a third coordinate used to specify the location of a vertex, normally indicating elevation or distance above or below ground. For display consistency, the visible z-values in 2D are automatically scaled to the linear unit of the map’s horizontal coordinate system, including when shown in labels and popups
Fetch features by screen rectangle (beta)
Directly retrieve features in a 2D map component from a rectangle on screen. As you pan or zoom the map, the hitTest method will return features across layers that are intersecting with the specified rectangle, in addition to existing point-based interaction. This new feature makes it easier to support workflows such as drag-to-select and area inspection.
You can also now get raster pixel from Imagery Layer and Imagery Tile Layer with point or rectangle on screen via the hitTest method, expanding this interactive workflow to raster support.
Get popup features from the view
The new fetchPopupFeatures method, available on map, scene, and link chart components, fetches all features with a popup template directly from the view with a provided screen point or screen rectangle (beta). This simplifies interactive workflows that previously requires Popup or Feature components.
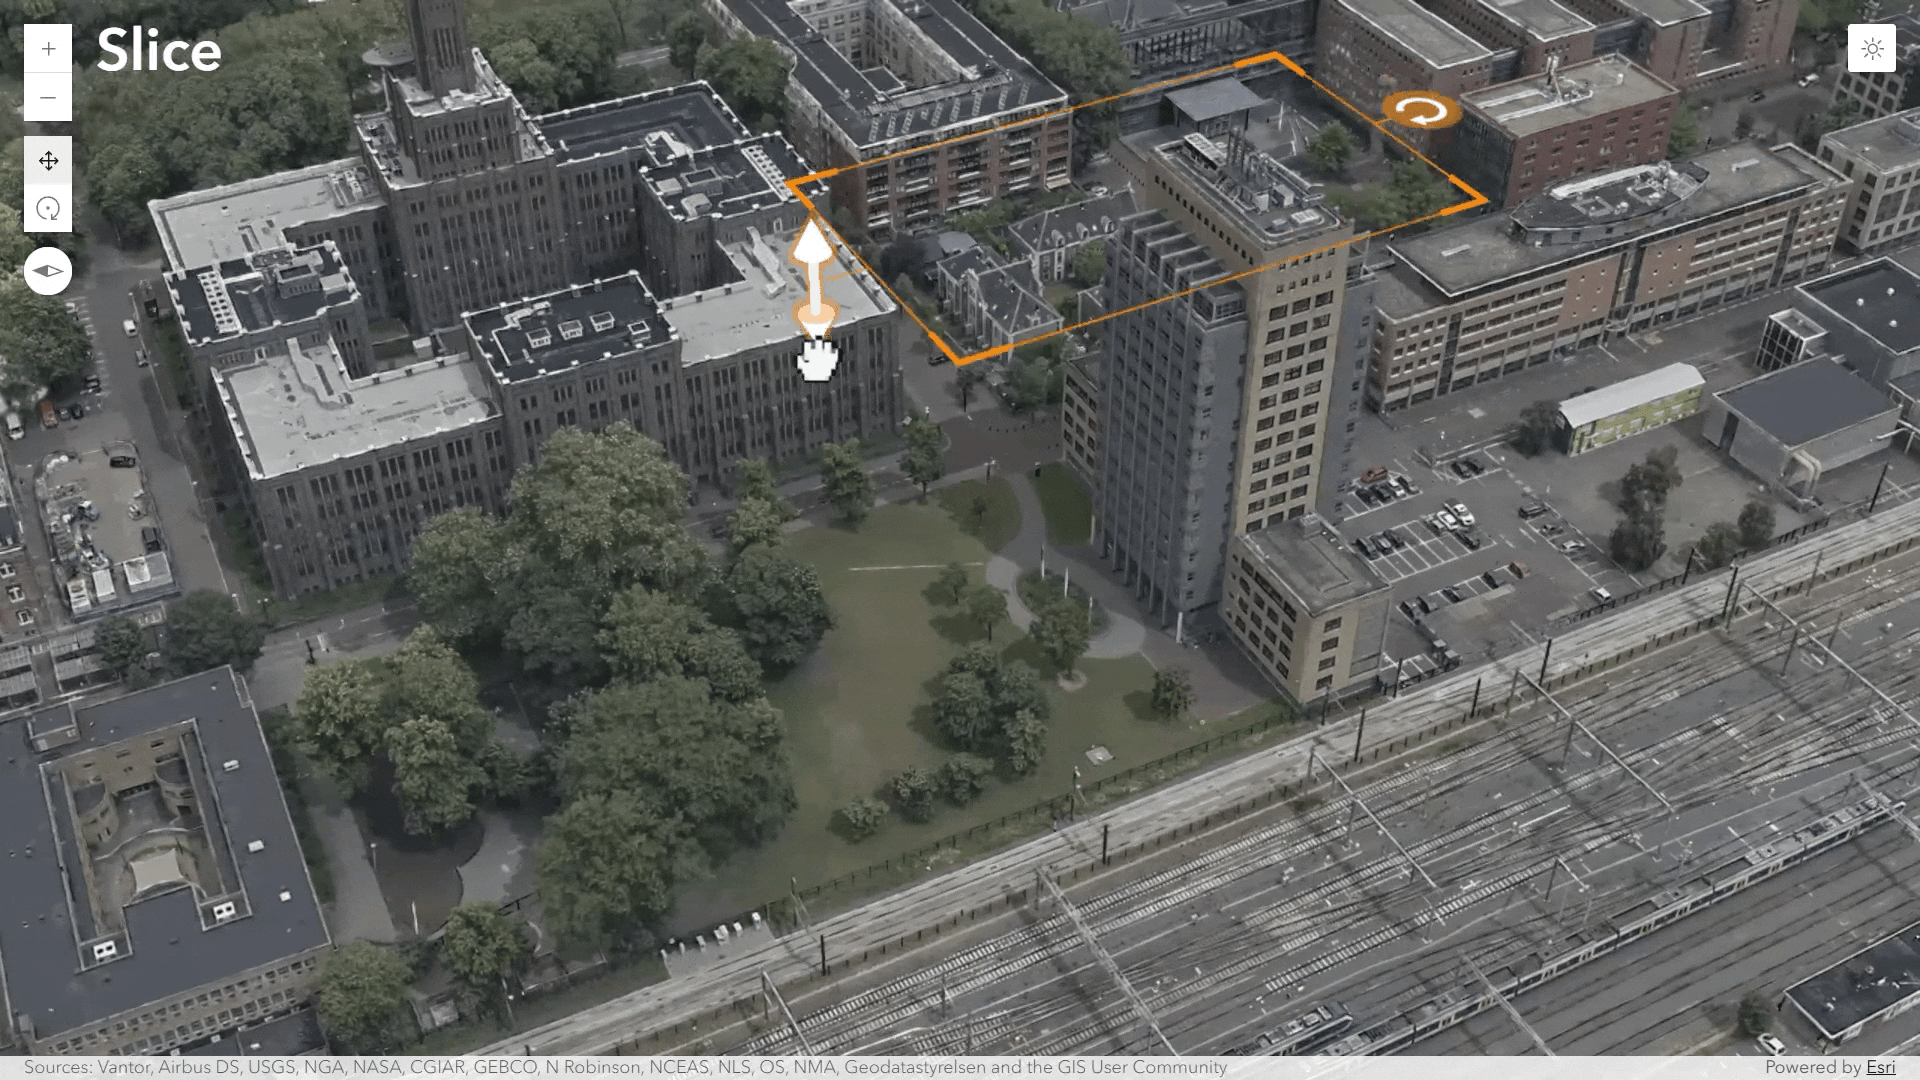
3D analysis support for gaussian splat layers
Interactively explore Gaussian Splat Layer with enhanced 3D analysis capabilities, such as shadow analysis, slice analysis that reveal occluded content, line of sight analysis, and elevation profiles. This extends both visual inspection and analysis workflows for gaussian splat content in complex 3D scenes, bringing gaussian splat layer’s analysis capabilities closer to parity with other 3D layer types.
AI components (beta) updates
Agent utilities for build custom agent easier: Building and creating agents for custom workflows with our new agent utility classes and functions. Learn more on how to create a custom agent with these utilities in the new Create custom agents guide. Explore knowledge graphs with new Knowledge Agent: The Knowledge Agent allows you to explore knowledge graph data directly from the service or on maps and link charts. Performance improvements: A new fast model tier (GPT-5.4-nano) offers a cost- and speed-optimized option for tasks like classification and summarization. Help, Navigation, and Data Exploration agents now use this tier in select scenarios for faster responses.
Map components updates
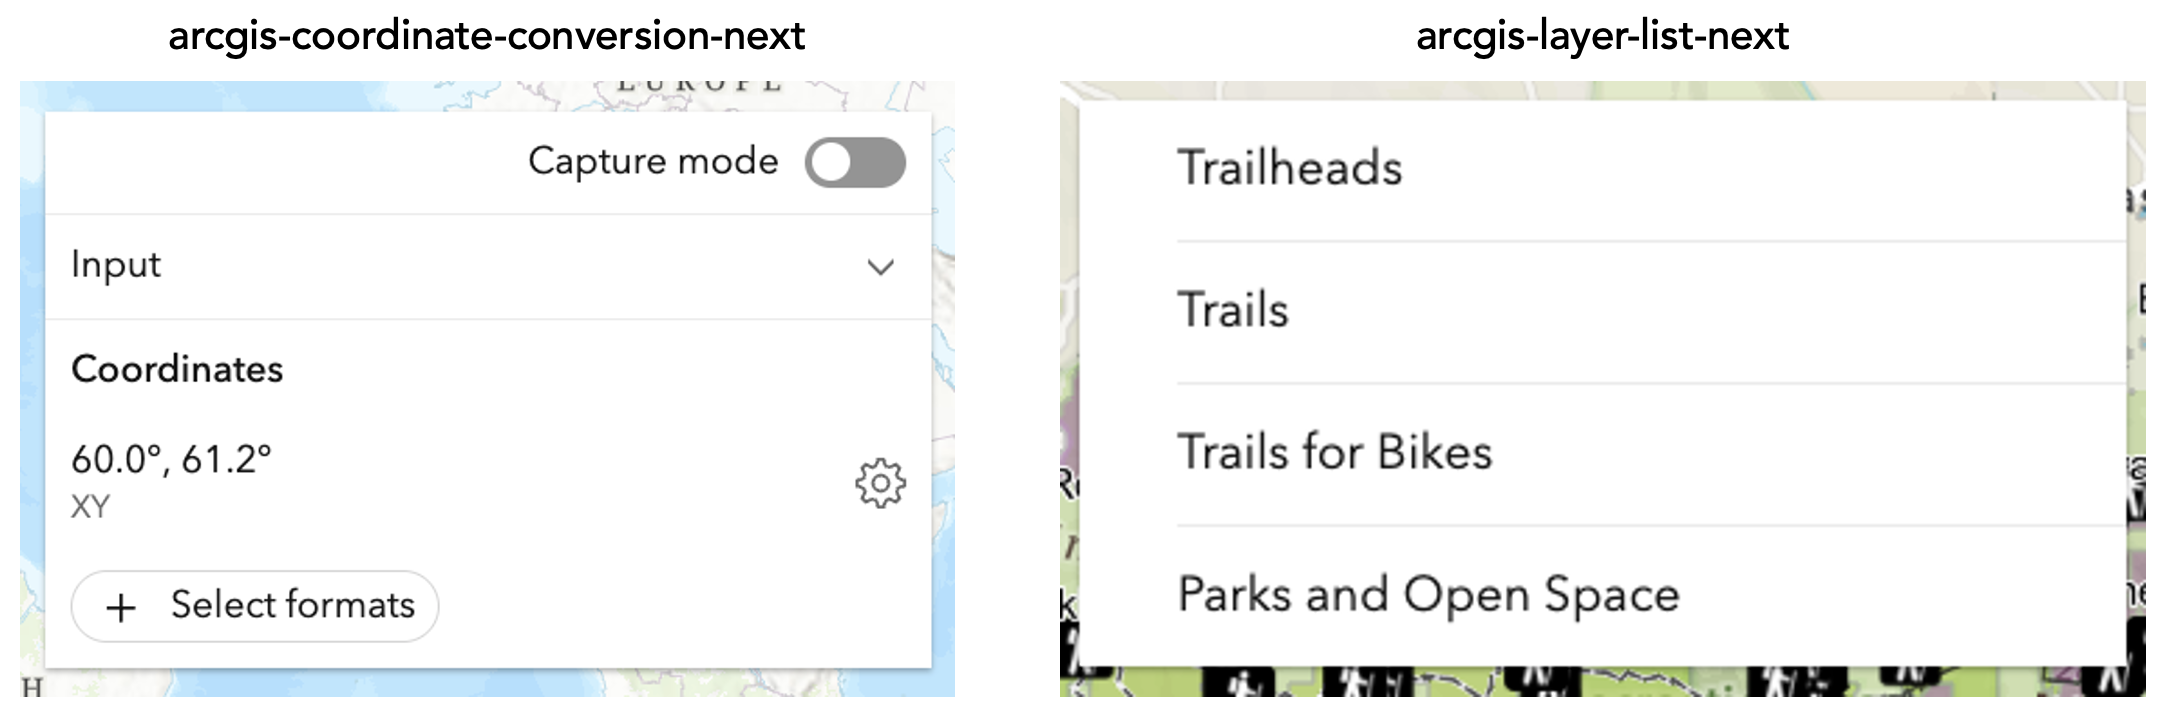
New map components: Six new map components are introduced in this release. For example, Coordinate Conversion Next component (beta) is the next-generation component for coordinate conversion, with an updated interface, support for multiple simultaneous conversions, and additional configuration options. The components marked with -next are the successors to the existing component with the same name and provide enhanced functionality and/or an updated user interface, that may include breaking changes.
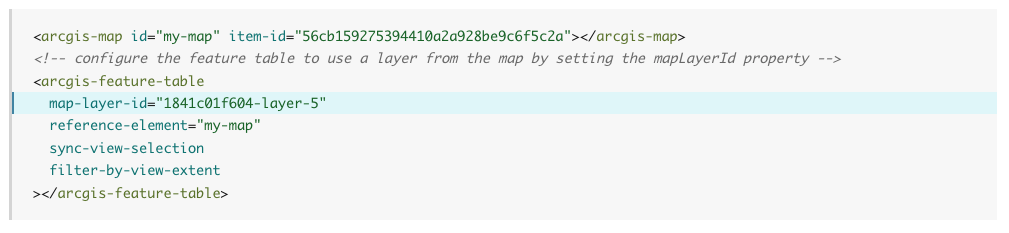
Reference layer declaratively: the new mapLayerId property in the Feature Table, Directions, and Oriented Imagery Viewer components lets apps declaratively reference an existing layer in a web map or web scene by ID. The result is simpler component configuration, less duplicate layer loading, and better startup efficiency.
Charts components updates
Styling charts with Calcite CSS variables: Customize the style of charts to better match the overall design of your application with Calcite CSS variables. For example, use the calcite-mode-dark class for dark theme in charts.
Charts support in imagery layers: Histogram and scatterplot can now be configured with Imagery Layer, Imagery Tile Layer and WCS Layer, by loading existing charts or creating new charts with charts model. Bar charts can also be configured when the imagery layer contains a raster attribute table.
New guides for chart types and styling: We’ve added new guides for supported chart types, each featuring practical configuration examples to help you get started quickly. Also, the new styling and theming best practice guide provides recommendation for customizing chart appearances.
Enhanced Arcade Editor in coding components
Introducing Arcade Editor debugger: The Arcade Editor component has been enhanced to provide a better debugging experience for users, including more detailed error messages, breakpoint, etc. The debugger can be implemented by
<arcgis-arcade-editor
    enable-debugger
</arcgis-arcade-editor>
Arcade assistant (beta) in Arcade Editor: The Arcade assistant (beta) is now available for use in custom applications with the Arcade Editor. The underlying AI model in the assistant can generate Arcade expressions from natural language prompts, or to find and fix errors in their code.
Oriented imagery enhancements
Superimpose view is introduced in the Oriented Imagery Viewer component, allowing users to overlay the image currently displayed in the viewer directly onto a 3D scene. With the superimpose view, users can perform visual validation, improve situational awareness, identify alignment issues, and make more informed decisions without leaving the 3D environment.
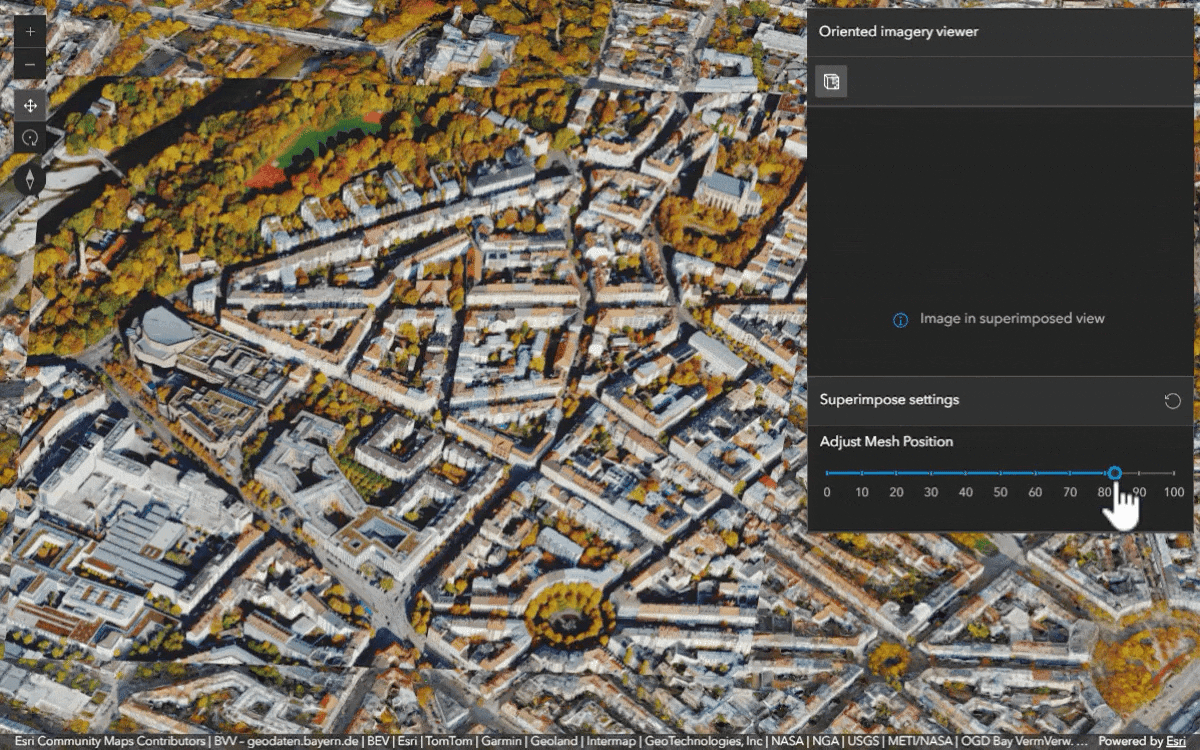
We also added support for multi-field sorting in sequential navigation and image overlays can now be used in oriented imagery layers containing video content.
Performance enhancement for large polygons
We improved the rendering performance for large and complex polygons with many vertices in ArcGIS Online hosted feature services. If a large feature spans multiple tiles, its geometry is fetched only once, significantly reducing server-side processing and client-side costs.
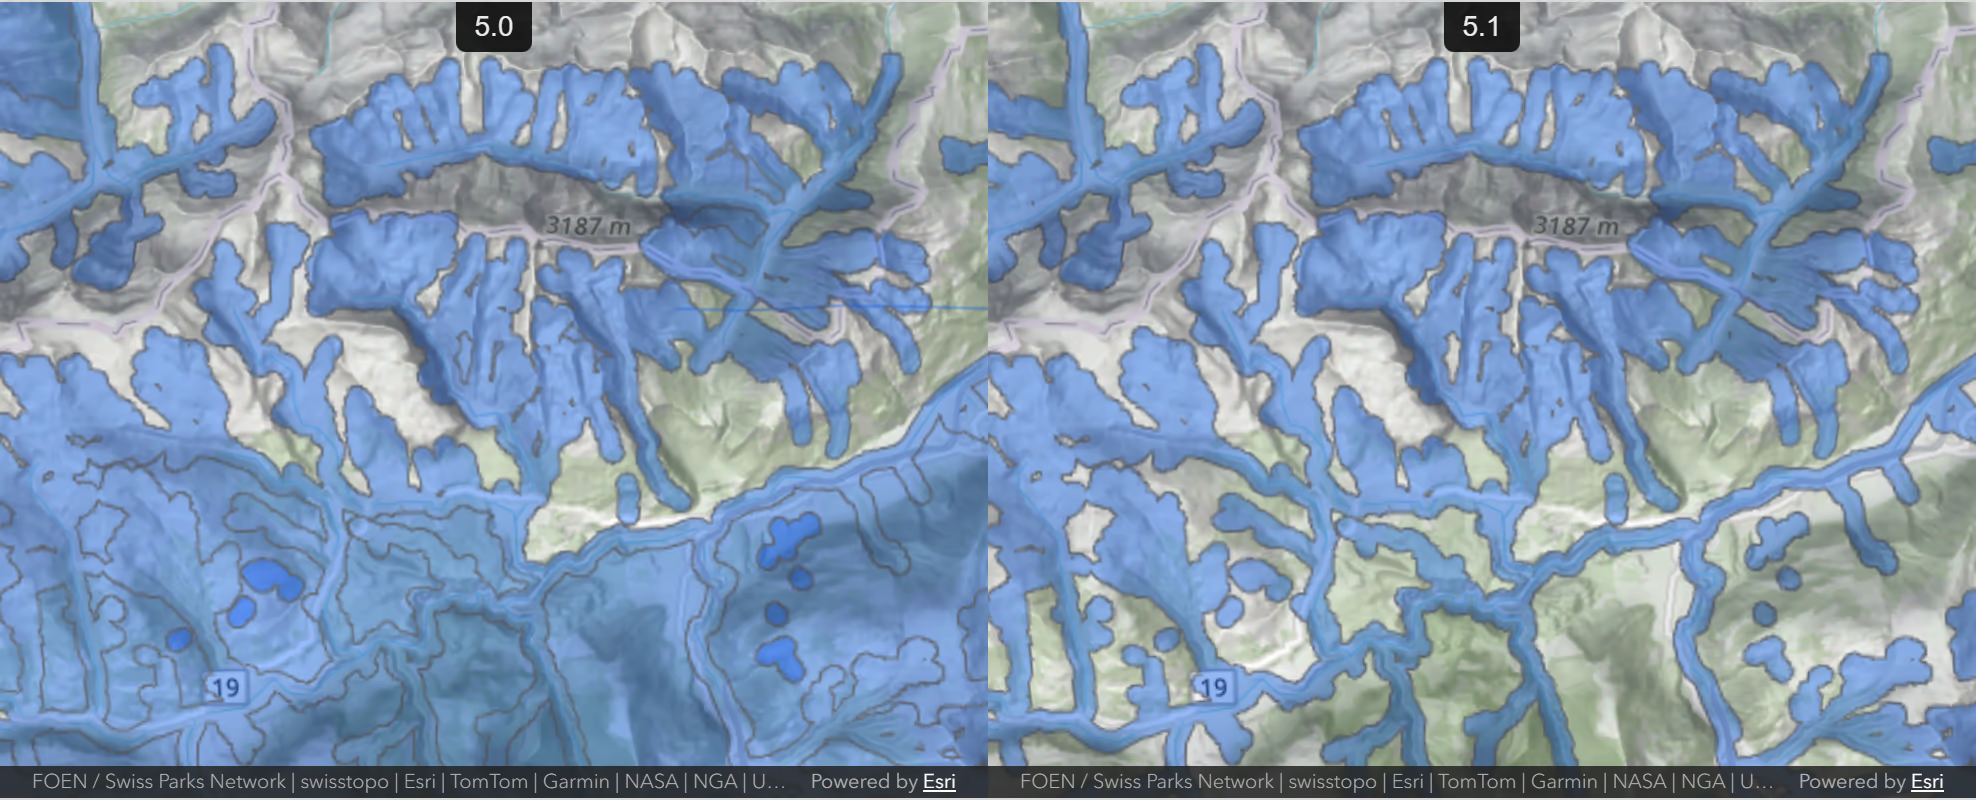
Improved 3D polygon tessellation
Improved 3D tessellation utilities can better handle polygons with multiple rings, holes, or self-intersections, making rendering complex polygons in 3D more consistent with 2D.
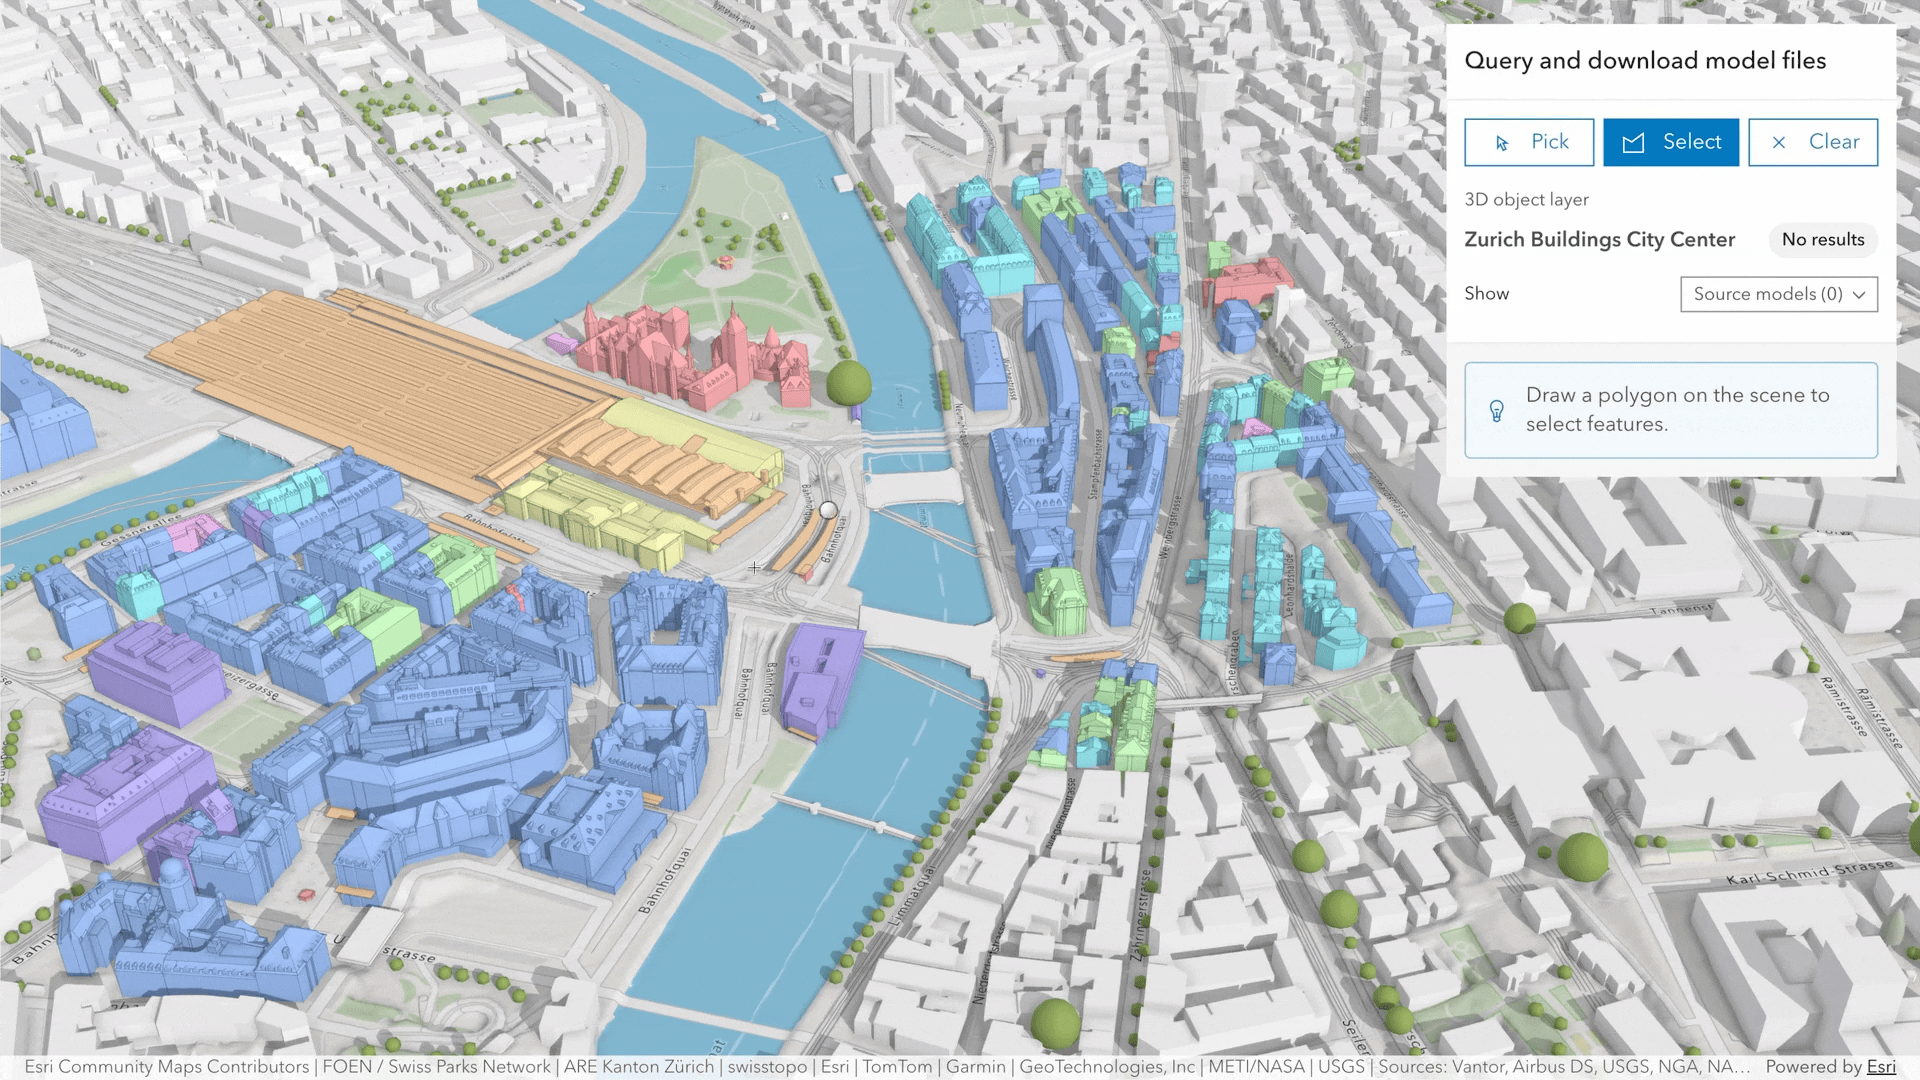
Query associated models from 3D object layer
3D Object Scene Layer now supports querying the source and derived models associated with 3D object features. This makes it possible to query available model formats, request a specific representation such as glb or ifc files, and download model files on demand.
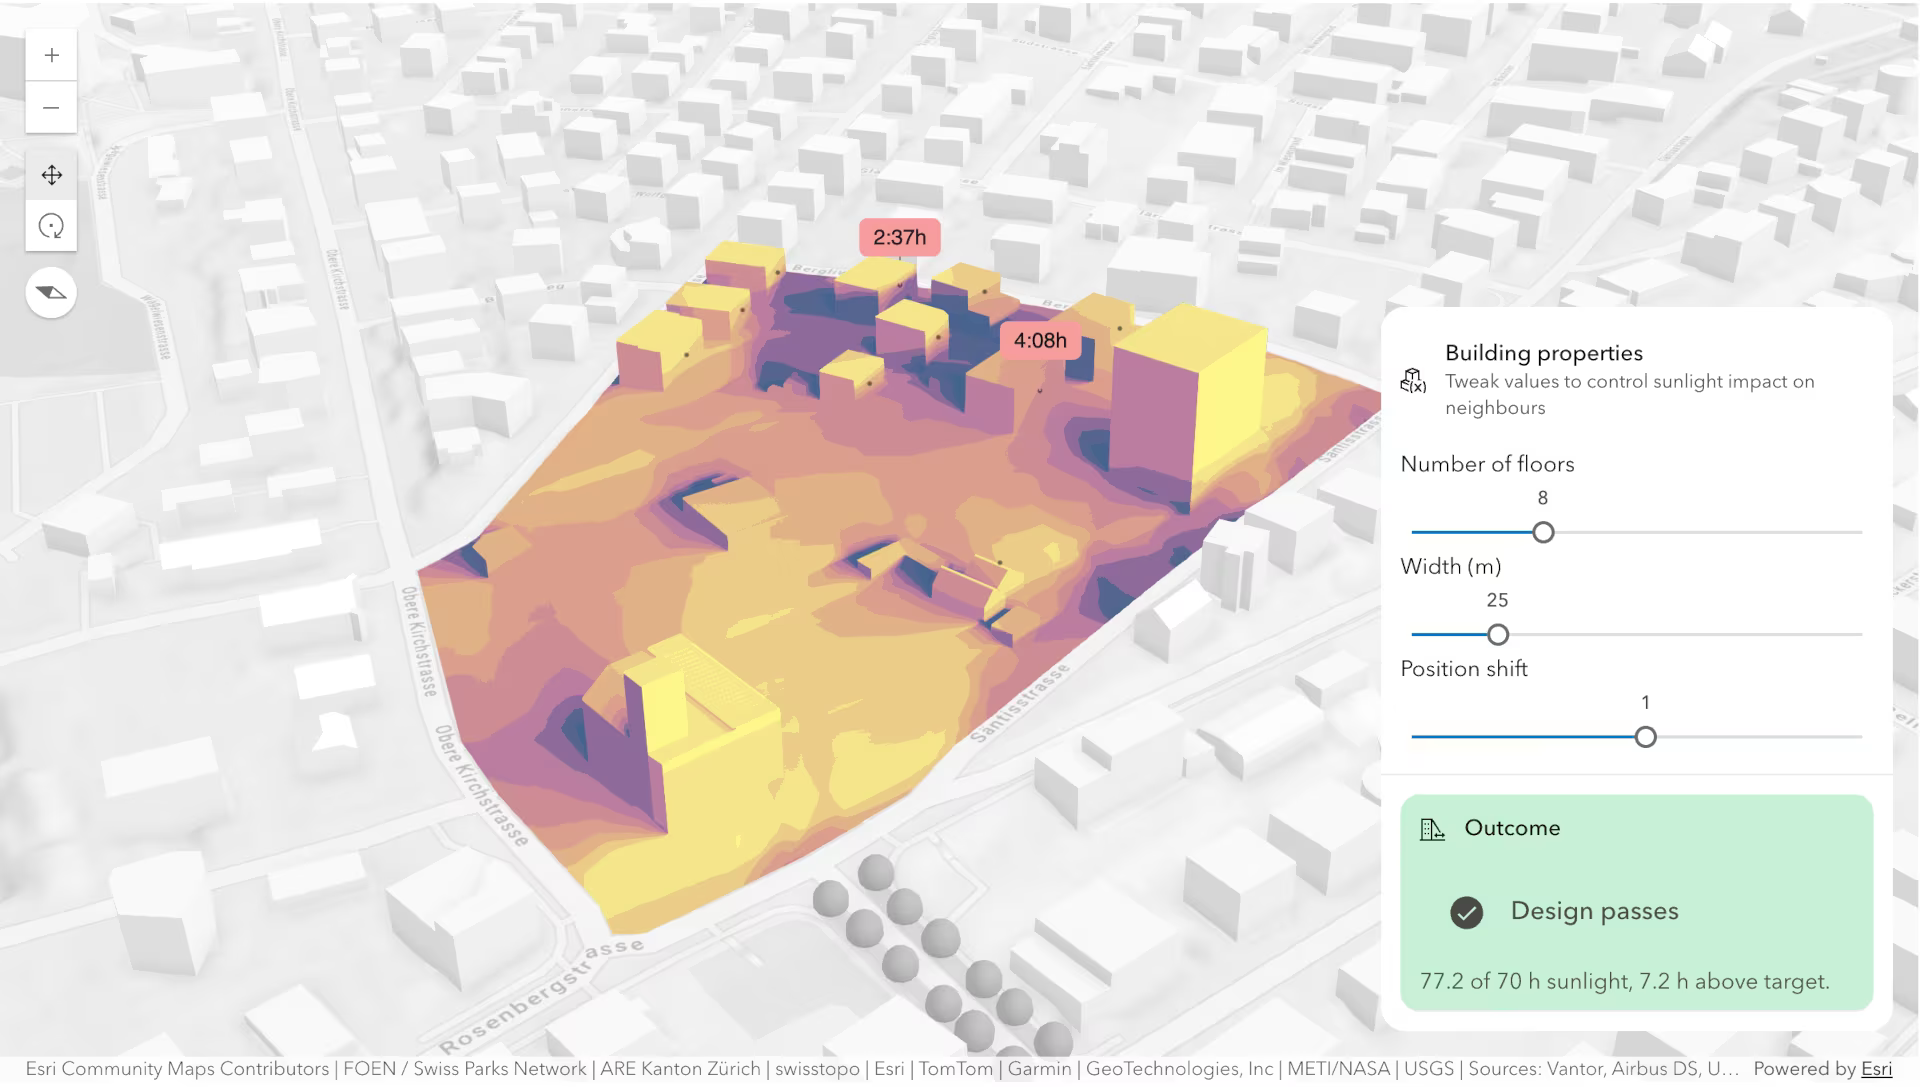
Sunlight duration analysis
Visualize and analyze sunlight exposure with sunlight duration analysis, which is available in shadow cast analysis and the Shadow Cast component. You can visualize areas that receive sunlight during the selected day and time range, limit the analysis to predefined polygonal project area, and use custom color ramps to create compelling visualizations.
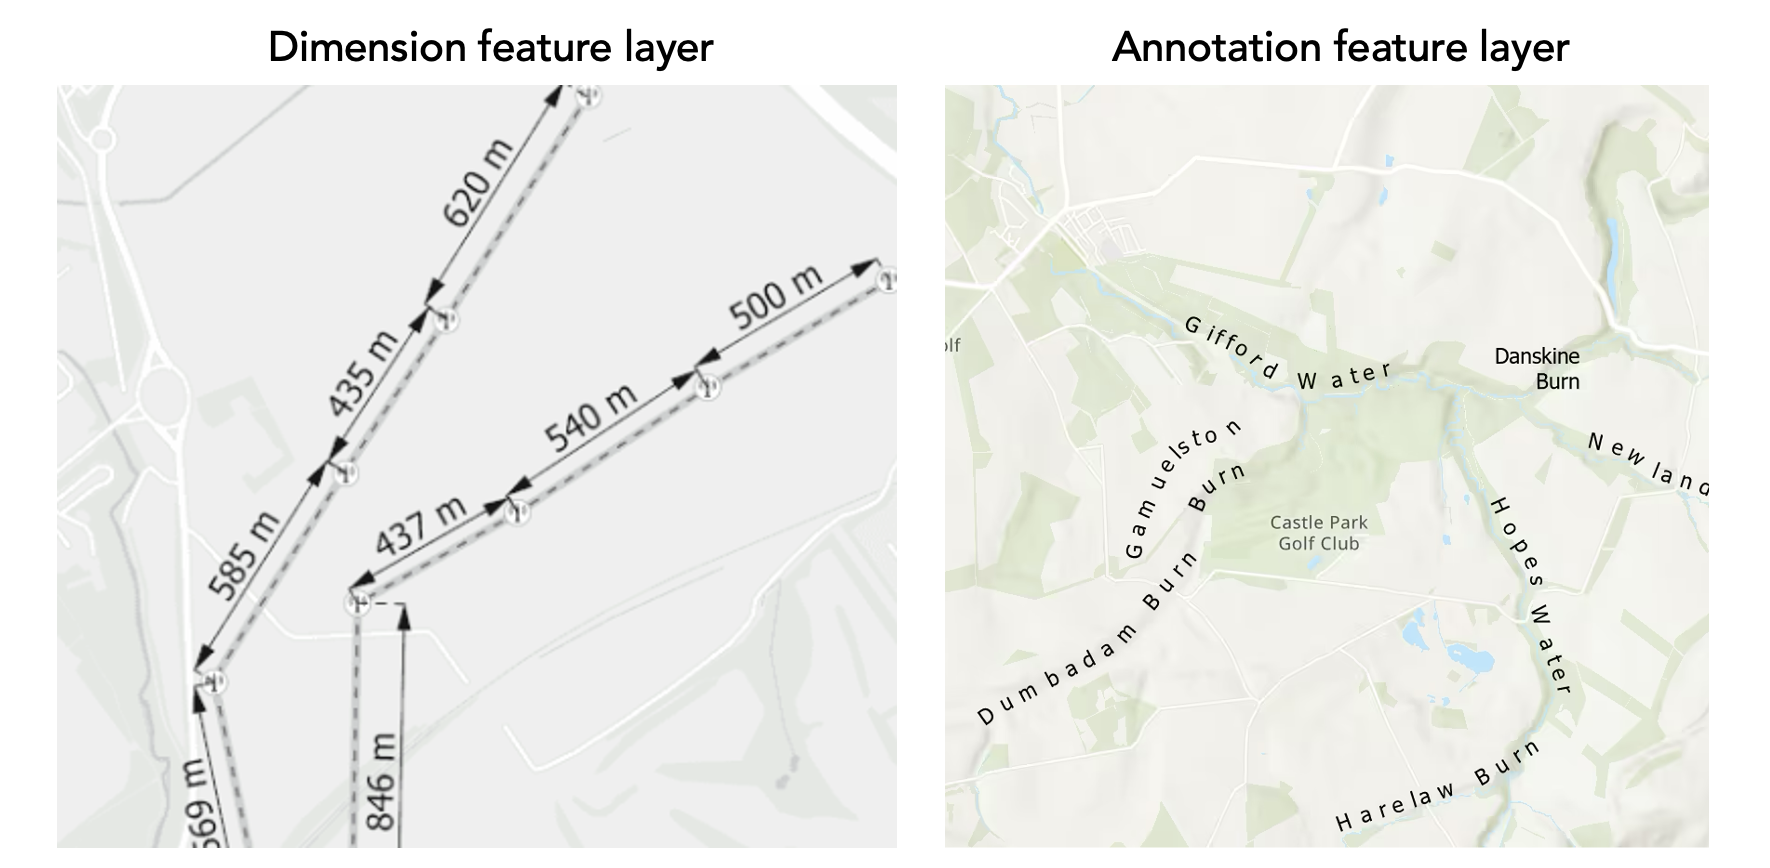
Display annotations and dimensions (beta)
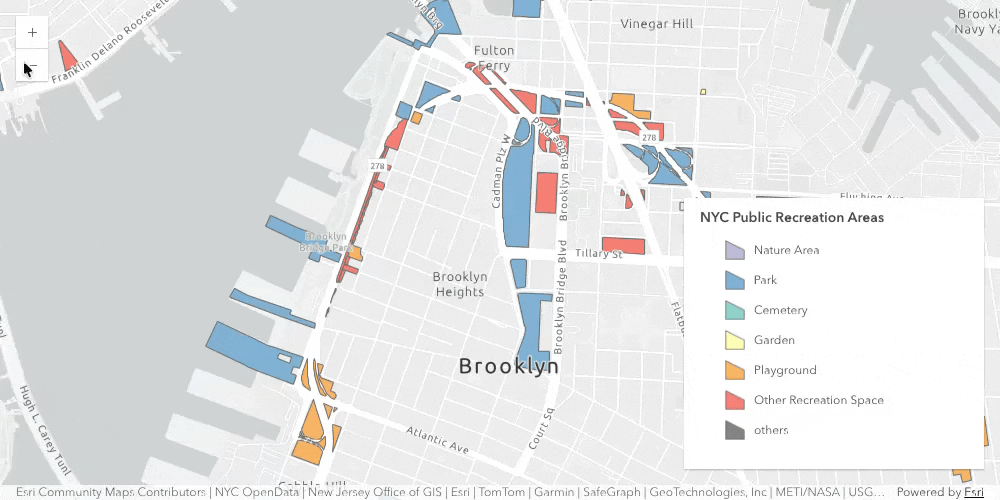
Annotation Feature Layer (beta) and Dimension Feature Layer (beta) are added in this release for displaying annotations and dimensions in a 2D map, showing them in layer list component, and saving them to a web map. An annotation is a type of feature that consists of text with position, layout, and style attributes. This release supports displaying feature-linked and standard annotations, without displaying leader lines. A dimension may indicate the length of a side of a building or land parcel, or the distance between two features, such as a fire hydrant and the corner of a building. Dimension feature layer is for displaying dimensions in 2D maps. Use Dimension Layer for 3D implementation of dimensions.
This is the initial beta release of annotation feature layer and dimension feature layer. The layers are not yet intended for production use. More complete rendering capabilities, selection and pop-up support, and more are coming in future releases. We invite you to test with your data and provide feedback as we continue to refine and extend the experience.
Telecom domain networks
We added support for the Telecom Domain Network — a powerful capability first introduced for telecom companies in ArcGIS Pro 3.7 and ArcGIS Enterprise 12.1. Designed for organizations working with fiber, wireless, copper, and coax infrastructure, the Telecom Domain Network enables detailed, complex network modeling at the strand and port level. New JavaScript APIs deliver dedicated support for circuit management, complex data modeling, and circuit and path tracing, giving Esri partners and third-party developers the tools to build powerful, web-based applications for the telecom market.
Accessibility and localization improvements
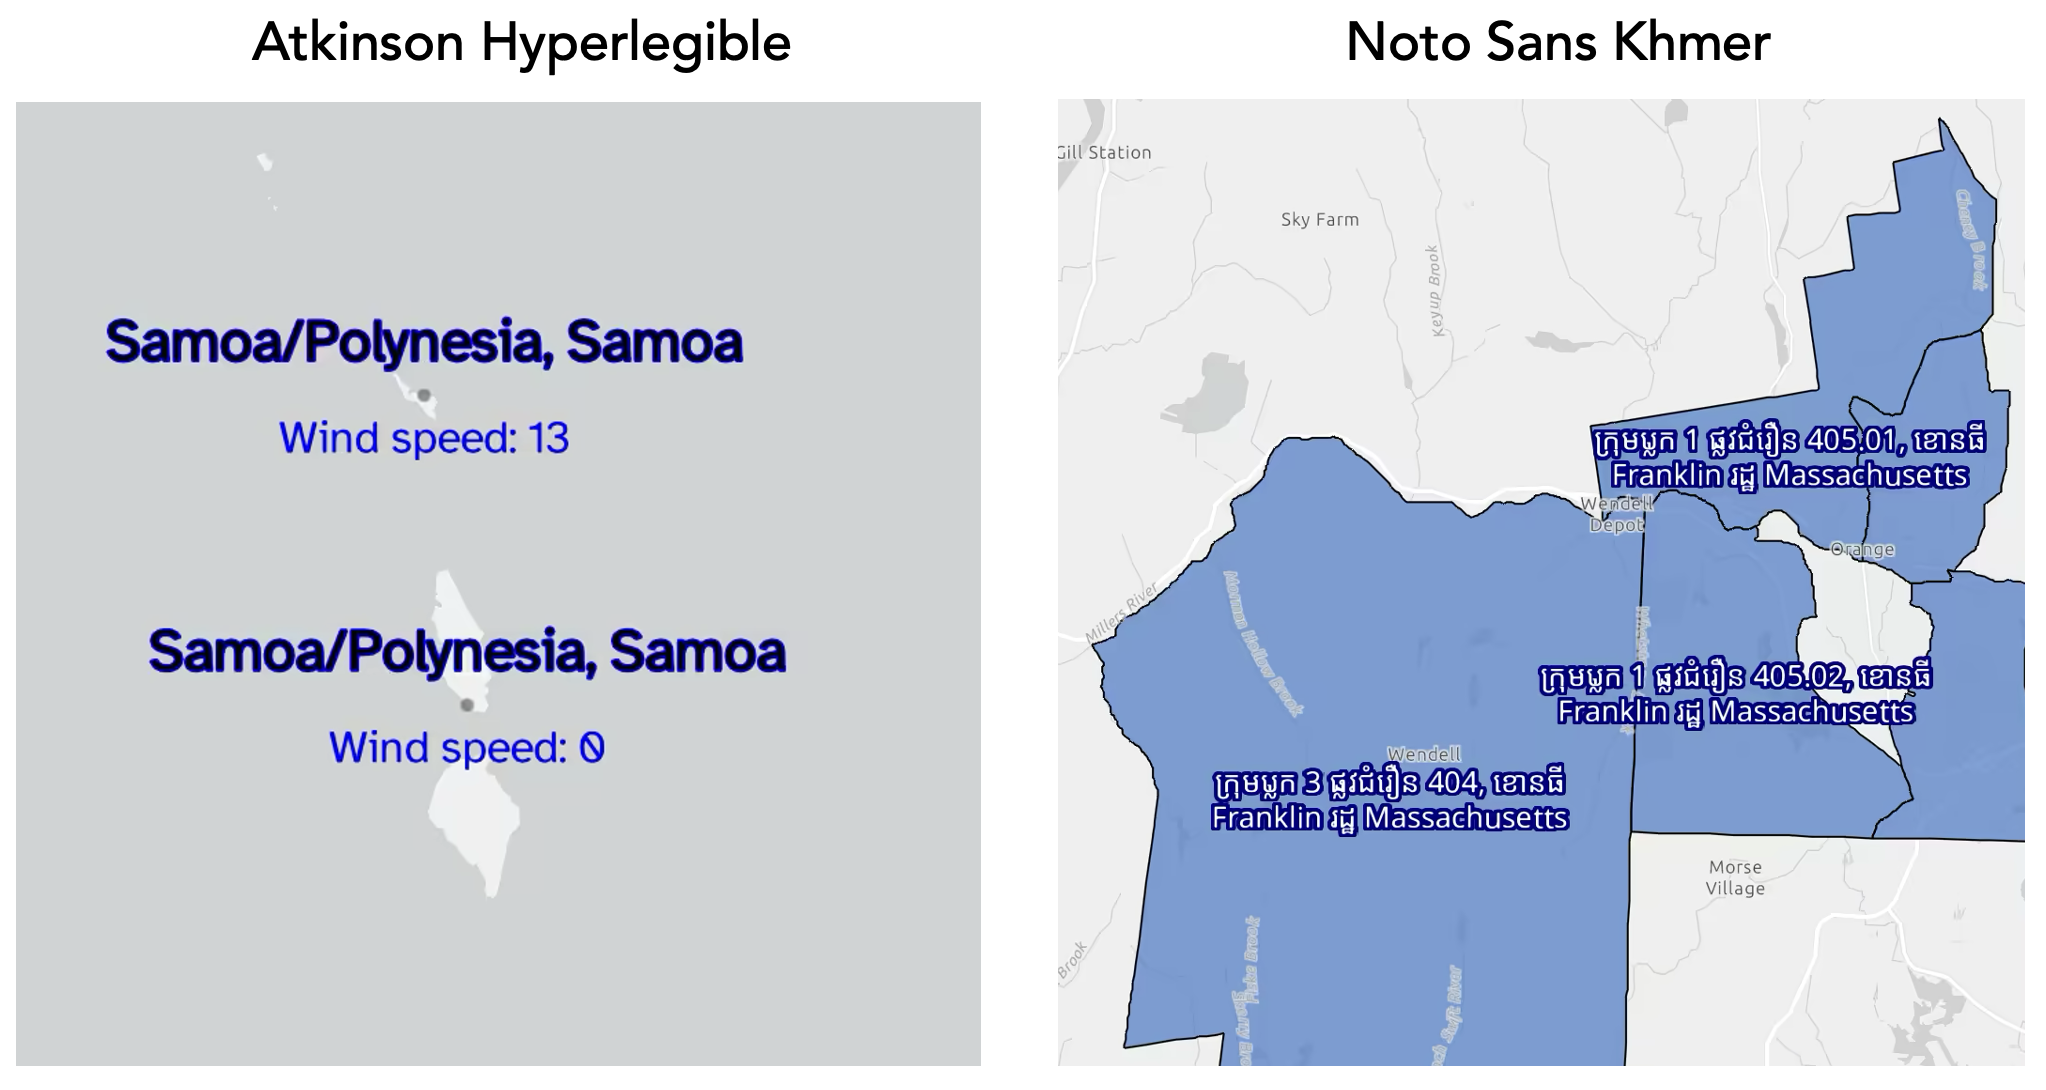
More fonts in 2D: We added support for more fonts, including specialized support for languages with complex glyphs and shapes. The newly supported Atkinson Hyperlegible font maximizes readability, especially for visually impaired users.
Dynamic announcements and focus management: The Bookmarks and Search components now announce dynamic changes during interactions to assistive technologies, alerting users with crucial context changes in the user interface. Focus enhancements are added to the Popup component upon opening.
Documentation updates
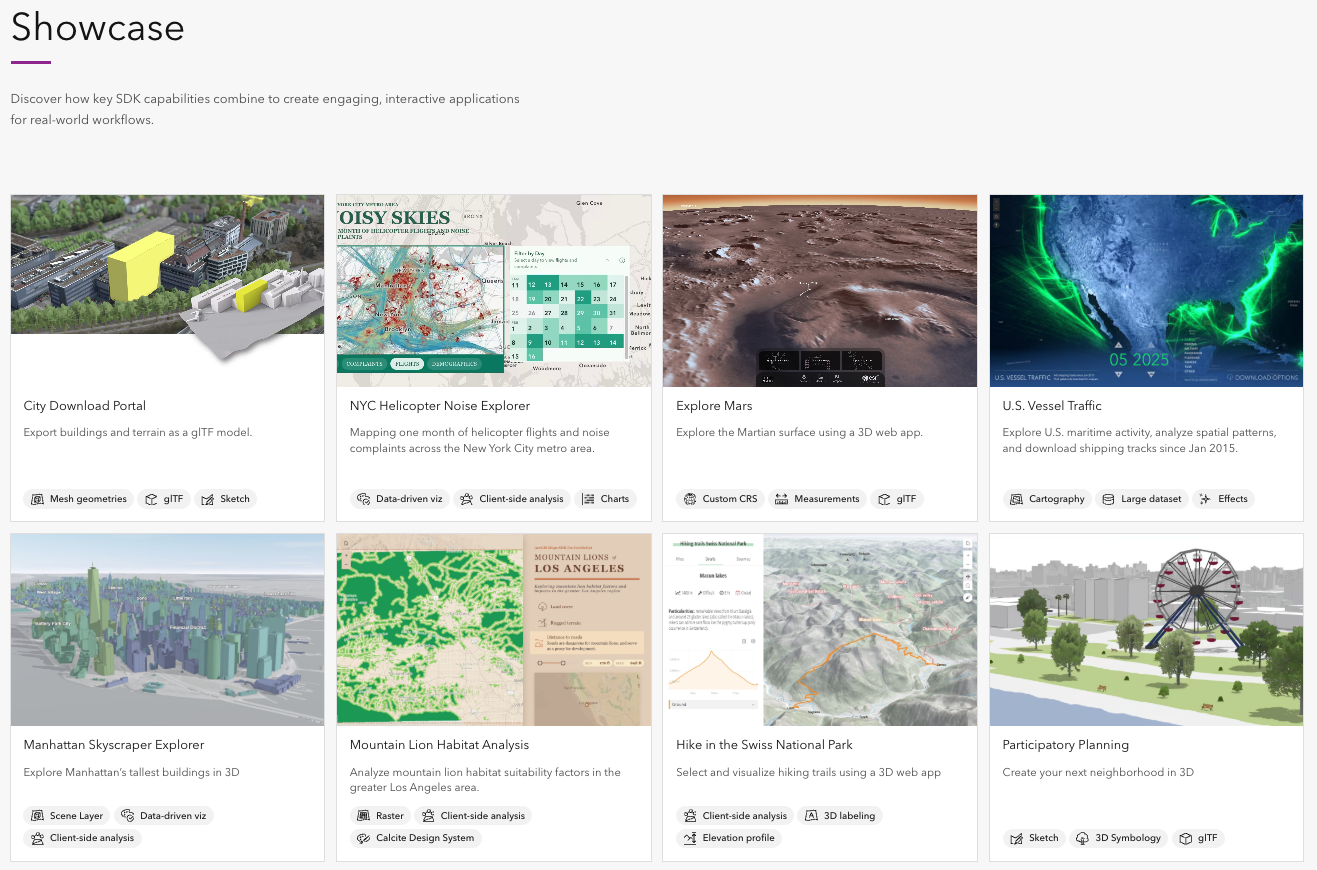
Revamped showcase apps for combined SDK capabilities: The showcase page has been fully refreshed with three new applications, and all 2D/3D apps now follow best programming practices, demonstrating how to build complete, real-world experiences by combining key SDK capabilities.
New authentication guide: We added a new authentication guide on best practices on authentication to access secure ArcGIS resources. It includes detailed information on type of authentication, step-by-step tutorials, and code examples.
Documentation for previous versions: Starting with version 5.0 and version 4.34, previous SDK documentations for supported versions are available on our SDK Downloads and Archive page – making it easy to access the documentation of previous versions without downloading the SDK locally.
Learn more and stay connected!
There are so much more in version 5.1 – improved navigation in 3D, volume measurement in preview, more field configuration support, and more. Read our release notes for detail and a full list of advancements.
Join our YouTube livestream, at 9.am PT, Wednesday, July 29th where the product team will share release highlights live with you! This relaxed, interactive session is your chance to explore the latest updates and get your questions answered directly by the product team.


Article Discussion: