ArcGIS Online helps you understand the world around you by using interactive maps to connect people, locations, and data. You get smart, data-driven visualizations and intuitive analysis tools that deliver location intelligence. This intelligence can then be easily shared as a map, story, dashboard, or app with your organization or the world. ArcGIS Online can help you scale the reach of the work done in ArcGIS Pro, and also work alongside an ArcGIS Enterprise deployment.
The June 2026 update includes new features and enhancements for smarter content management, richer data and imagery options, streamlined workflows, and more dynamic mapping and sharing capabilities. Highlights of these updates, along with other enhancements and new functionality throughout ArcGIS Online, are provided below.
ArcGIS Online is updated three times each year. See the ArcGIS Online blog articles to learn more about previous updates to ArcGIS Online and new functionality and enhancements you may have overlooked.
For more information and additional details about this release, see the What’s new help topic or view all posts related to this release.
Don’t have time to read the blog article? View the video instead.
Quick links
Use the links below to jump to sections of interest.
App Builders
Apps and Extensions
- ArcGIS Hub
- ArcGIS Web Editor
- ArcGIS Notebooks
- ArcGIS Data Pipelines
- ArcGIS Velocity
- ArcGIS Excalibur
- ArcGIS Workflow Manager
- ArcGIS Business Analyst Web App
- ArcGIS GeoBIM
- ArcGIS Solutions
Ready-To-Use Content
Map Viewer
Using Map Viewer, you can author, explore, edit, and share web maps. Map Viewer is used to perform common GIS tasks, such as to explore the contents of a web map, change the basemap, add data layers and styles, perform measurements, and execute different types of data analyses. Map Viewer features responsive mapping and supports real-time updates to the map as you work.
Here’s an overview of new features and enhancements to Map Viewer delivered with this update.
Review maps for optimal performance
The new Review map tool evaluates your web map and provides detailed information, summaries, and recommendations to help improve performance and resilience under high-demand usage. Review map displays essential map facts and highlights areas that you should consider. Review map can be found on the Contents (dark) toolbar and includes Review map, Advanced review, and Summary information panes.
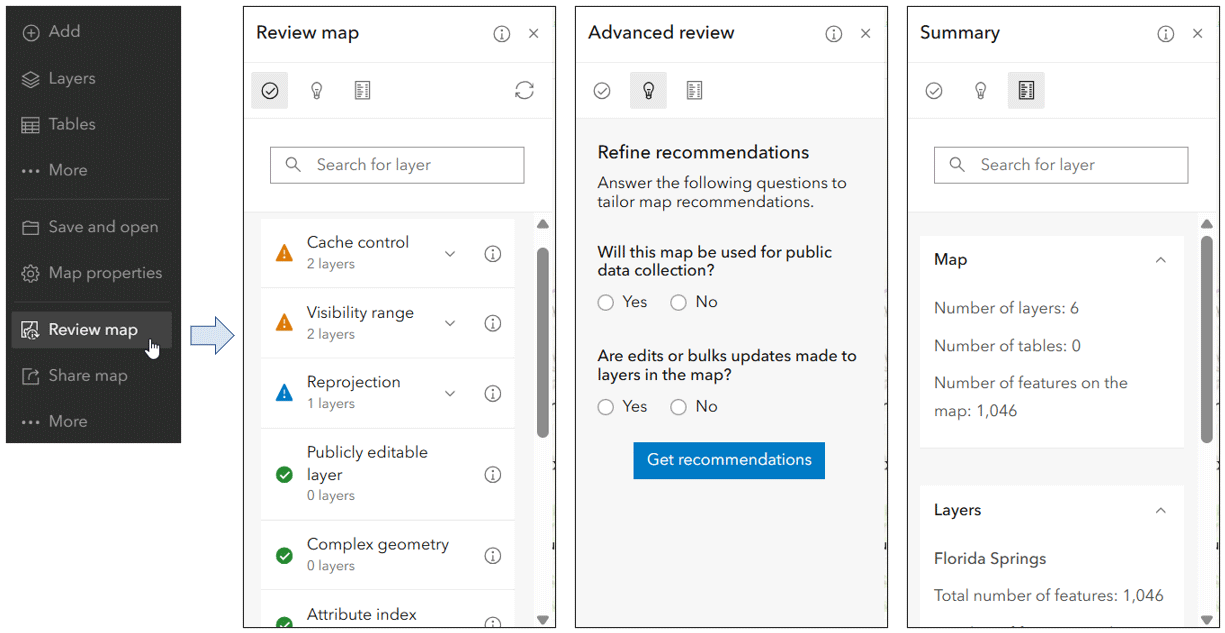
It is designed to help you prepare public-facing or high-traffic maps and to protect your organization’s available resources as demand increases or exceeds expected usage.
Imagery layer interactive charts
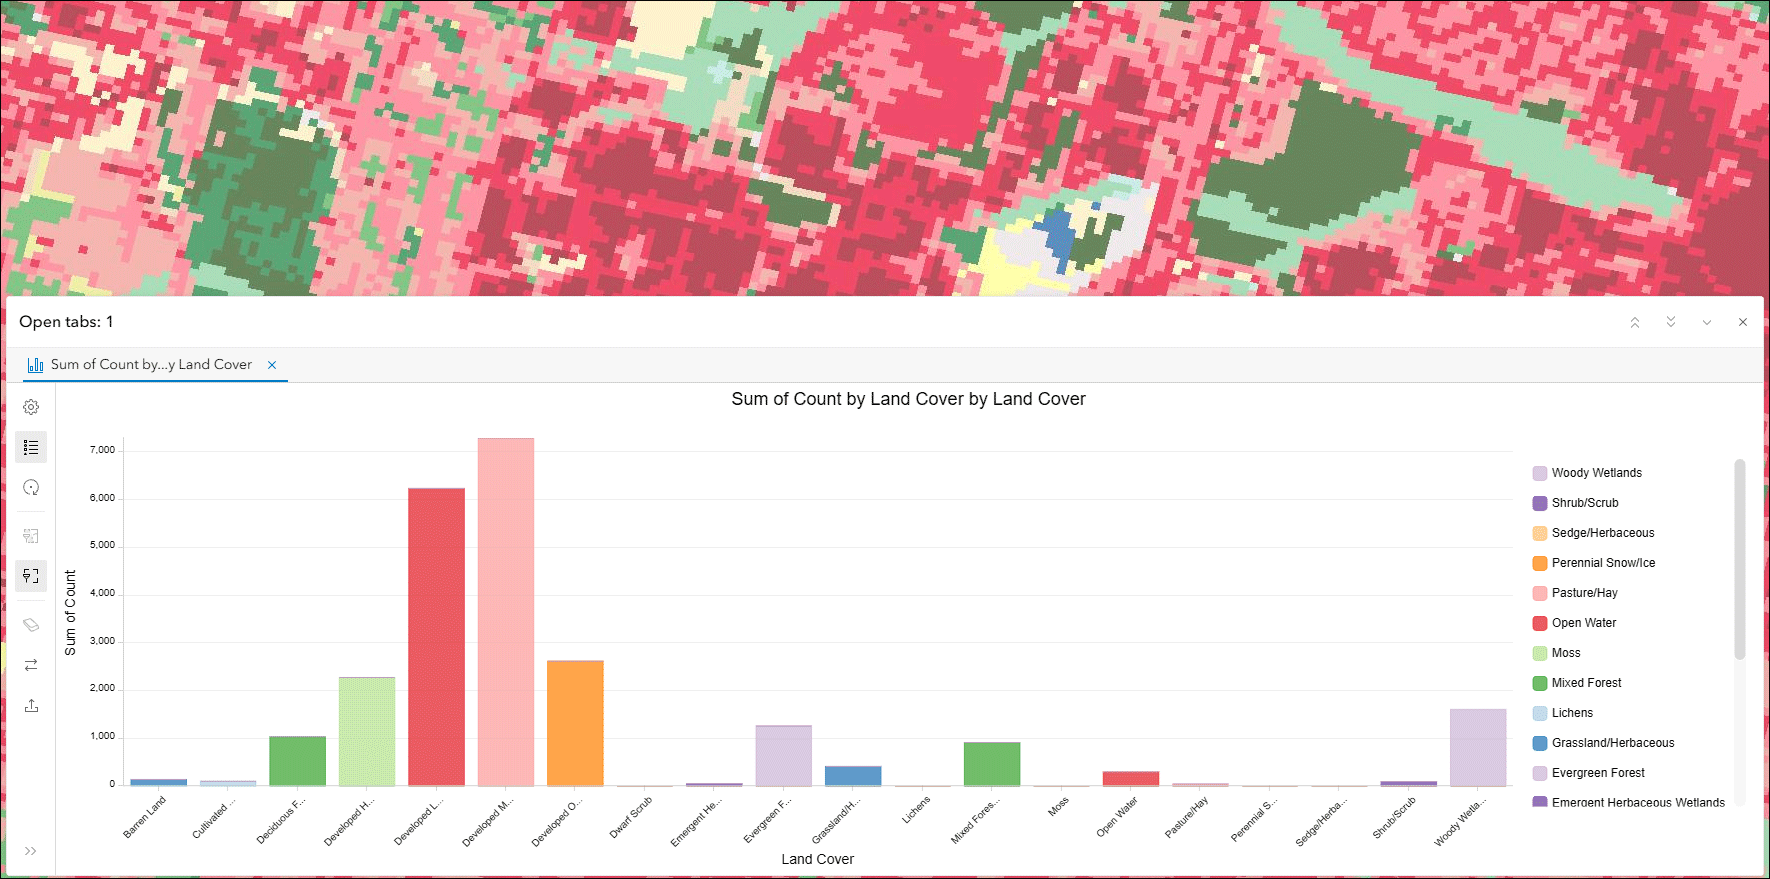
You can analyze imagery directly in Map Viewer by configuring interactive charts to uncover patterns and explore change. You can create bar charts, histograms, and scatter plots from tiled imagery, dynamic imagery, and Web Coverage Service (WCS) layers. No desktop tools or preprocessing is required, making it easier to visually explore data changes. Charts can be saved with the imagery layers and can be opened in any web map, so user don’t have to re-create the charts.
For more information, see What’s new in imagery in ArcGIS Online (June 2026).
Time series enhancements
You can author a unified, time-aware experience in Map Viewer with layer-level time series support. You can configure a time series once and apply it consistently across styling, pop-ups, labels, and the time slider, making temporal analysis and storytelling clearer, faster, and more cohesive.
Custom print layouts
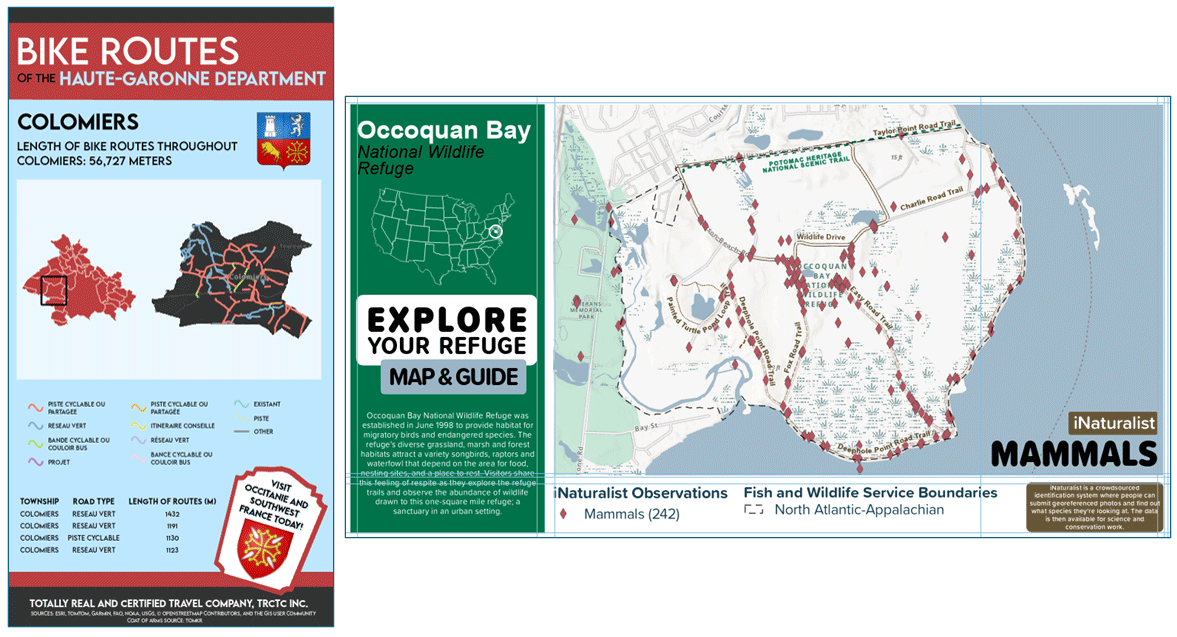
Printing from custom layout templates that have been published as items to ArcGIS Online is now out of beta. These templates can be used to print maps in Map Viewer to create polished, branded map prints and exports. You can control sizing and DPI, add logos and rich elements like legends, inset maps, and dynamic text, without requiring a print server.
Improved sketching
The sketch feature drawing workflow has been updated to expand curve support and improved drawing flexibility. You can now switch between straight lines, Bezier curves, tangent curves, arc segments, and endpoint arc segments while drawing a line or polygon feature.
New editing form options
Forms can be defined for editors to use when they update field values in editable map layers. Forms can be saved as part of the map or layer, enabling others to use them. When configuring forms in Map Viewer, you can now add basic form elements, choice form elements, and attachments.
Enhanced layer styling
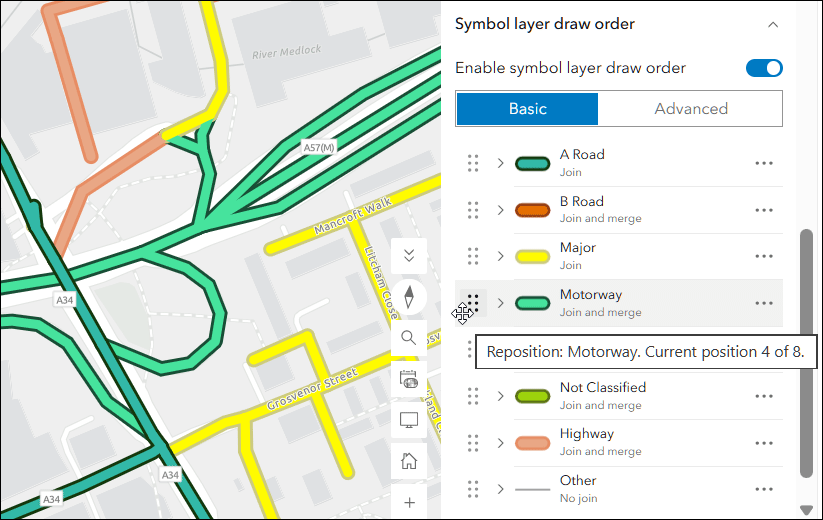
When styling layers, you can now set the symbol layer drawing order for vector point, line, and polygon symbols. You can also lock and unlock individual symbol layers to determine how top-level symbol color and color ramp changes are applied.
Oriented imagery viewer
The following are enhancements to the Oriented Imagery viewer:
- Using the oriented imagery viewer, the Superimpose view allows you to overlay the image displayed in the viewer directly onto a 3D scene. The imagery is applied as a texture to a mesh positioned at its original capture location, enabling a better visualization of how the imagery aligns with surrounding features.
- Sequential navigation of oriented imagery now supports multi‑field sorting, providing customizable navigation workflows. Sorting fields are defined as an ordered array. The fields are processed from first to last, and any field without an explicit direction will be sorted in ascending order by default.
- The Image overlays tool in the oriented imagery viewer now supports layers containing video content.
Parquet feature layers (beta)
Map Viewer now supports Parquet feature layers (beta), a new read-only layer type that leverages the efficiency and scalability of Apache Parquet. Parquet is an open source, column-oriented file format designed for efficient data storage and retrieval. The format is commonly used in big data analytics, and is spatially optimized for fast spatial queries and rendering.
Esri has extended Parquet through the development of spatially optimized Parquet feature layers to support fast spatial queries and high-performance visualization for large datasets. Parquet feature layers can be created using ArcGIS Data Pipelines.
For more details , see Scaling your GIS workflows with the new Parquet feature layer (beta) in ArcGIS Online.
Other enhancements
- You can now customize animation along lines for line symbols in web styles that have been configured with the Move along line animation type.
- Labeling in Map Viewer now includes a variety of new font options, including language-specific and hyper-legible fonts, to support complex scripts, accessibility, and organizational branding.
- When styling imagery layers using the Stretch or RGB styles, you can now access wavelength information (in nanometers) for each band.
For more details and information, see What’s new in Map Viewer (June 2026).
Analysis in Map Viewer
Map Viewer’s spatial analysis tools allow you to quantify patterns and understand relationships in your data. Feature and raster analysis tools and raster functions are available to all members with the appropriate privileges.
New analysis tools
The 80-20 Analysis tool calculates a cumulative percentage field to identify the locations where incidents are disproportionately occurring with respect to spatial distribution. For example, 80% of thefts may occur in 20% of a city’s hot spots, or 80% of wildlife observations may occur within just 20% of habitats. The analysis generates point clusters, lines, or polygons based on the number of associated incidents.
The Detect Target Using Spectra tool computes a matching score for each pixel in an input raster based on how well the pixel’s spectrum matches the target spectra defined by an input spectral signature file, producing a hosted imagery layer as the output.
The Detect Image Anomalies tool creates an anomaly score raster from an input multiband or hyperspectral image. The anomaly score raster is a single-band raster with values between zero and one.
The Resample Library Spectra tool resamples input library spectra to match the number of bands and wavelength range of target spectra from a target sensor, custom spectral library file, or custom image.
For more information about raster analysis tools, see What’s new in imagery in ArcGIS Online (June 2026).
ModelBuilder
ModelBuilder is an interactive canvas for building analysis workflows using the analysis tools available in Map Viewer. Models are created by chaining together data and analysis tools into workflows, where the output of one tool becomes the input for another tool. These workflows can range from routine data management tasks to complex spatial analysis. With ModelBuilder, users can design, execute, and share complex multi-step analysis workflows—entirely within a browser and without writing a single line of code.
The following are new capabilities introduced in this update:
- ModelBuilder workflows can be created and shared as web tools, enabling advanced users to share their custom workflows with a broader audience without the need for additional guidance. With this update, analysis models can be published while the model is in view-only mode, eliminating the need to connect to an active analysis session. In addition, you can now overwrite a web tool published from a model. See Publish models for additional information.
- Variables are elements in a model that hold a value or a reference to data. They are essential when configuring a model for sharing as a custom web tool. Analysis models now support single-value field variables, which can be connected to tools such as Buffer and Aggregate Points that accept field input parameters. This enhancement makes it easier to configure and iterate on tool parameters while expanding the flexibility of analysis models.
- You can now copy and paste elements in a model, including copying elements from one model and pasting them into another, making it easier to reuse and build workflows efficiently.
For additional guidance and best practices, see Getting More from ModelBuilder Online: Tips and Tricks.
Scene Viewer
Scene Viewer is ArcGIS’s dedicated web app for visualizing geospatial data in 3D, from local web scenes to large-scale digital twins. With this update, Scene Viewer has been enhanced with new capabilities and features, including the following:
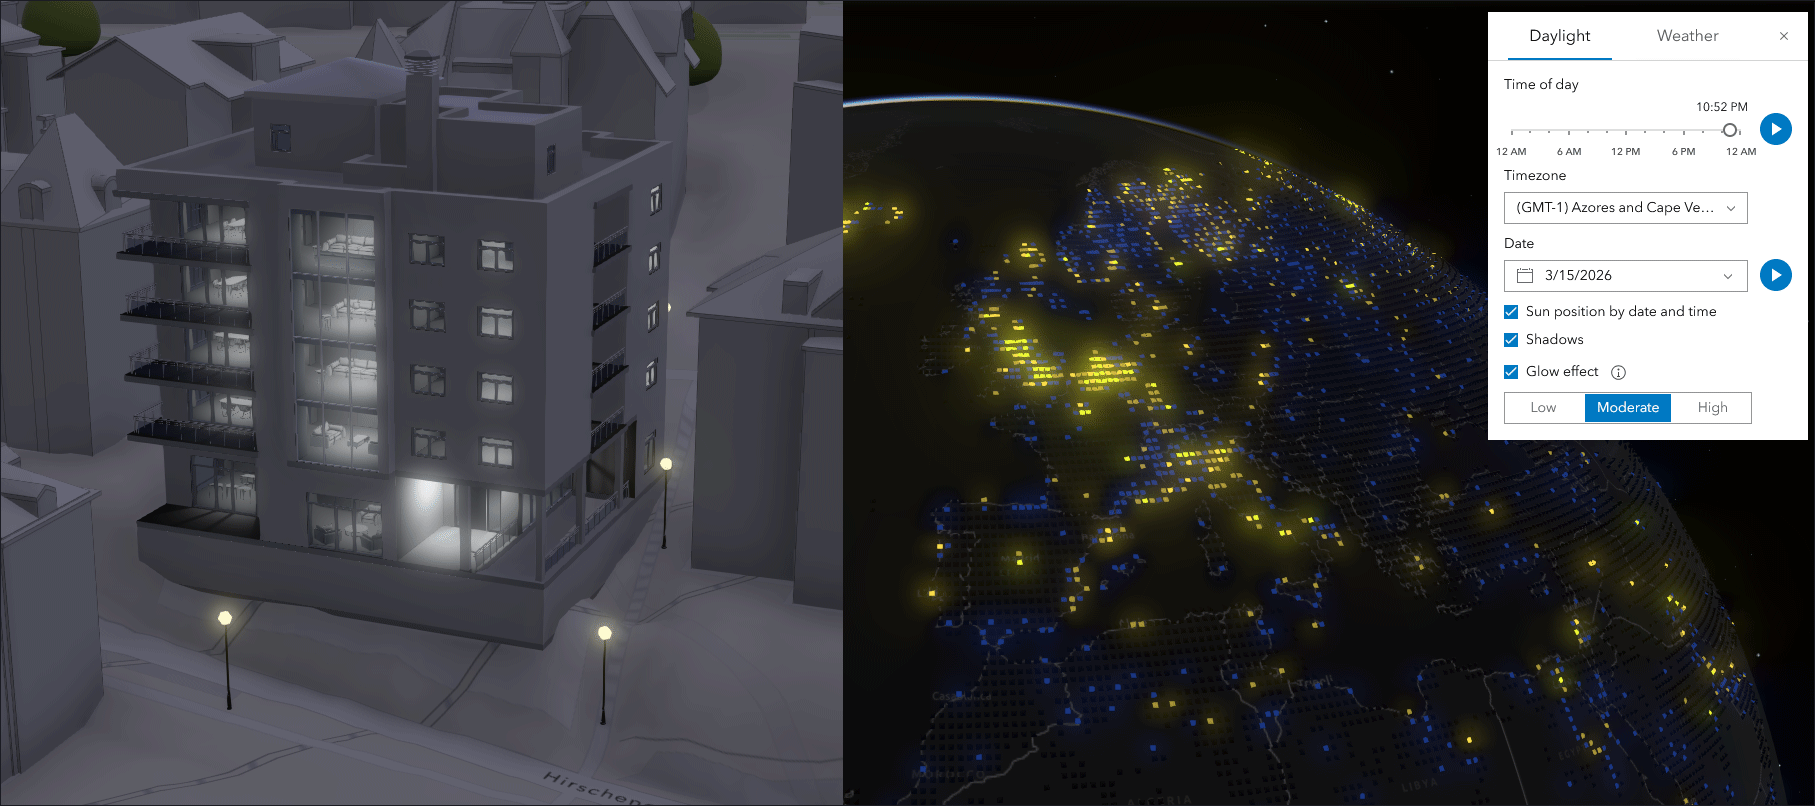
Glow effects
Glow effects for 3D symbols are now available, enhancing your visualizations by highlighting your data, or creating more realistic nighttime scenes. By enabling symbols to emit light, features like buildings and street lighting can be displayed as they actually appear. Glow preserves visibility across scales, making patterns you want to highlight easier to see and interpret at a glance, from local to global scenes.
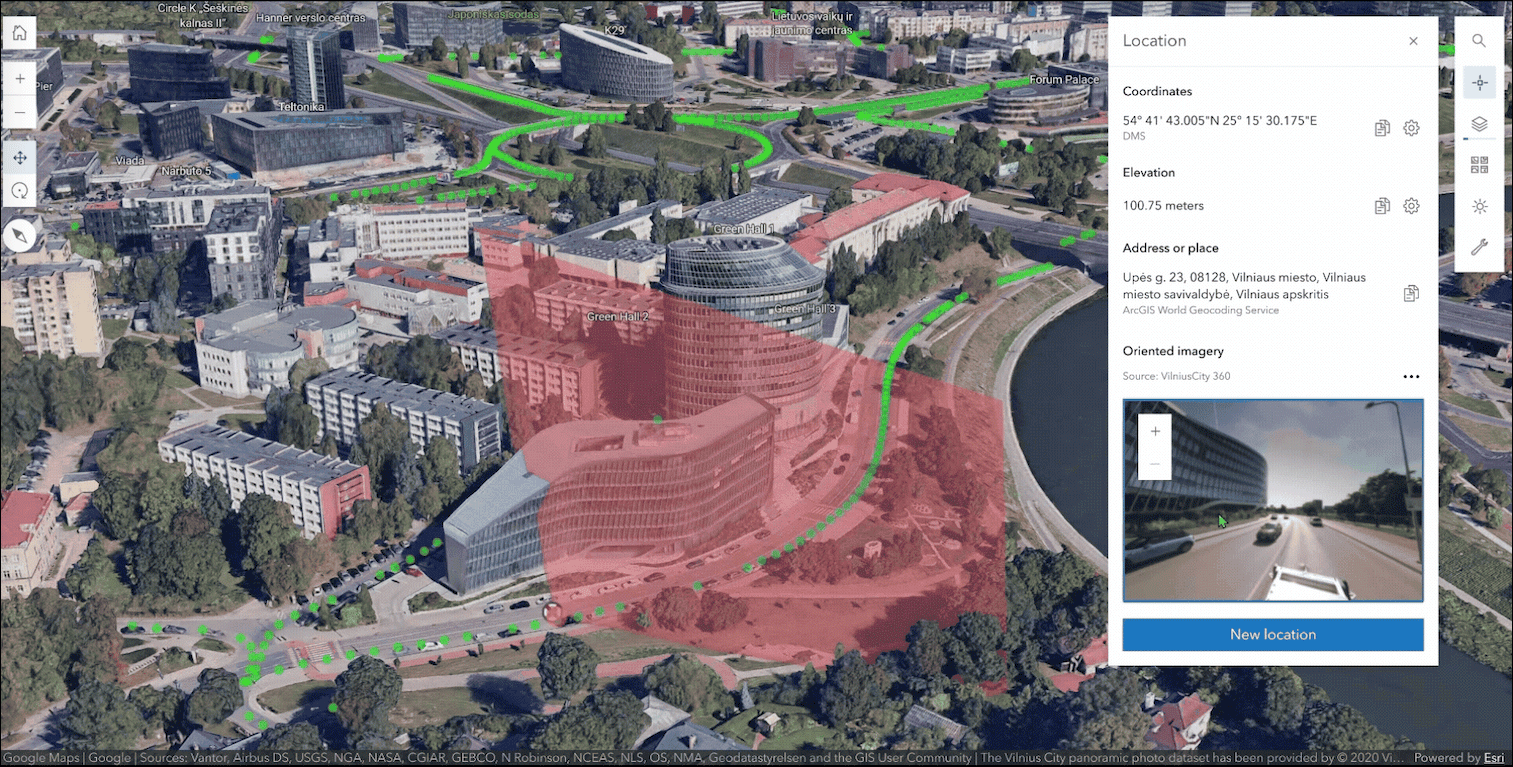
Location tool with support for oriented imagery
Use the new Location tool to view location details in a scene, such as coordinates, elevation, nearest address, and oriented imagery. When there is oriented imagery in the scene, you can click a location on the oriented imagery to display a street-level view of that location.
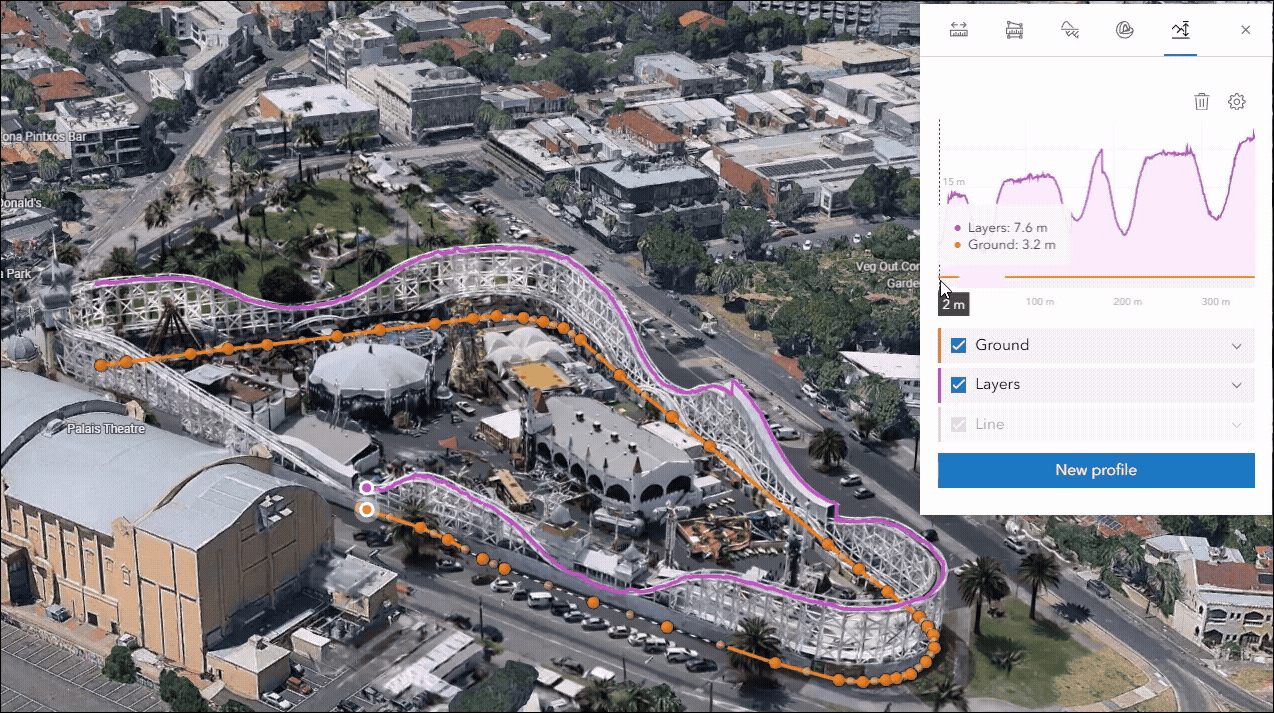
Enhanced Gaussian splat layer analysis
You can now explore Gaussian splat layers with enhanced analysis tools such as elevation profiles and line of sight. Gaussian splat layers bring high -fidelity, photorealistic 3D visualizations to ArcGIS web workflows. Using analysis tools, teams can go beyond visualization to analysis directly within the scene. You can cut through structures to inspect interior clearances with splice, evaluate visibility across a site or corridor with line of sight, and extract profile views to better understand elevation and change over distance with profile analysis.
Google Photorealistic 3D basemaps (preview)
The Google Photorealistic 3D basemaps, Photorealistic and Photorealistic Hybrid, are now out of beta and in preview. When enabled in the organization, the basemaps appear in the Scene Viewer basemap gallery. Using these basemaps, organizations can explore buildings and environments from multiple angles with accuracy and realism and create immersive, photorealistic 3D web scenes for use within the organization. For more details and information, see Google Photorealistic 3D Basemap (preview) in ArcGIS Online and ArcGIS Pro and the Google Photorealistic 3D basemap help documentation.
Other enhancements
- Perform advanced volume measurements (beta), including cut-and-fill and stockpile analysis.
- Control the visibility of markers and labels when they are obscured or underground by setting the visibility behind objects. You can set visibility to hidden, adaptive, or always visible.
- Visualize more complex polygon geometries such as self-intersecting polygons.
- Open featured and recent scenes quickly and access useful resources using the redesigned welcome screen.
For details and more information, see What’s new in Scene Viewer.
Content management
Improved dependency insights
Enhanced item pages now provide deeper insight into content usage and dependencies. Information about where an item is used, and what other items use it, is now provided for additional item types.
For example, the Overview tab of an Instant App item page displays the web map used in the app and the layers in that web map.
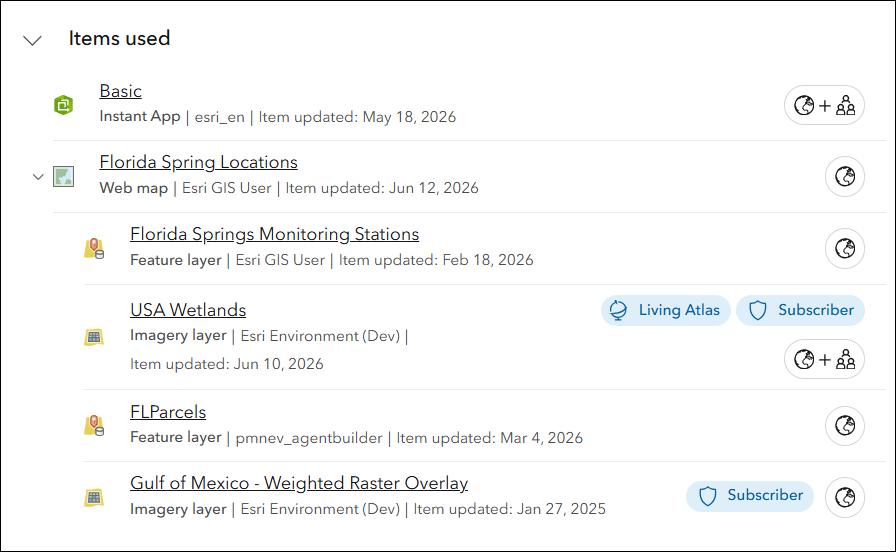
Item owners and organization administrators can also access a list from the Usage tab that indicates where an item is used. Additionally, organizations can now designate replacement items for deprecated or retired content, helping guide users to recommended alternatives and supporting smoother transitions. For more information, see Discover how your layers, scenes, maps, and apps connect.
Item details assistant (beta)
Metadata, information about your content, is essential for making geospatial data reusable, discoverable, and AI-ready. The Item Details assistant (beta) helps jumpstart and further enrich essential metadata elements directly on the item page, and is available in ArcGIS Online and ArcGIS Enterprise 12.0.
The Item Details assistant (beta) now supports additional item types beyond hosted feature layers, views, and tables, and can now be used with the following:
- Elevation layer
- Geoprocessing service
- Hosted imagery layer
- Hosted tiled imagery layer
- Hosted tile layer (raster)
- Imagery layer
- Map image layer
- Web tool
This expanded support makes it easier to create high-quality metadata across more items in ArcGIS Online.
For more information, see Introducing the Item Details assistant (beta). You can also join the Early Adopter Community to share feedback, connect with the product team, and help shape future enhancements.
Improved field management
Field value types now support designating a field to store URL values. This is a new option added to the field values panel that allows you to define a delimiting character when you store lists of values in string fields. To improve data accuracy, you can define which values for a set of fields in a layer or table are interdependent and contingent on one another. When you define these contingent values, you can restrict what values editors add to specific fields.
Parquet feature layers (beta)
Parquet feature layers (beta) are a new read-only layer type that leverages the efficiency and scalability of Apache Parquet, an open source, column-oriented file format designed for efficient data storage and retrieval. The format is commonly used in big data analytics, and is spatially optimized for fast spatial queries and rendering. Parquet feature layers can be created using ArcGIS Data Pipelines.
Other enhancements
- When you create an empty 3D object layer, you can specify the horizontal and vertical coordinate systems for the new 3D layer and its associated feature layer.
- You can define a filter to restrict which features are added to or updated in a hosted feature layer when you update using another feature layer.
- The item page for some item types displays the coordinate system stored with the item.
- You can now view distributed collaboration details, such as sync status and permissions, on the Overview tab of the group page.
- See the ArcGIS Arcade release notes for information about new and improved functionality in the latest Arcade releases.
For an overview of managing content in your organization, see Manage content.
Accounts and administration
Improved status dashboard
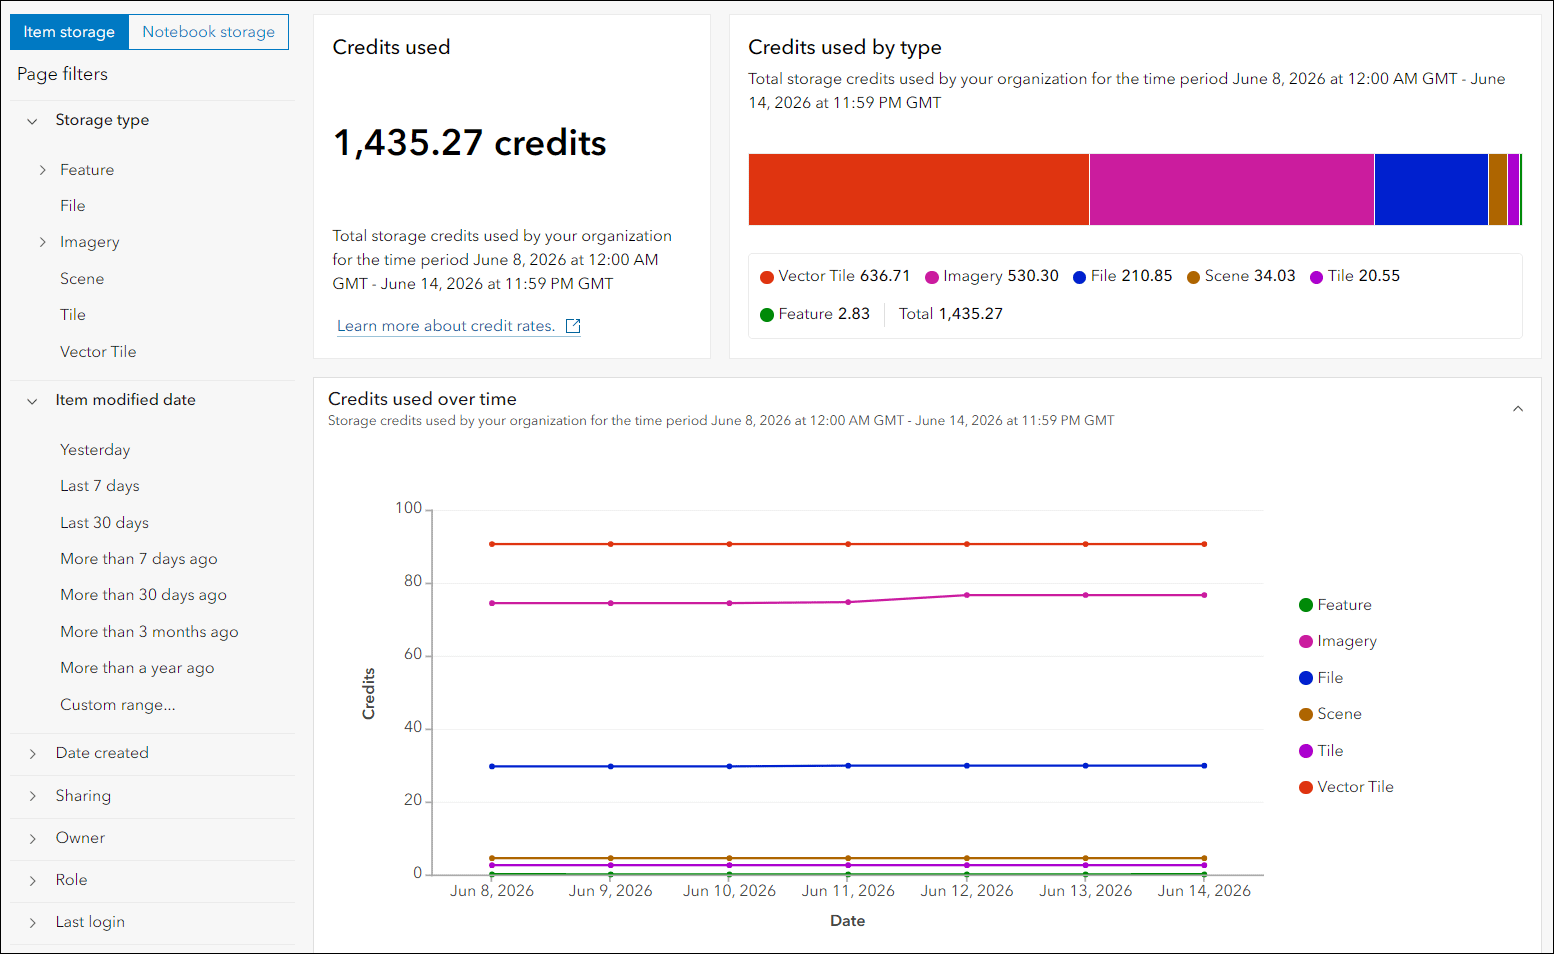
A newly redesigned organization status dashboard provides administrators with detailed information into credit usage in the organization. Interactive charts and tables provide information about credits used for storage, transactions, and sessions, as well as details about daily app usage. Pre-set and custom date range options, page filters, and drill-through capabilities allow administrators to access specific credit usage information—for example, the number of credits used for hosted feature layer storage in the last 30 days.
Update member login types
Administrators can update member login types, such as changing ArcGIS logins to SAML logins, without re-creating user accounts. This streamlined workflow simplifies identity management and reduces administrative overhead.
Other enhancements
- Members assigned a custom role with a specific set of privileges can now be designated as collaboration coordinators in a partnered collaboration. Administrators can assign this custom role using the new Collaboration Coordinator Template, a new built-in role template.
- Role management transparency has been improved through clearer messaging for privilege dependencies, making it easier for administrators to understand role requirements and configure permissions.
For an overview of administering accounts in your organization, see Manage members.
AI
AI assistants
Three AI assistants have reached general availability: ArcGIS Survey123, ArcGIS Business Analyst, and the translation assistant. Included in user types at no additional cost, each assistant uses natural language to help you work faster and more confidently. The Survey123 assistant guides you through building and refining surveys, the Business Analyst assistant recommends workflows, data, and infographics to help you quickly discover insights, and the translation assistant makes it easier to share content with audiences across different languages.
Agentic AI (beta)
Available in beta, ArcGIS Online brings the ability to build agentic mapping applications with natural language map and data exploration, with or without code, using the ArcGIS Maps SDK for JavaScript and the new Data Explorer template (beta) in ArcGIS Instant Apps. Learn more about the Data Explorer template in the ArcGIS Instant Apps section below.
For more information, see Available AI assistants and other geospatial AI capabilities and What’s new in AI assistants (June 2026).
ArcGIS Instant Apps
ArcGIS Instant Apps are lightweight, configurable web applications that allow users to quickly create and share interactive maps and apps without the need for extensive coding or development skills. The templates feature a streamlined experience that lets you build apps quickly and easily using express or full setup modes. All Instant Apps templates can be found on the searchable Instant Apps home page.
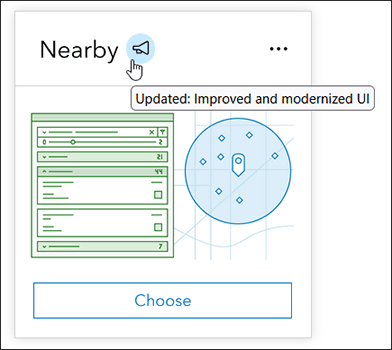
ArcGIS Instant Apps templates are regularly updated. On the Instant Apps home page, look for and hover over the announcement badge to learn more about any new or beta templates, plus updates to existing templates.
Instant Apps updates
Atlas enables organizations to highlight a collection of curated maps and layers. It’s an effective way to enable non-GIS users to make their own maps and explore your organization’s content. Atlas introduces a more intuitive and flexible user experience across devices. Enhancements include an improved map and layer selection, the ability to set default units for measurement and elevation profile tools, larger, more accessible map widgets optimized for presentation, mobile, and tablet use, and layout refinements.
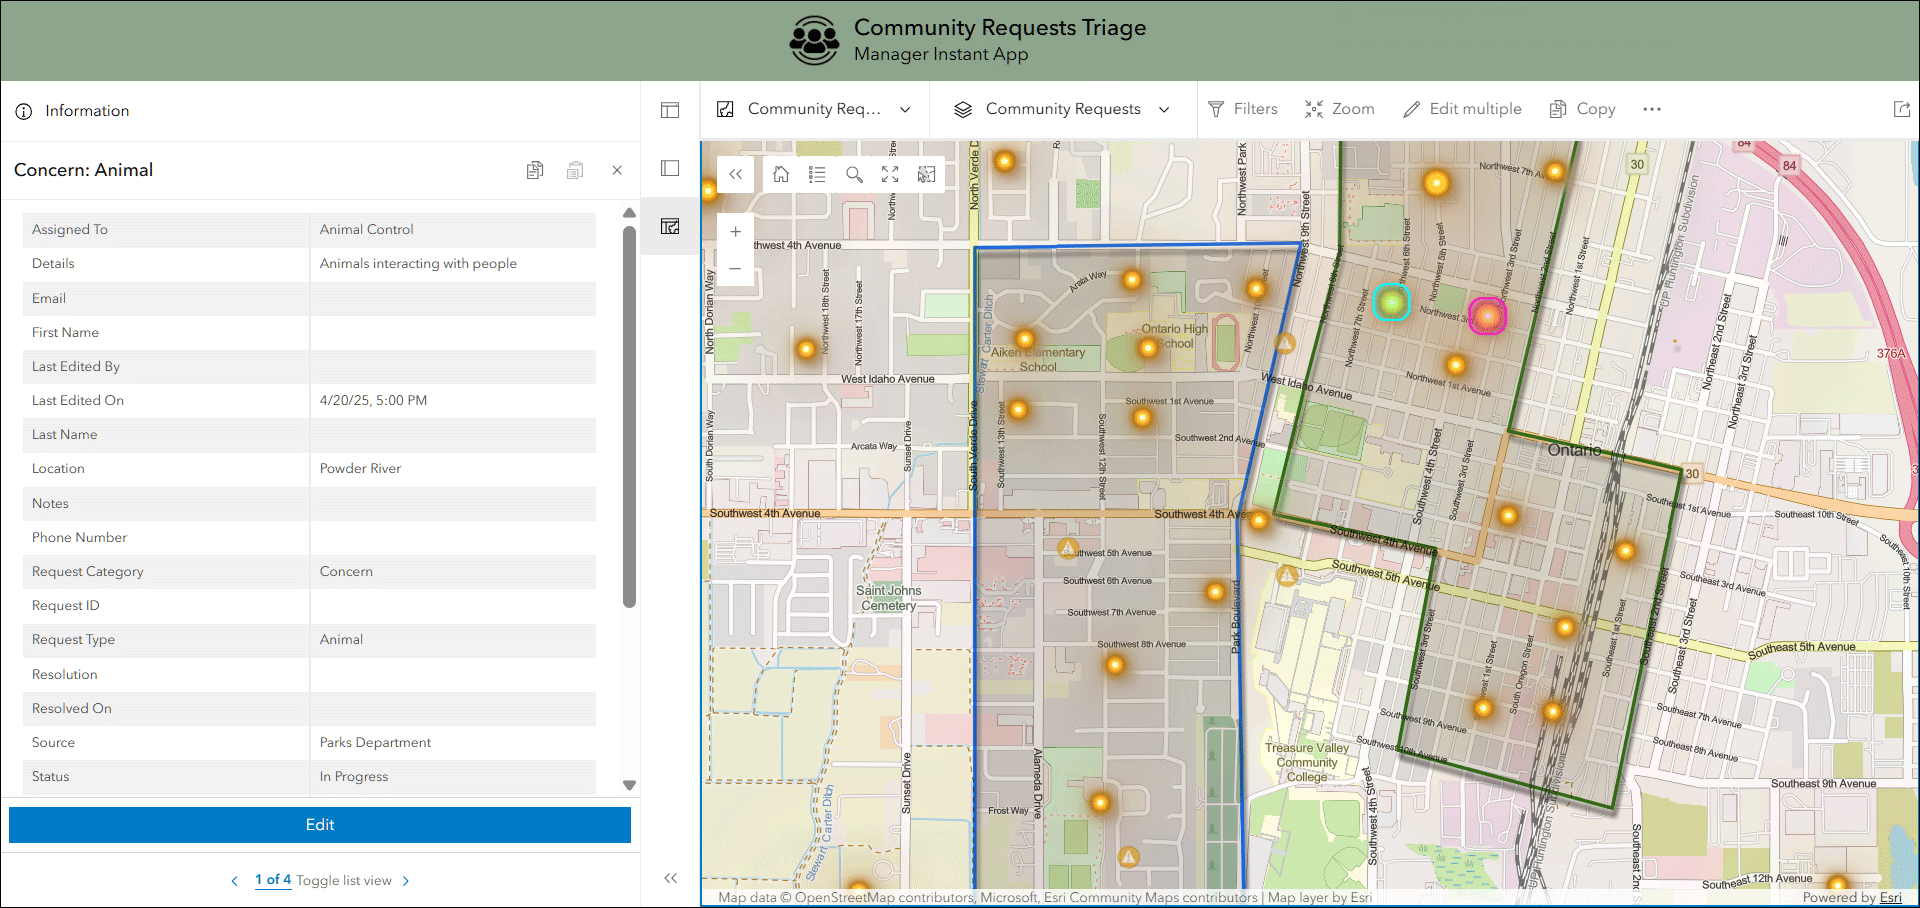
Manager offers users the ability to review and edit features on one or more maps. Users can also edit attributes, attachments, and related feature records. The Manager template now supports copy and paste between layers and bulk feature creation to streamline editing workflows, saving time, improving consistency, and helping minimize errors.
Compare delivers the ability to choose between modes to compare multiple maps at the same location, or compare multiple locations in the same map. Compare’s multiple maps mode now enables you to select more than four maps to display in a drop-down menu for app users to choose from.
Nearby helps users find focused types of locations (such as schools) within a search distance of an address, their current location, or other place they specify. They can adjust distance values to change the search radius and get directions to locations they select. The template introduces an improved and modernized user experience.
Gallery enables you to present items from a group that can be filtered, searched, viewed, and explored by app users. You can choose to filter content using group categories or organization categories. Information is displayed on item cards, including summary text, date created or modified, item type, view count, item owner, and more. Apply content filters and share the filtered app with a URL or to social media. Category now replaces Category Gallery; existing apps transition automatically with no action required.
Early access templates
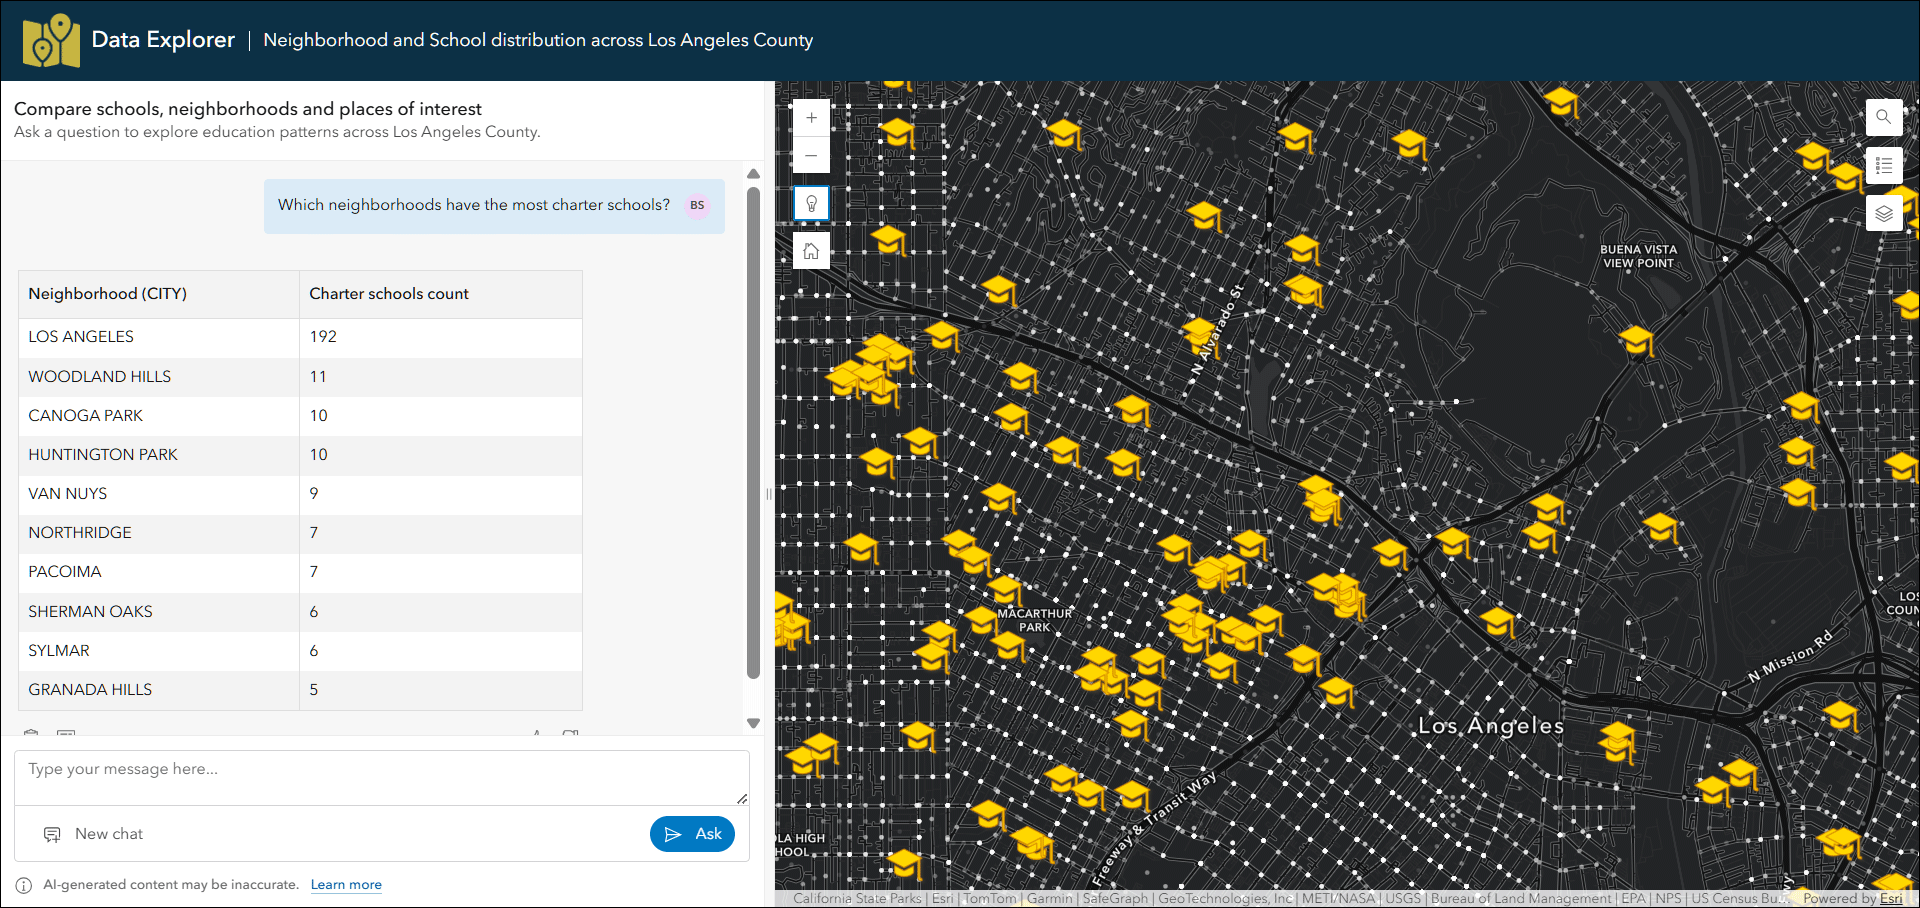
Data Explorer (beta) uses AI to turn everyday language into insights, helping users discover patterns, filter data, and visualize results in maps and tables without complex tools. Data exploration is now accessible to non-GIS users who can ask questions and start exploring, without the need for knowledge of GIS terminology, menus, and complex query syntax.
For more information, see What’s new in Instant Apps.
ArcGIS Experience Builder
Use ArcGIS Experience Builder to build modern mapcentric or non-mapcentric web apps and webpages without writing code. Start building from scratch, or choose from an extensive library of templates that you can customize. You can add functionality to any template with widgets you can drag, drop, and configure. You can also add custom widgets, themes, and actions with low-code development to further extend your web app.
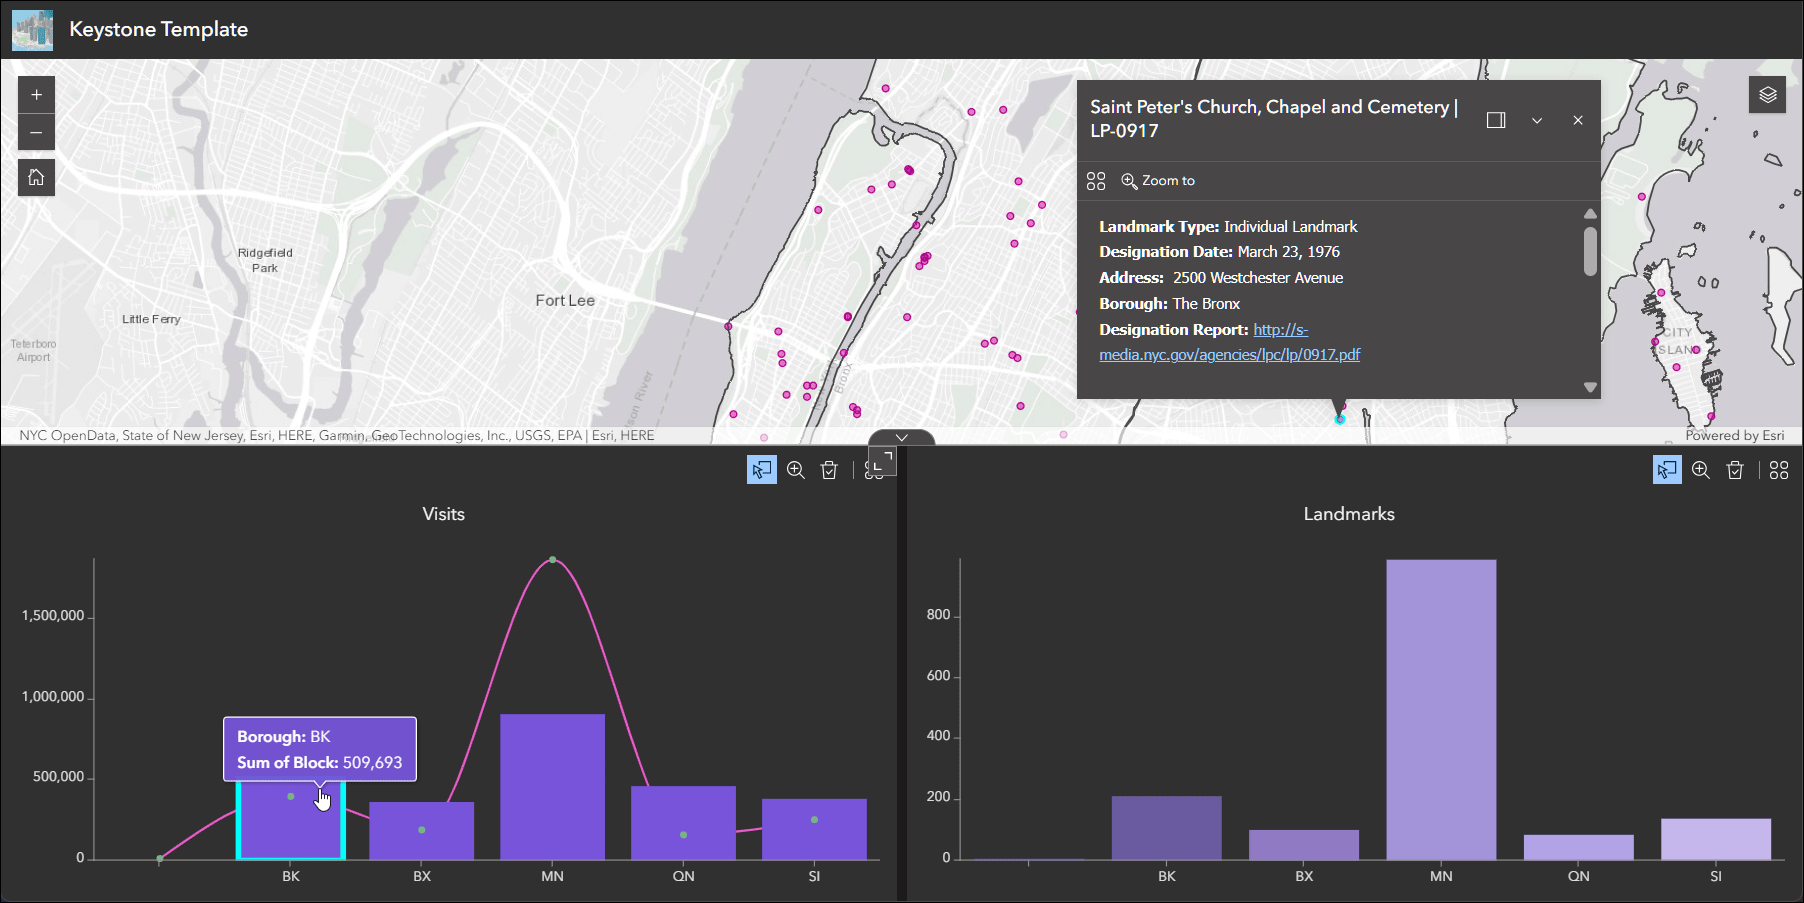
New Keystone template
Keystone is a new template introduced with this update. It’s a map-centric template featuring a split layout with a top map widget and side-by-side chart panels below.
Translations
ArcGIS Experience Builder adds support for adding translations for app text. In general settings, you can enter translations manually or generate translations with the translation assistant.
New widgets
- The Image Change Detection widget compares two input imagery layers and shows differences.
- The Language Switcher widget is a drop-down menu that switches the app language at run time.
- The QuickCapture widget integrates with ArcGIS QuickCapture and allows you to add a field data collection tool to an app.
Other enhancements
Other enhancements include a new combination line and column chart type in the Chart widget, support for saving multiple edited fields at the same time with the Table widget, and support for printing from custom print layouts with the Print widget.
For more information, see What’s new in Experience Builder.
ArcGIS Dashboards
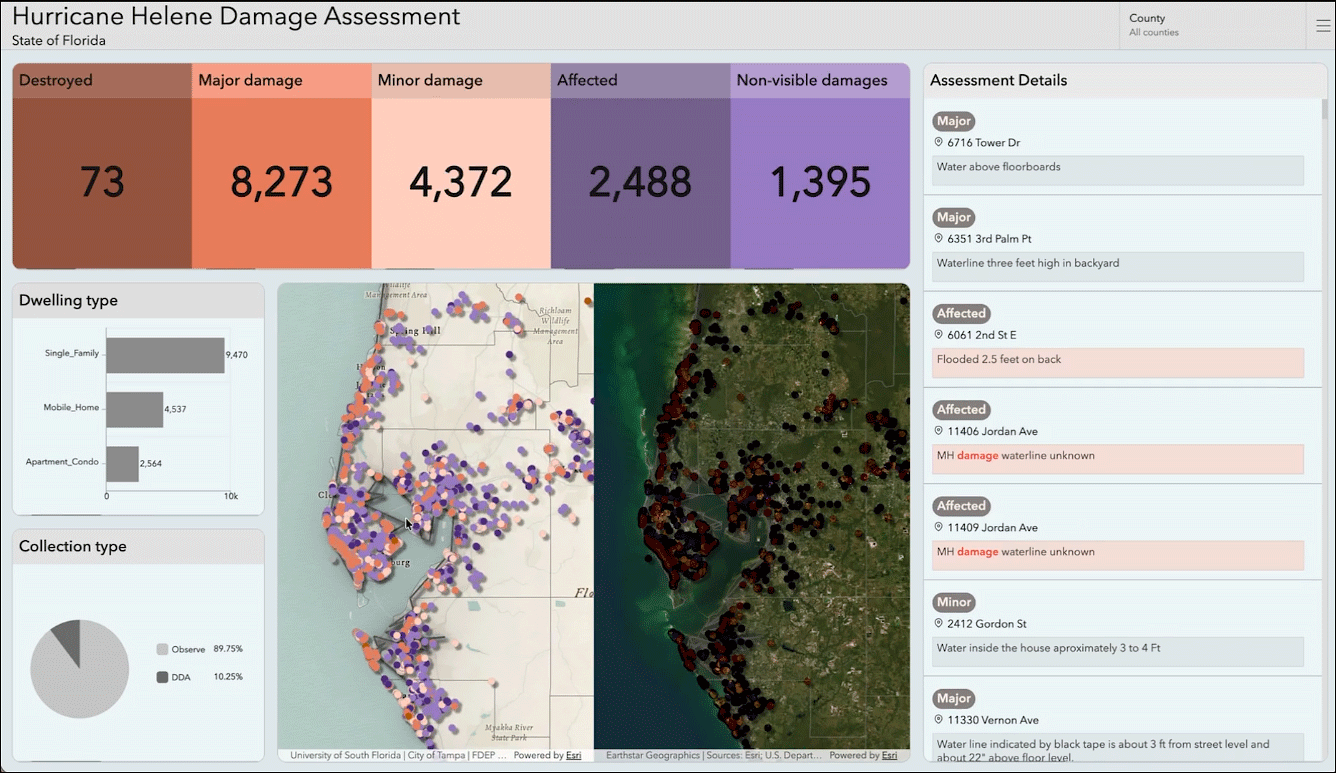
ArcGIS Dashboards enables users to convey information by presenting location-based analytics using intuitive and interactive data visualizations. Dashboards are used to help make decisions, visualize trends, monitor status in real time, and inform their communities.
Enhanced performance and usability
The June 2026 update of ArcGIS Dashboards delivers a significant number of enhancements and changes that are designed to make Dashboards faster and easier to use, while continuing to fully support existing Dashboards. Dashboards will be noticeably faster with reliable performance even under high demand use, with behind the scenes improvements to request payloads and reduced memory usage enabling efficient scaling with demand.
Focus mode
Authors can now control which dashboard element viewers can expand by enabling the new Focus mode on specific elements, rather than allowing viewers to expand an element by default. To help viewers understand where expansion is available, expandable icons appear within the element menu instead of across the dashboard, keeping dashboards visually cleaner while giving authors more control over how content is explored.
Improved indicator text scaling
Indicator text scaling ensures consistent, easy-to-read indicators across any device. New text settings give authors precise control over sizing and emphasis, while standardized text scaling prevents unpredictable shrinking or stretching. This results in dashboards that stay visually aligned, readable, and easy to scan as values update.
Data-driven rich text
This enhancement transforms the rich text element from static annotation into a dynamic, data-driven component. Rich text now supports the configuration of an optional data source, making dashboards more informative, interactive, and actionable. Organizations can move beyond static displays to communicate data-driven information in near real time.
Improved selectors
Modernized selectors are introduced that make dashboards simpler, clearer, and more intuitive to use. Enhancements to category and date selectors improve usability, clarify behavior, and deliver a smoother, more predictable experience while maintaining full support for existing dashboards
Other enhancements
- Dashboards now support bidirectional layouts. Authors can configure left-to-right, right-to-left, or inherited layout direction, ensuring dashboards align with user expectations across different languages and regions.
- ArcGIS Dashboards now use the same pagination controls introduced in ArcGIS Online map pop-ups across all feature-based elements (Details, Indicator, List, Table, Gauge). This delivers a consistent experience for navigating multiple features within a dashboard.
For more information, see the What’s new in ArcGIS Dashboards help topic or the What’s new in ArcGIS Dashboards blog article.
ArcGIS StoryMaps
Use ArcGIS StoryMaps to combine maps, 3D scenes, embedded content, multimedia, and more into an interactive narrative that can create awareness, influence opinion, and affect change. The easy-to-use builder helps you create digital stories and presentations called briefings that incorporate your GIS work and external content. Stories and briefings can be organized into collections and customized with themes.
The following are highlights of recent changes and enhancements.
Frames
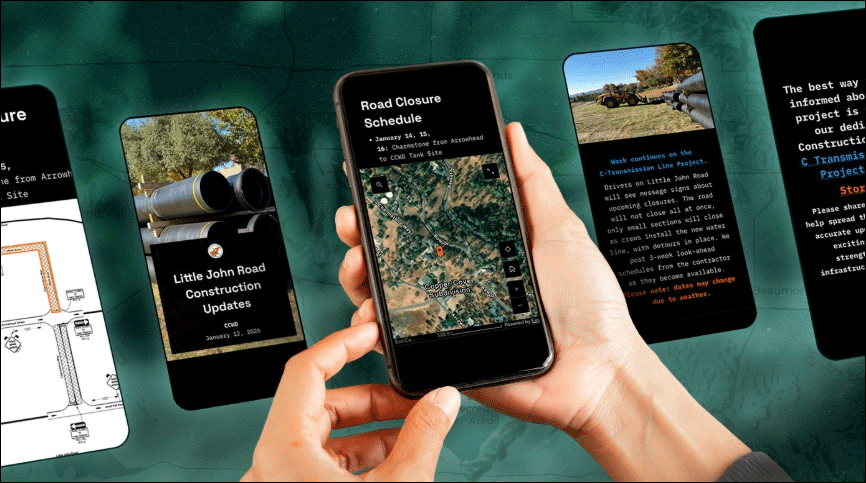
Frames are a short-form storytelling experience designed for a mobile-first audience. Frames provides the capability to author stories optimized for social media, driving engagement across networks.
Frames supports the embedding of ArcGIS apps alongside interactive maps, enabling authors to deliver data-driven stories in a format that is interactive and easy to navigate.
For more information, see Create a frame.
Outline
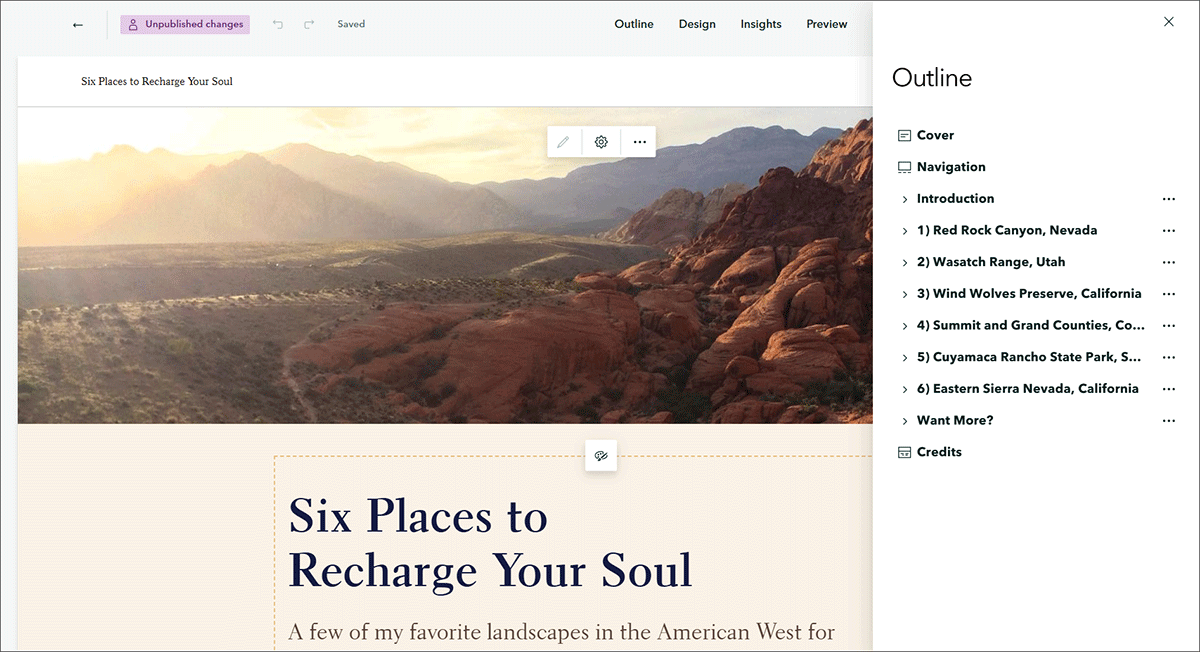
Introduced in the authoring experience, Outline provides a more structured way to organize your stories. Authors can drag and drop entire sections directly within the panel, making it easy to rearrange ideas, spot gaps, and ensure the narrative flows exactly as intended. Outline delivers a clear view of the story’s structure, eliminating the need for scrolling or manual cutting and pasting.
New infographics
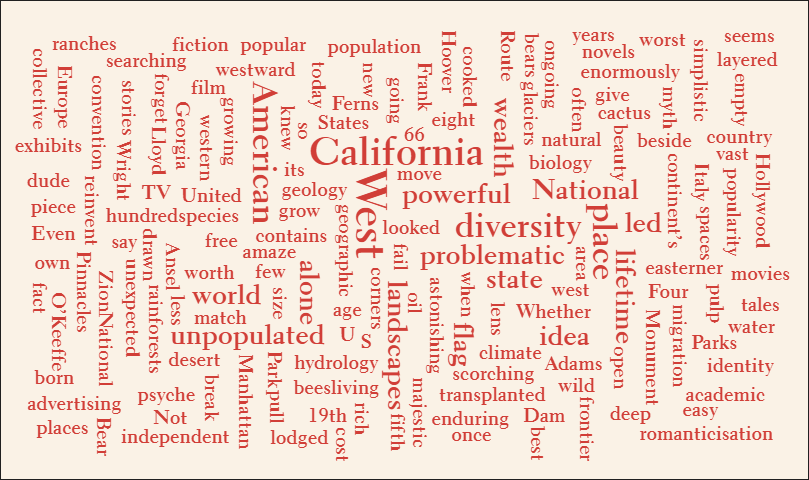
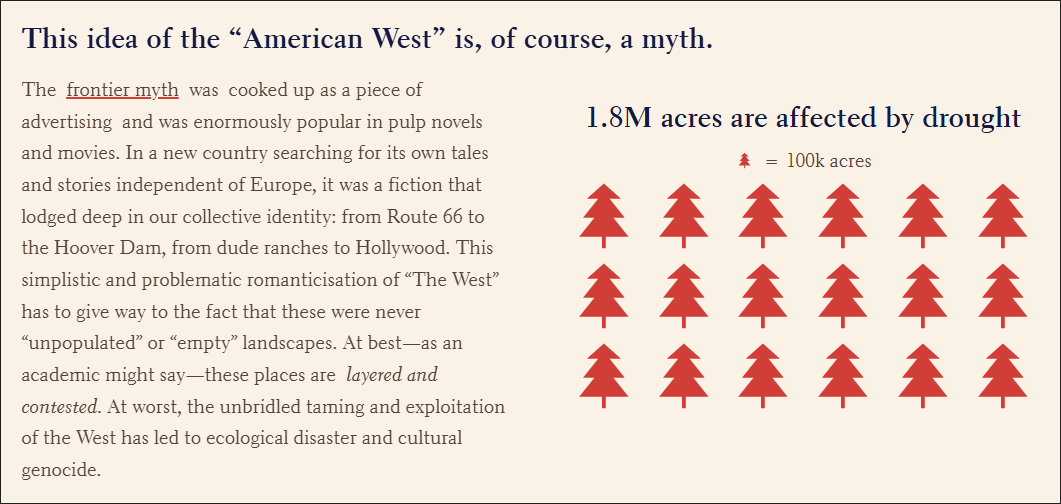
A core component of geospatial storytelling is using visuals to help communicate complex topics. Two new infographics have been added: Word clouds and Pictographs.
Word clouds reveal patterns in your text, enabling readers to quickly identify key topics or sentiments. You can think of them as the textual equivalent of a map overview, offering a zoomed-out view of your narrative.
Pictographs provide an icon-based view of numbers. They allow you to communicate a statistic or magnitude at a glance making your message more engaging and visual.
Other enhancements and additions
- Select Import Document to upload a PDF or Microsoft Word file to jumpstart your story creation. StoryMaps will automatically analyze the content and pull in titles, sections, text, and visuals to create a ready-to-edit story. From this starting point, you can quickly refine and customize your story.
- Add backgrounds to briefings, giving you more control over the look and feel of your presentation. Whether it’s a solid color, gradient, or an image, a thoughtfully chosen background can reinforce your narrative and help audiences stay engaged.
For more information about recent additions and enhancements to ArcGIS StoryMaps, see:
- What’s new in ArcGIS StoryMaps (March 2026)
- What’s new in ArcGIS StoryMaps (May 2026)
- What’s new in ArcGIS StoryMaps (June 2026)
For all blogs related to ArcGIS StoryMaps, see the ArcGIS StoryMaps blog.
ArcGIS Hub
ArcGIS Hub is an enterprise‑class data sharing, collaboration, and engagement platform designed to help people work together to address shared challenges. Through geo‑enabled websites, Hub provides a common space to organize people, unify content, and engage your community of practice.
ArcGIS Hub is included with every ArcGIS Online subscription and enables organizations to create data-driven sites that support and engage their communities through shared apps, maps, and open data.
ArcGIS Hub Premium builds on these capabilities with advanced tools for stakeholder collaboration and community engagement within and across organizations, including support for events, discussions, and greater configurability. Hub Premium also extends your reach through community member accounts, enabling deeper participation, sustained engagement, and capacity building.

New and enhanced features and capabilities for this update include the following:
ArcGIS Hub workspaces
ArcGIS Hub workspaces provide the interface for managing items and members in ArcGIS Hub. Classic edit mode is now retired and replaced by the Hub workspace. If you’ve previously opted out of workspaces, you are now automatically opted in. See the deprecation notice for details on workflow changes.
Workspaces include the familiar workflows you rely on every day and many new features to help you, including the following:
- Create and manage sites and pages
- Manage and share trusted content using standards-based catalogs
- Engage external stakeholders and community members (ArcGIS Hub Premium)
- Track and share progress on initiatives and projects (ArcGIS Hub Premium)
- Boost collaboration with events and discussions (ArcGIS Hub Premium)
View the ArcGIS Hub: Workspace overview video for more information.
ArcGIS Hub assistant (beta)
You can now configure the ArcGIS Hub assistant (beta) search agent for anonymous access. This configuration allows members of the public to use the search agent on your Hub site without signing in to an ArcGIS Online organization. This setting is only available when configured for public access. See AI in ArcGIS Hub for more information.
ArcGIS Hub Discussions
ArcGIS Hub discussions provide the ability to have content-based conversations within channels. Hub users can now subscribe to discussions to receive weekly emails about thread activity such as new posts and replies. Other enhancements to discussions include new default roles for channel members and managers.
ArcGIS Hub Events
ArcGIS Hub events are a way to share details about upcoming meetings, openings, programs, and other activities related to a site, initiative, project, and more. Several enhancements for events are now available, including sub-addresses to specify room number or building for in-person events, image uploads for event thumbnails, and updates to the event view. Along with these enhancements, classic events have now been retired.
For more information, see What’s new in ArcGIS Hub (June 2026).
ArcGIS Web Editor
ArcGIS Web Editor is a data editing application in ArcGIS Online that streamlines data maintenance workflows. Web Editor provides a straightforward approach to editing for GIS and non-GIS users. The wide array of editing tools can be used for complex editing workflows.
This update focuses on behind-the-scenes quality and performance improvements, along with enhancements and new functionality as follows:
Form enhancements
The Multiple Choice element is a new feature that form authors can add and configure when building forms. This element enables editors to select more than one answer to a question, making forms more flexible and accommodating for a variety of use cases.
The new Attachment element gives form authors more control and customization options of how attachments should be uploaded, and enables editors to choose from three different attachment types: General, Media, and Document.
See Configure forms for attribute editing for more information.
Other enhancements
- In addition to the existing curve tools in the editing toolbar, the Tangent curves tool has been added.
- When snapping to more than one feature with z-values, users can now choose which feature provides the z-value, reducing ambiguity and improving confidence in editing results.
- When selecting different types of curves to draw, an example GIF of each curve type now appears.
See the Discover what’s new in ArcGIS Web Editor blog article or the What’s new help topic for more information.
ArcGIS Notebooks
ArcGIS Notebooks delivers a Jupyter notebook experience built for ArcGIS, enabling users to combine spatial analysis with open-source Python libraries to create advanced data science workflows. ArcGIS Notebooks streamlines dependency management across the Python ecosystem while improving collaboration, transparency, and reproducibility across teams.
Notebooks combine code, on-the-fly visualizations and maps, and data tools. In the notebook editor, you can write, document, and run Python code in one place.
Updates for Notebooks include the following:
- The ArcGIS Notebooks assistant (beta) uses artificial intelligence (AI) to write, explain, and troubleshoot Python code. The assistant generates Python code that is compatible with the latest version of the ArcGIS API for Python using natural language instructions. You can now access the Notebooks assistant on the top ribbon of the notebook editor.
- New versions of ArcGIS API for Python, ArcPy, and Python Libraries are now available in the notebook runtimes (version 14.0).
For more information, see Get started with notebooks.
ArcGIS Data Pipelines
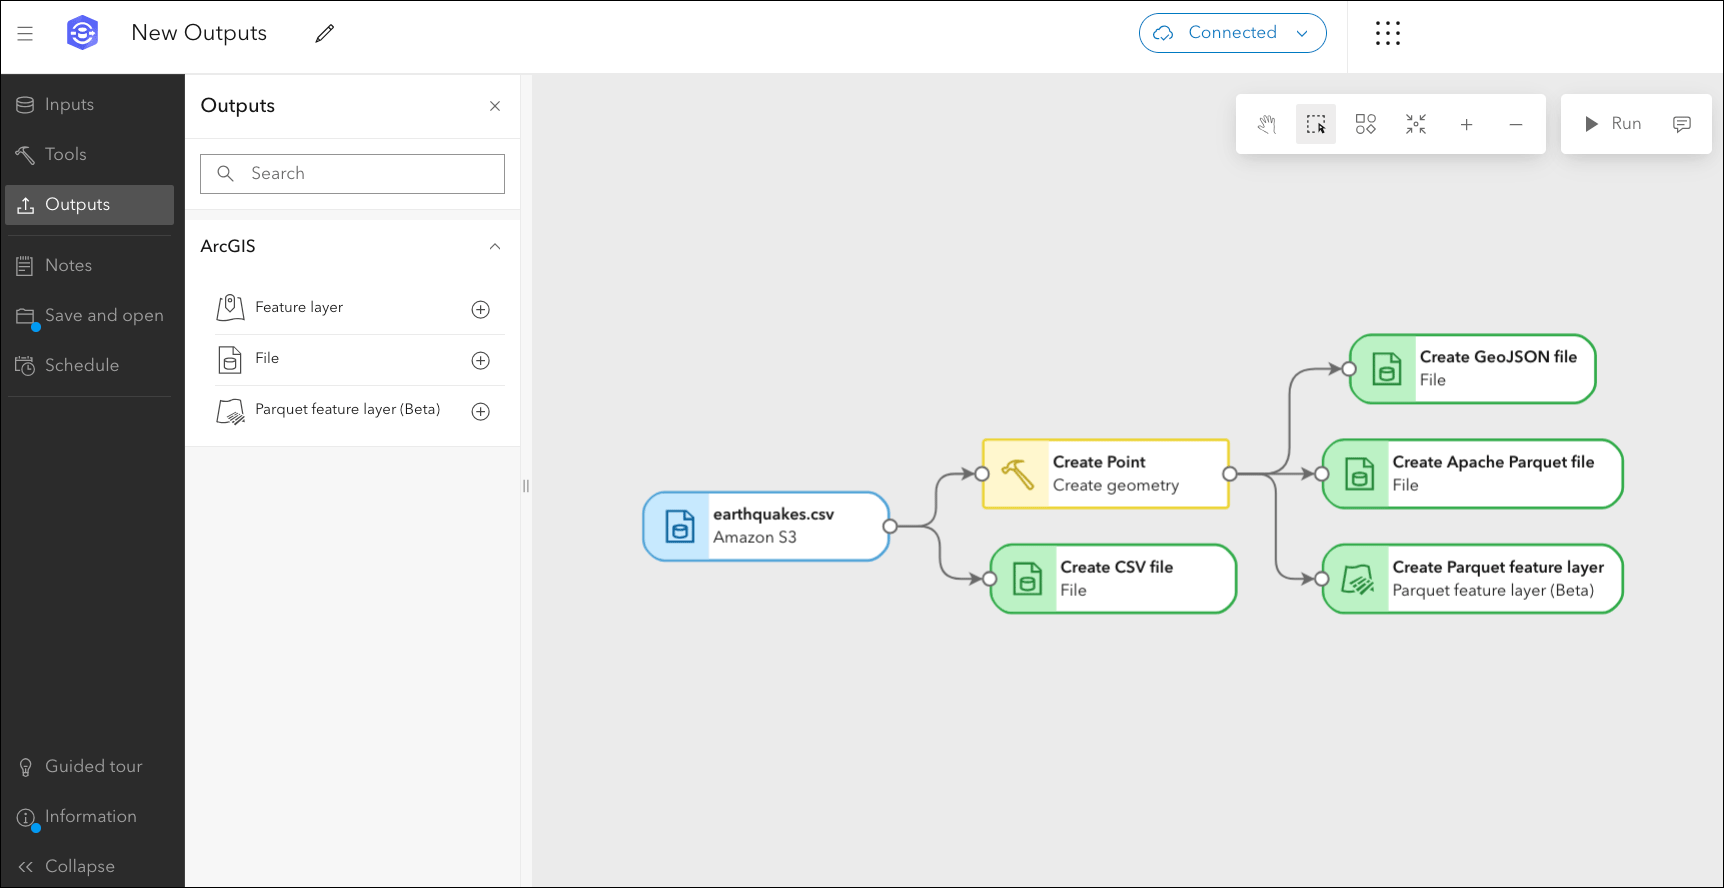
ArcGIS Data Pipelines is a no-code, visual data engineering capability that makes it easy to prepare and integrate data for mapping and analysis workflows. With a drag-and-drop app, you can connect to a variety of data sources, apply common data preparation tools, and publish the results to hosted layers or files in your content. Data pipelines can be run on demand or scheduled to run automatically, reducing manual effort and ensuring your organization’s data stays current and ready for use.
Updates include the following new capabilities and enhancements:
New inputs
You can use the Parquet feature layers (beta) you create using ArcGIS Data Pipelines as an input data source. This new layer type stores data as spatially optimized Parquet, enabling efficient storage and fast visualization of large datasets. It is designed for exploration and display workflows in web clients, rather than analysis, and provides an alternative to the existing feature layer output.
New tools
- Create buffers: A spatial data management tool used to create areas around input geometries.
- Find and replace: A tool for modifying and standardizing field information. You can replace specific strings or null or empty strings with new values.
Enhanced tools
- Calculate field: You can now leverage the ArcGIS Arcade assistant (beta) and debugging capabilities while authoring Arcade expressions in the Calculate field tool. This enables you to generate Arcade expressions more efficiently from instructions typed in natural language.
- Update fields: You can now choose which string format to use when converting geometry, date, or date only fields to strings. For example, you can choose to convert a geometry field to a WKT string format.
- Filter by attribute: The query builder now supports direct SQL input in addition to the guided query builder.
New outputs
- Parquet feature layer (beta): Write your results to a Parquet feature layer. This output is intended for downstream visualization workflows for static data. Parquet feature layers are read-only and are not currently supported for input to analysis tools or for use in ArcGIS Pro.
- File: Write your results to your content as a CSV, GeoJSON, or Apache Parquet file. You can create new files or overwrite existing files that you own.
Other enhancements
Previously introduced in beta, email notifications are now available for production use. As the owner of the data pipeline, you can configure scheduled tasks to run automatically on a defined interval. Data pipeline owners can now opt in to receive email alerts when task runs fail. You can opt in to emails when creating or editing data pipeline tasks. This feature was previously in beta but is now generally available for production use. For more information, see Notifications.
This release introduces a newly documented REST API for starting and querying data pipeline runs, enabling greater flexibility and expanded automation capabilities. Organizations can now seamlessly integrate and execute data pipelines from external workflows, applications, and systems.
For more information, see the ArcGIS Data Pipelines What’s new help topic or the What’s New in ArcGIS Data Pipelines (June 2026) blog article.
ArcGIS Velocity
ArcGIS Velocity enables the ingestion of live, constantly changing location data from streaming sources, sensors, vehicles, equipment, weather services, and many other common real-time providers. It also helps users process, visualize, and analyze real-time data feeds to trigger alerts automatically, and publish data for maps, dashboards, and historic analysis.
Recent updates include the following:
New feeds
The CompassCom feed in ArcGIS Velocity connects to CompassCom to ingest real-time location data for live tracking and analysis. It supports defense, federal, and public safety agencies in maintaining operational awareness of vehicles, personnel, and field assets from any device, including Motorola radios.
The Dataminr feed simplifies ingesting AI-generated threat and risk alerts from Dataminr, an AI-powered event detection platform that continuously analyzes publicly available data, including social media, news, blogs, sensor data, and other open sources, to surface breaking events and emerging risks earlier than traditional monitoring tools.
The Dataminr First Alert feed simplifies ingesting AI-generated threat and risk alerts from Dataminr First Alert, the public-sector product built on Dataminr’s AI-powered event detection platform and tailored for emergency response and first responders, but delivering incurated information specifically for public safety and emergency management use cases.
The IoTKinect feed type streams real-time industrial Internet of Things (IoT) and sensor telemetry from Long Range Wide Area Network (LoRaWAN) devices into ArcGIS Velocity for live spatial monitoring and alerting.
The Raven Connected feed simplifies ingesting data from Raven Connected, a provider of real-time fleet, roadway, and work zone intelligence for road safety monitoring and situational awareness.
The Samdesk feed simplifies ingesting real-time crisis and event alerts from Samdesk, an AI-powered global event detection platform that continuously scans social media, news, and other open sources to surface emerging incidents, including natural disasters, fires, threats, and other public safety events.
In addition to the new feeds listed above, many existing feeds have been enhanced. See the What’s new help documentation for details.
New tools
The Multi-Merge tool, previously only available for real-time analytics, is now available for big data analytics. Muli-Merge combines up to 10 inputs into a single output schema, simplifying analytics with multiple data sources and required merges.
The Split by Attributes tool splits a single event with a delimited string field into multiple individual events while copying all other attributes to each, parsing it at ingest so each value can be individually mapped, analyzed, routed, or summarized.
In addition to the new tools listed above, many existing analytic tools have been enhanced. See the What’s new help documentation for details.
For details and more information, see What’s new in ArcGIS Velocity (June 2026) and the What’s new help topic.
ArcGIS Excalibur
ArcGIS Excalibur is web-based imagery and video analysis software for working with maps, images, and video services. Using Excalibur, you can annotate, mark up, and add observations or measurements to imagery with easy-to-use analysis tools and workflows. Using images and video as key data sources, users can create content for reports, presentations, or dashboards to share with stakeholders for informed decision-making.
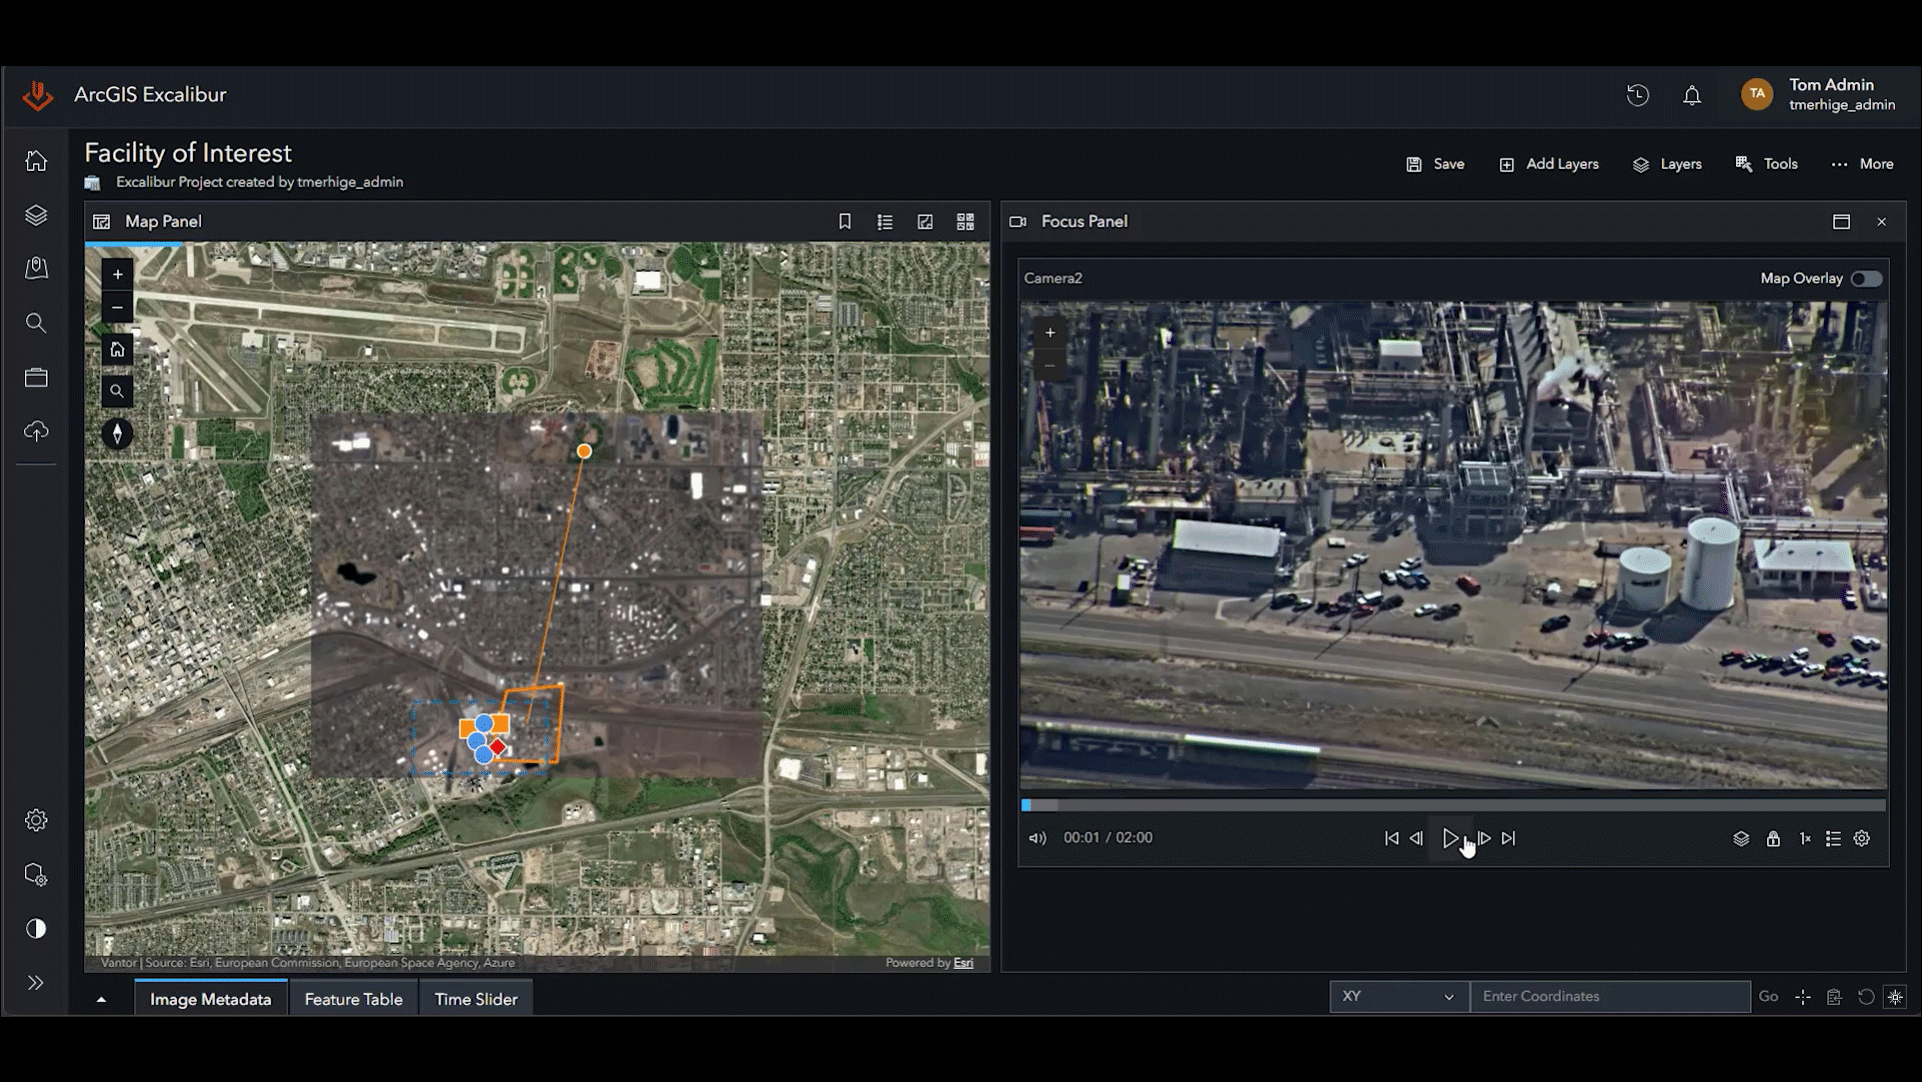
Work across multiple image analysis layers
ArcGIS Excalibur now supports multiple image analysis layers in one project. You can add, switch, and analyze layers with a new layer picker, reuse prior results, and collect observations across layers with context aware fields, making workflows faster, more flexible, and easier to manage.
For more information, see What’s new in ArcGIS Excalibur (Q2 2026).
ArcGIS Workflow Manager for ArcGIS Online
ArcGIS Workflow Manager for ArcGIS Online is a complete software as a service (SaaS) workflow management system for automating and streamlining your business processes. Save on infrastructure costs and maintenance by using a secure, scalable, and performant cloud environment to orchestrate your online workflows.
Automate field workflows
ArcGIS Workflow Manager for ArcGIS Online now integrates seamlessly with ArcGIS Field Maps Tasks through the new Create Field Map Task step template. Tasks can be created or scheduled, tracked, and the process is advanced automatically upon completion, eliminating manual handoffs to streamline field operations.
For more information, see What’s new in ArcGIS Workflow Manager.
ArcGIS Business Analyst Web App
ArcGIS Business Analyst Web App is a web-based app that applies GIS technology to extensive demographic, consumer spending, and business data to deliver on-demand analysis and presentation-ready reports and maps.
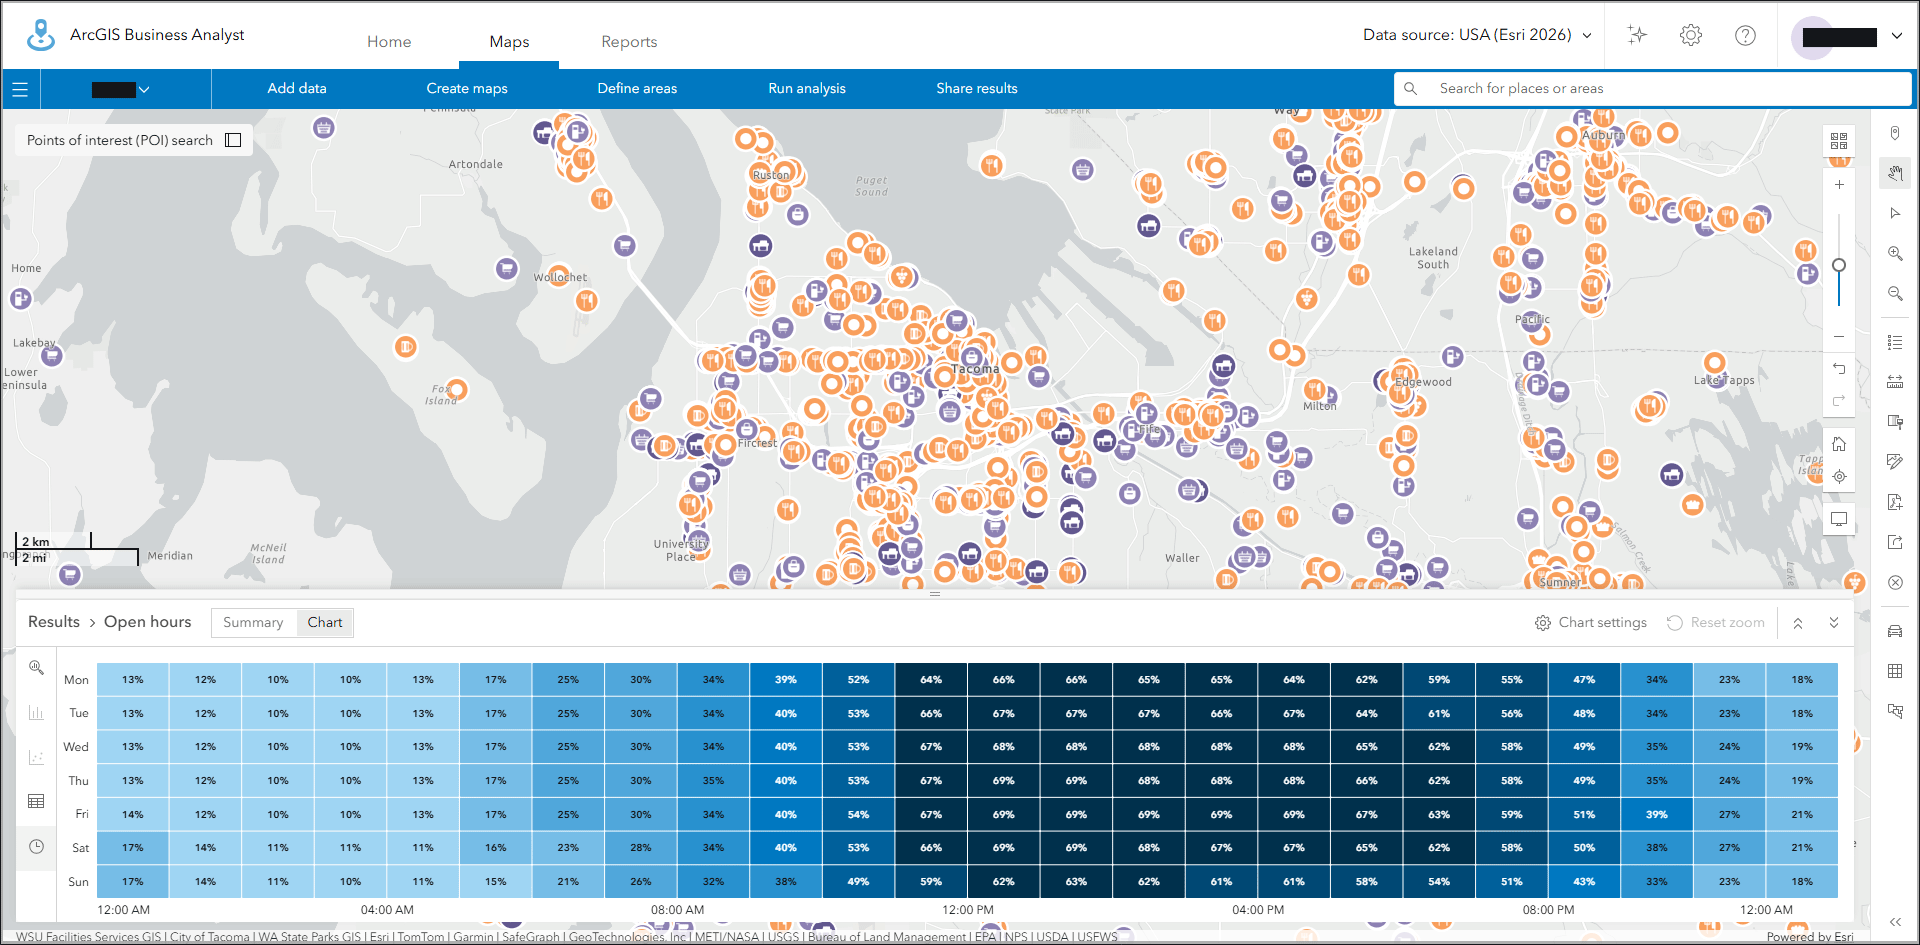
The latest Business Analyst Web App update introduces open hours information for points of interest. Use the SafeGraph POI data source and perform a search to view the operating hours for points in your area of interest. Explore what’s open late, early, or during a specific day/time window in your area of interest. The results are displayed as a summary, bar chart, stacked bar chart, or heat map chart to visualize patterns in activity. You can highlight open hours on the map or filter the search by the open hours attribute.
For example, shown below is a map and heatmap of retail locations open all the time, 7 days, early morning, and late night.
For more information, see What’s new in Business Analyst Web App (June 2026).
ArcGIS GeoBIM
ArcGIS GeoBIM delivers a connected data environment that seamlessly links architecture, engineering, and construction (AEC) information in Autodesk Forma (formerly Autodesk Construction Cloud) with geospatial data and services in ArcGIS. This integration unifies teams and projects from design to operations with efficiency and accuracy for improved collaboration, decision-making, and optimized outcomes.
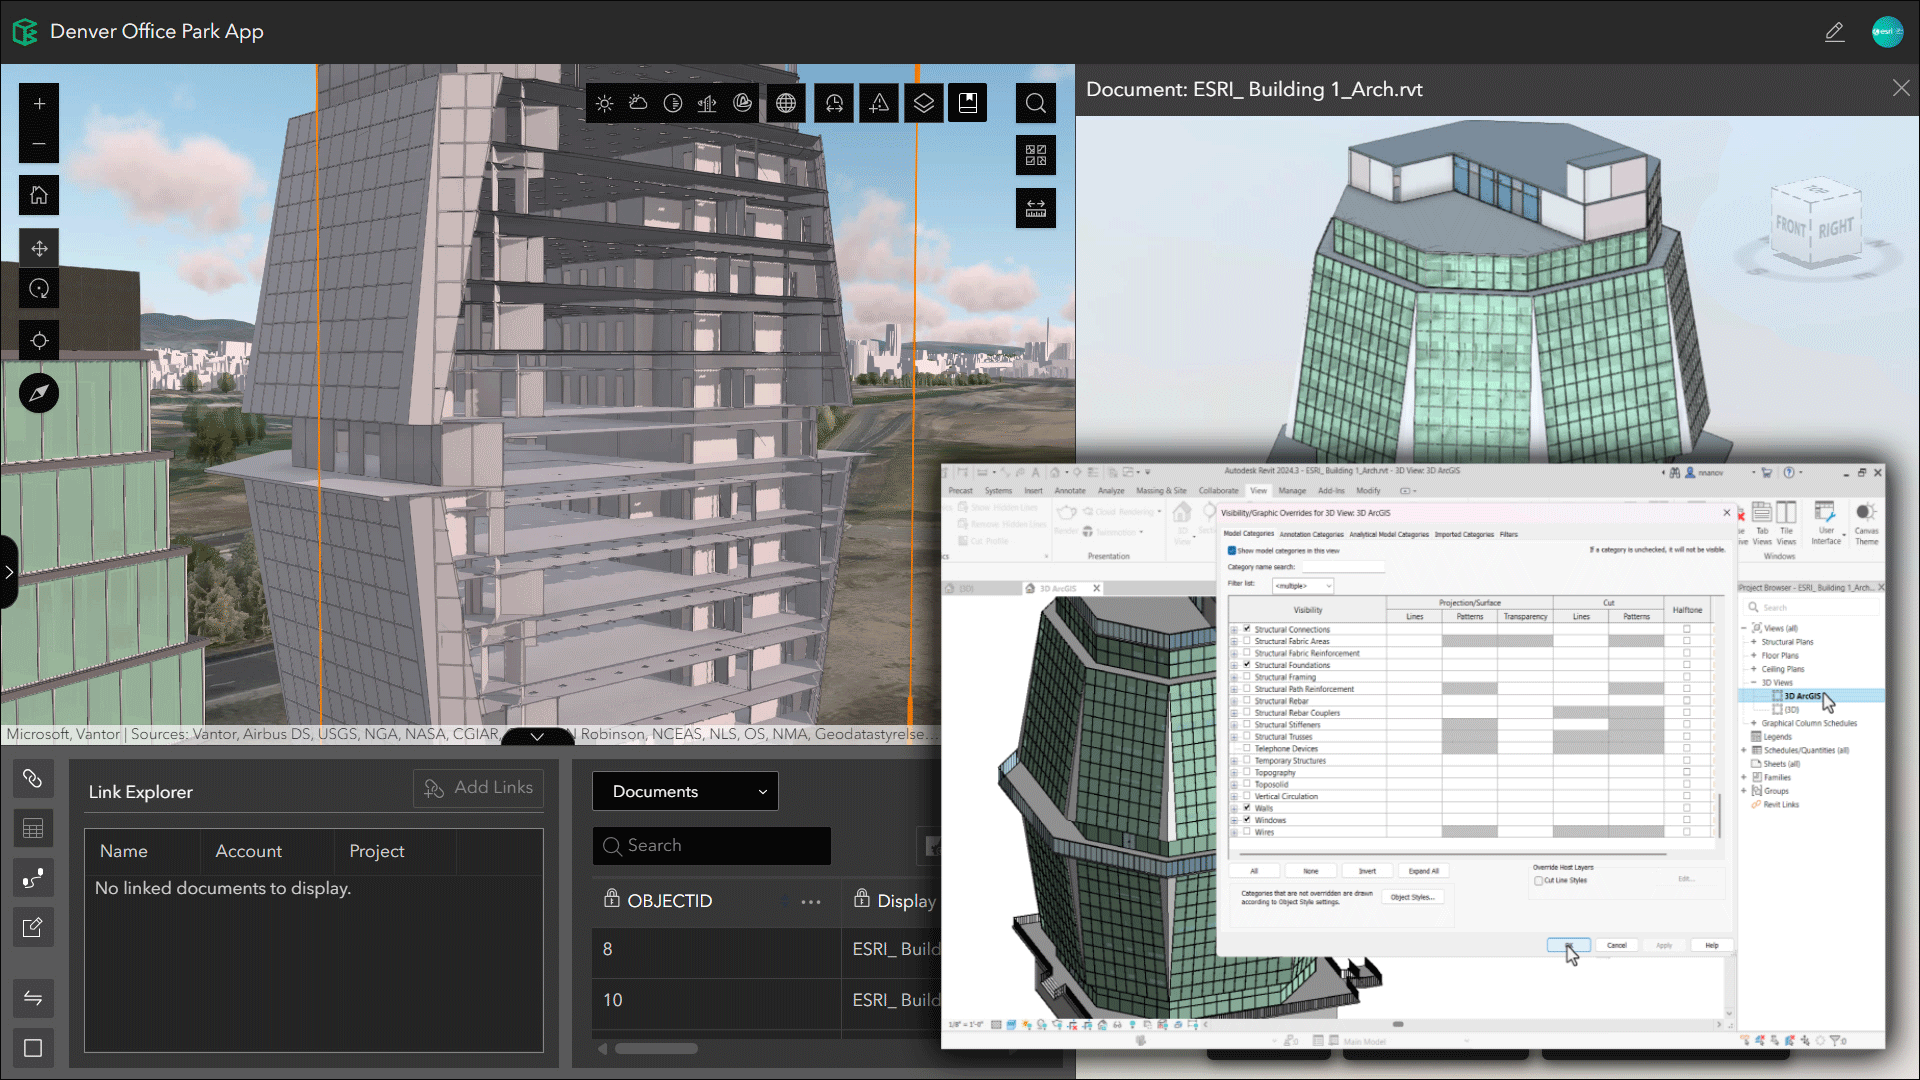
This update enhances BIM-to-GIS workflows with Autodesk Forma by giving teams greater control over what BIM data is synced for use in ArcGIS.
For more information, see What’s new in ArcGIS GeoBIM (June 2026).
ArcGIS Solutions
ArcGIS Solutions provides a collection of industry-specific configurations of ArcGIS that align with your organization’s needs, transform your use of ArcGIS, and help you maximize your investment in location-based data and technology. These mapping solutions leverage your authoritative data and are designed to improve operations; provide new insight; and enhance services in government, utility, defense, public safety, and telecommunications organizations.
ArcGIS Solutions assistant (beta)
The June release of ArcGIS Solutions introduces an AI-driven approach to solution building with the ArcGIS Solutions assistant (beta), enabling users to design, refine, and deploy solutions through natural language, supported by proven ArcGIS design patterns.
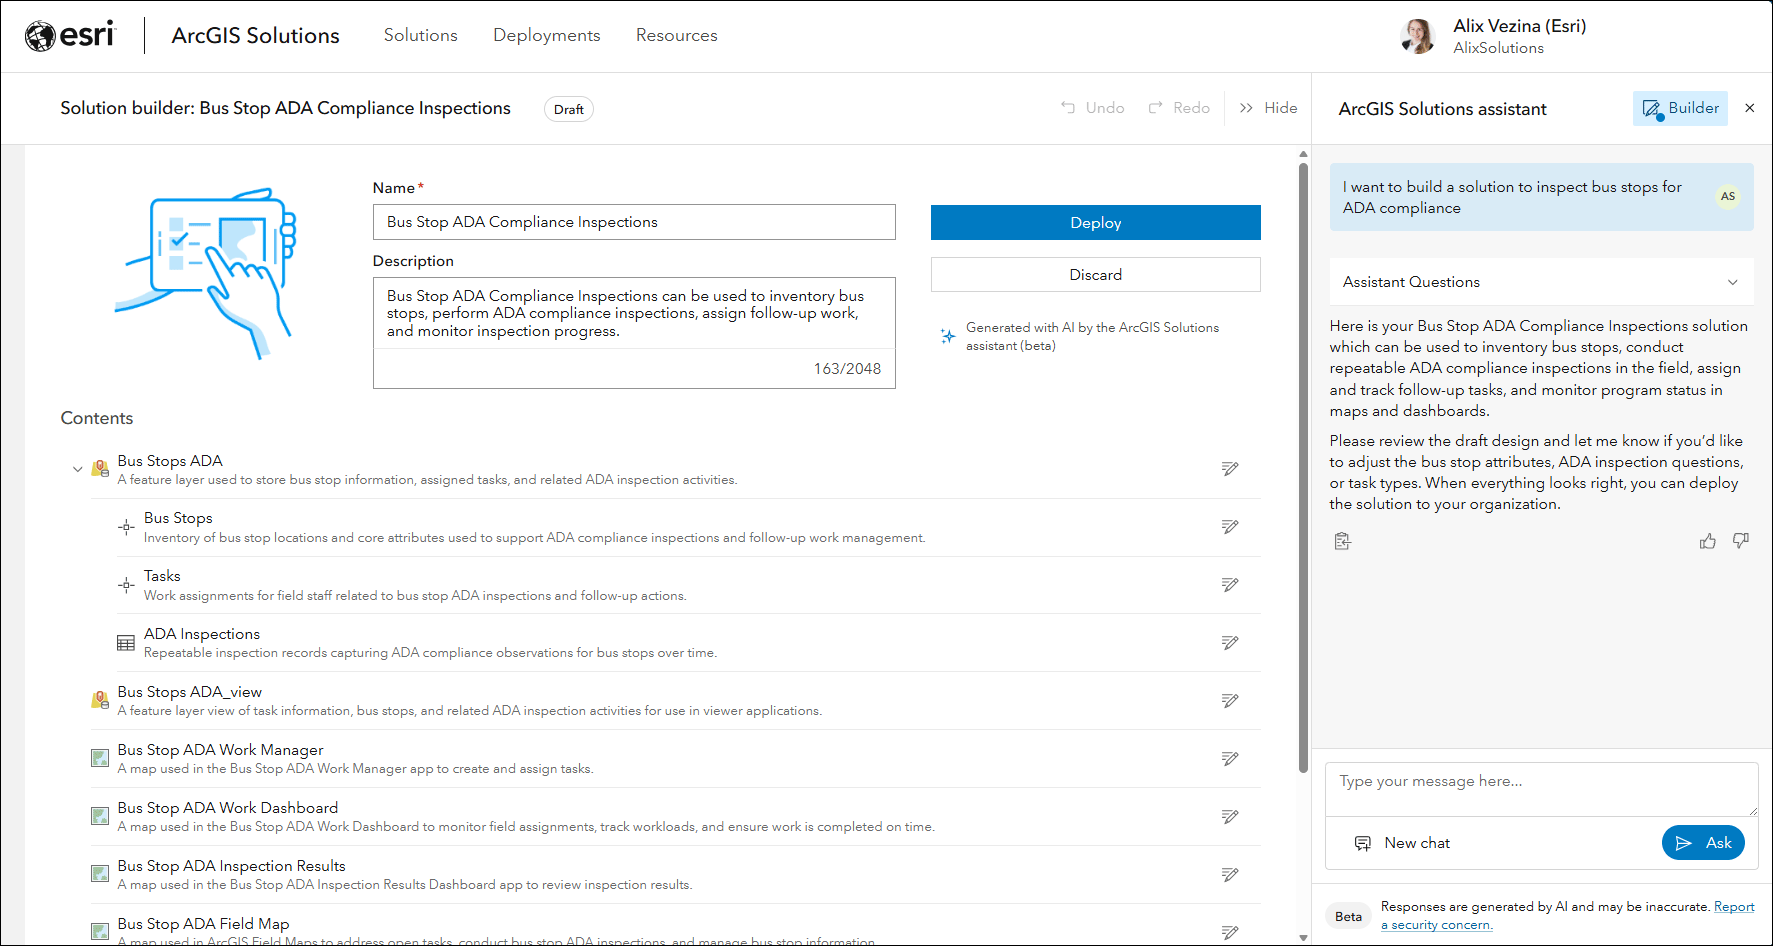
See Build your own solution with the ArcGIS Solutions assistant for details and more information.
ArcGIS Solutions app improvements
Several enhancements to the ArcGIS Solutions app improve management workflows. The solution details page now includes quick links to existing deployments, while a new shortcut provides direct access to the ArcGIS folder containing deployed solution items for easier management.
For more information, view all ArcGIS Solutions and see the ArcGIS Solutions resources.
Content Store for ArcGIS
Content Store for ArcGIS is an app for premium commercial imagery, providing a single access point to high-quality, ready-to-use aerial, satellite, and drone imagery from multiple leading providers. Content Store simplifies the process of purchasing commercial imagery for organizations and enables GIS users to quickly discover, integrate, and use it seamlessly within their projects. Select an area of interest, choose dates, then review results before adding the desired imagery to the cart.
Access on-demand drone imagery
On-demand drone imagery is now available in Content Store for ArcGIS. Complement satellite and aerial imagery with high-resolution drone data to capture finer detail at specific locations. Users can easily move from large, regional projects to focused site analysis with the flexibility to order only the imagery they need, when they need it, from provider Spexi.
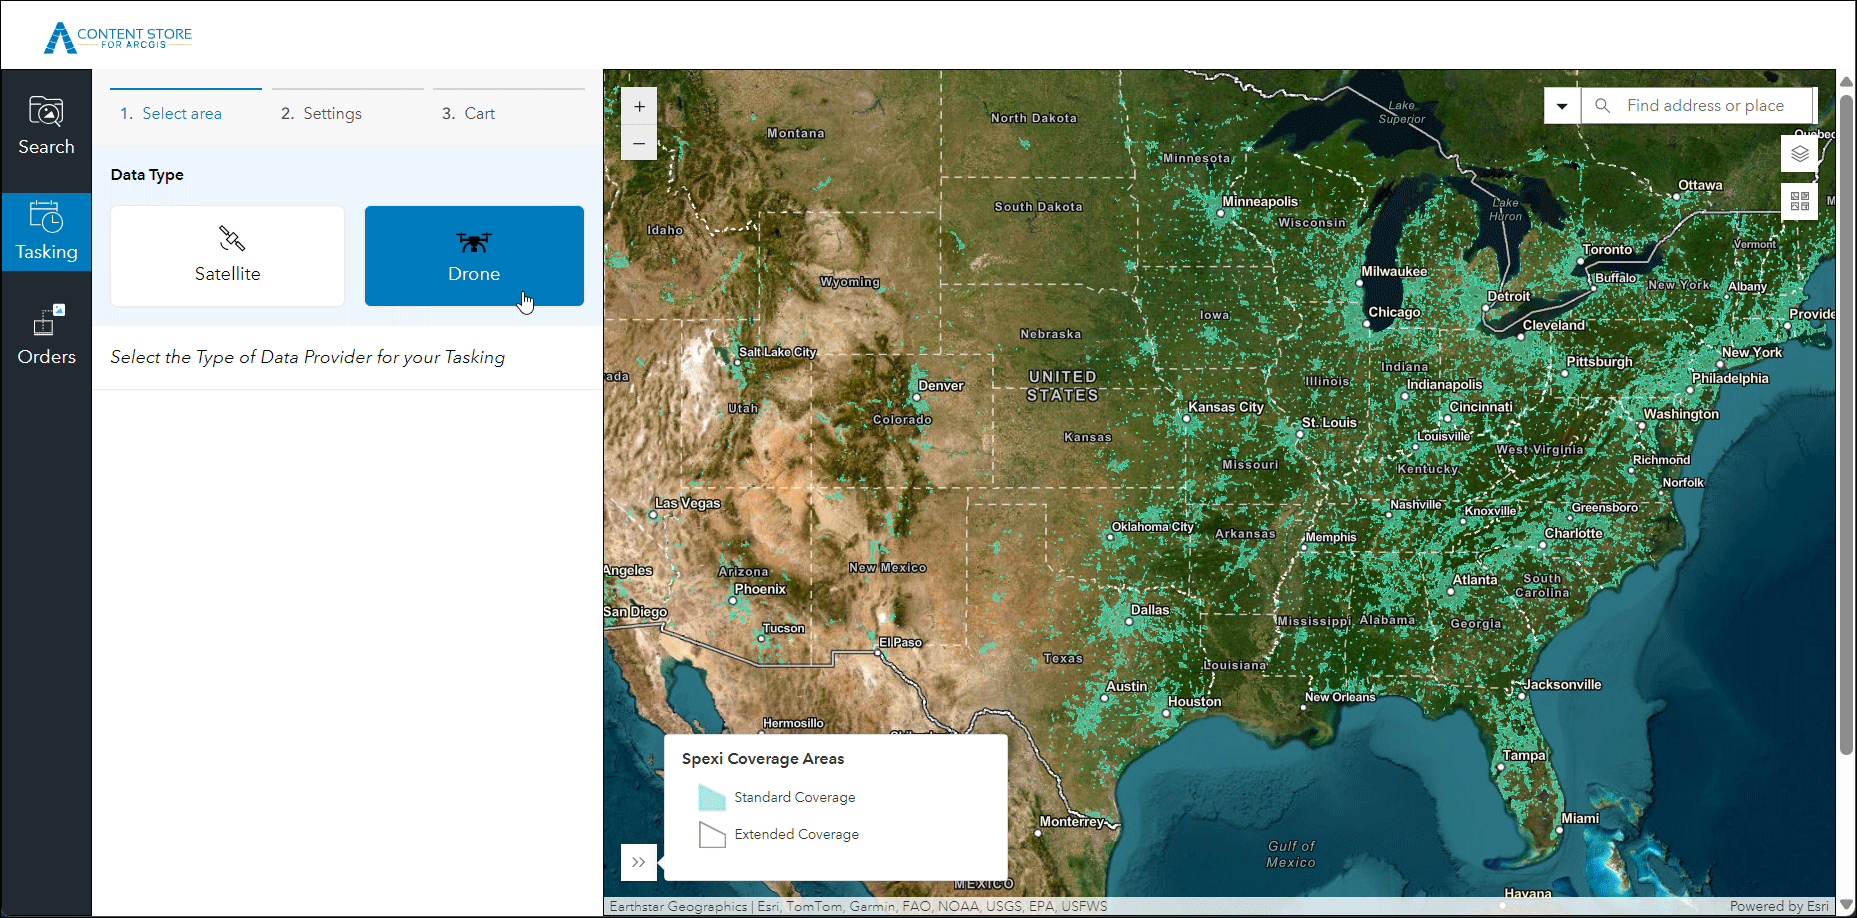
For more information, see Content Store for ArcGIS.
ArcGIS Living Atlas
Find ready-to-use, trusted content from the GIS community in the form of layers, maps, apps, tools, and 3D scenes. Easily access this collection of content to quickly kickstart your ArcGIS Online workflows, saving you time and effort.
Living Atlas content is published and updated regularly. For the latest news and information, see the ArcGIS Living Atlas home and the ArcGIS Living Atlas blog. The following are highlights of spatial content recently added to Living Atlas.
Analysis-optimized imagery layers
Select Living Atlas imagery layers are analysis-optimized to support larger scale and more complex analysis workflows. More than 50 new layers have been added since the last release and the full collection can be found in the Living Atlas Analysis-Optimized Imagery Layers group. You can also use a tag search to return the same list of optimized layers. For more information, see ArcGIS Living Atlas ready-to-use imagery layers for analysis.
Geospatial AI and World Imagery
AI and deep learning can help save time and money by automating manual processes. ArcGIS Living Atlas of the World not only provides a collection of pretrained deep learning models but also provides World Imagery as a high-resolution imagery source for automated feature extraction. See this blog tutorial to learn how to perform automated feature extraction from World Imagery in ArcGIS Online.
Google Photorealistic 3D basemaps (preview)
The Google Photorealistic 3D basemaps, Photorealistic and Photorealistic Hybrid, are now out of beta and in preview. By leveraging these basemaps, organizations can explore buildings and environments from multiple angles with accuracy and realism and create immersive, photorealistic 3D web scenes for use within your organization. Administrators and those with sufficient privileges can turn on the Allow members to use Google Photorealistic 3D basemap toggle button in the organization’s Map and scene settings.
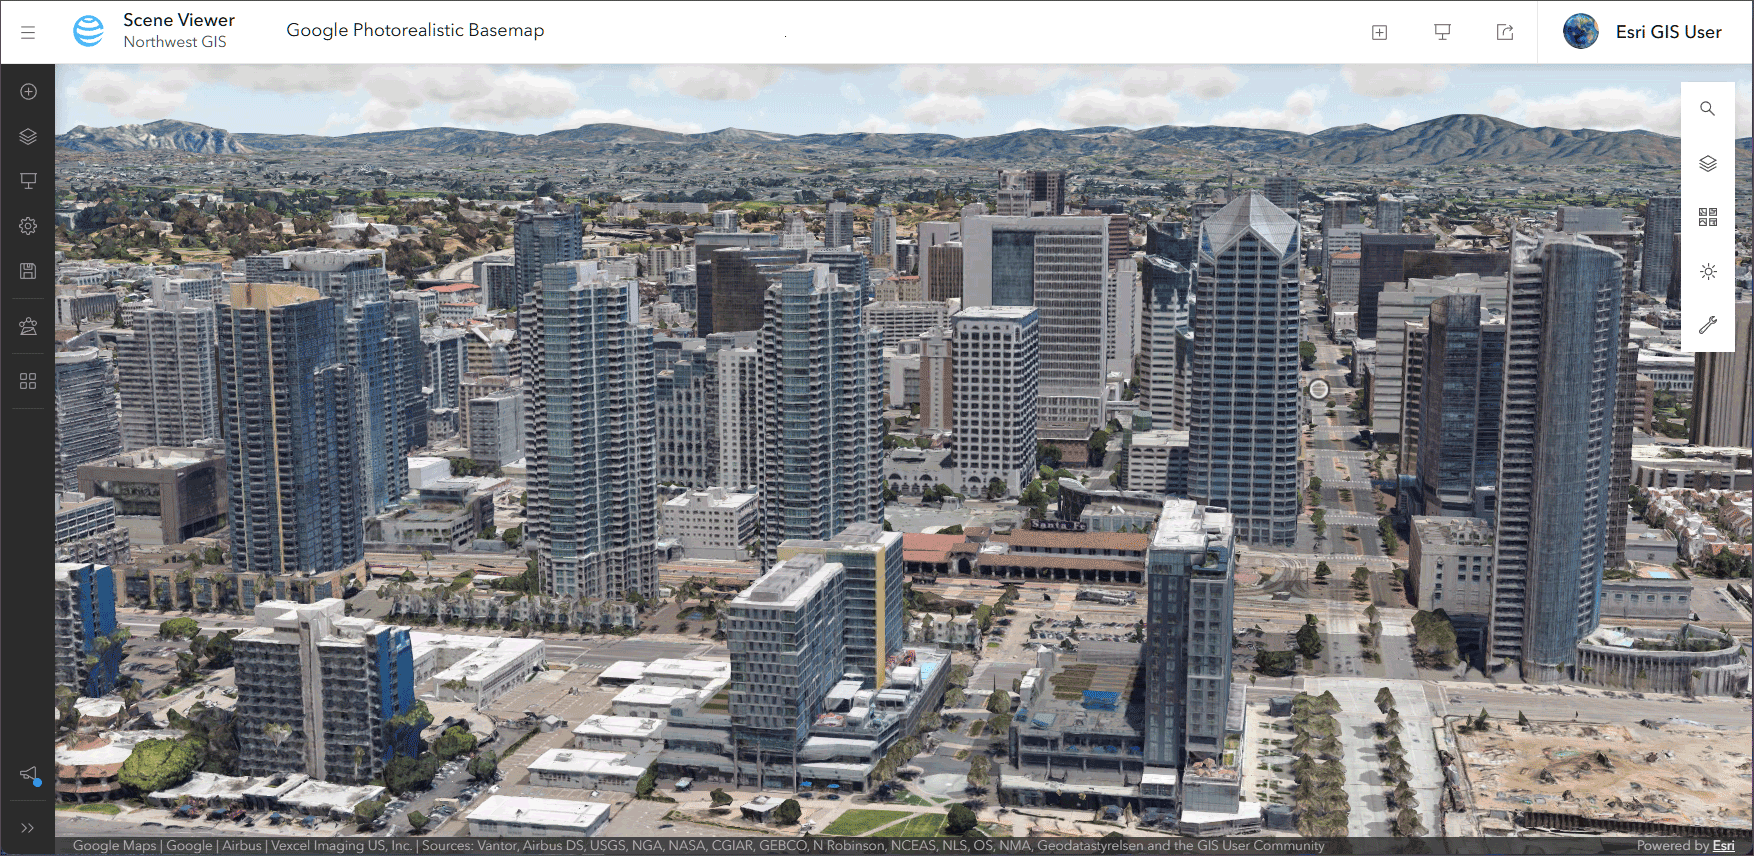
When enabled, the basemaps are available in the Scene Viewer basemap gallery. Scenes authored with them can be used in ArcGIS Experience Builder, ArcGIS StoryMaps, ArcGIS Dashboards, and ArcGIS Instant Apps. See Google Photorealistic 3D Basemap (preview) in ArcGIS Online and ArcGIS Pro for more details and information.
Mapillary Global Street-level Imagery (beta)
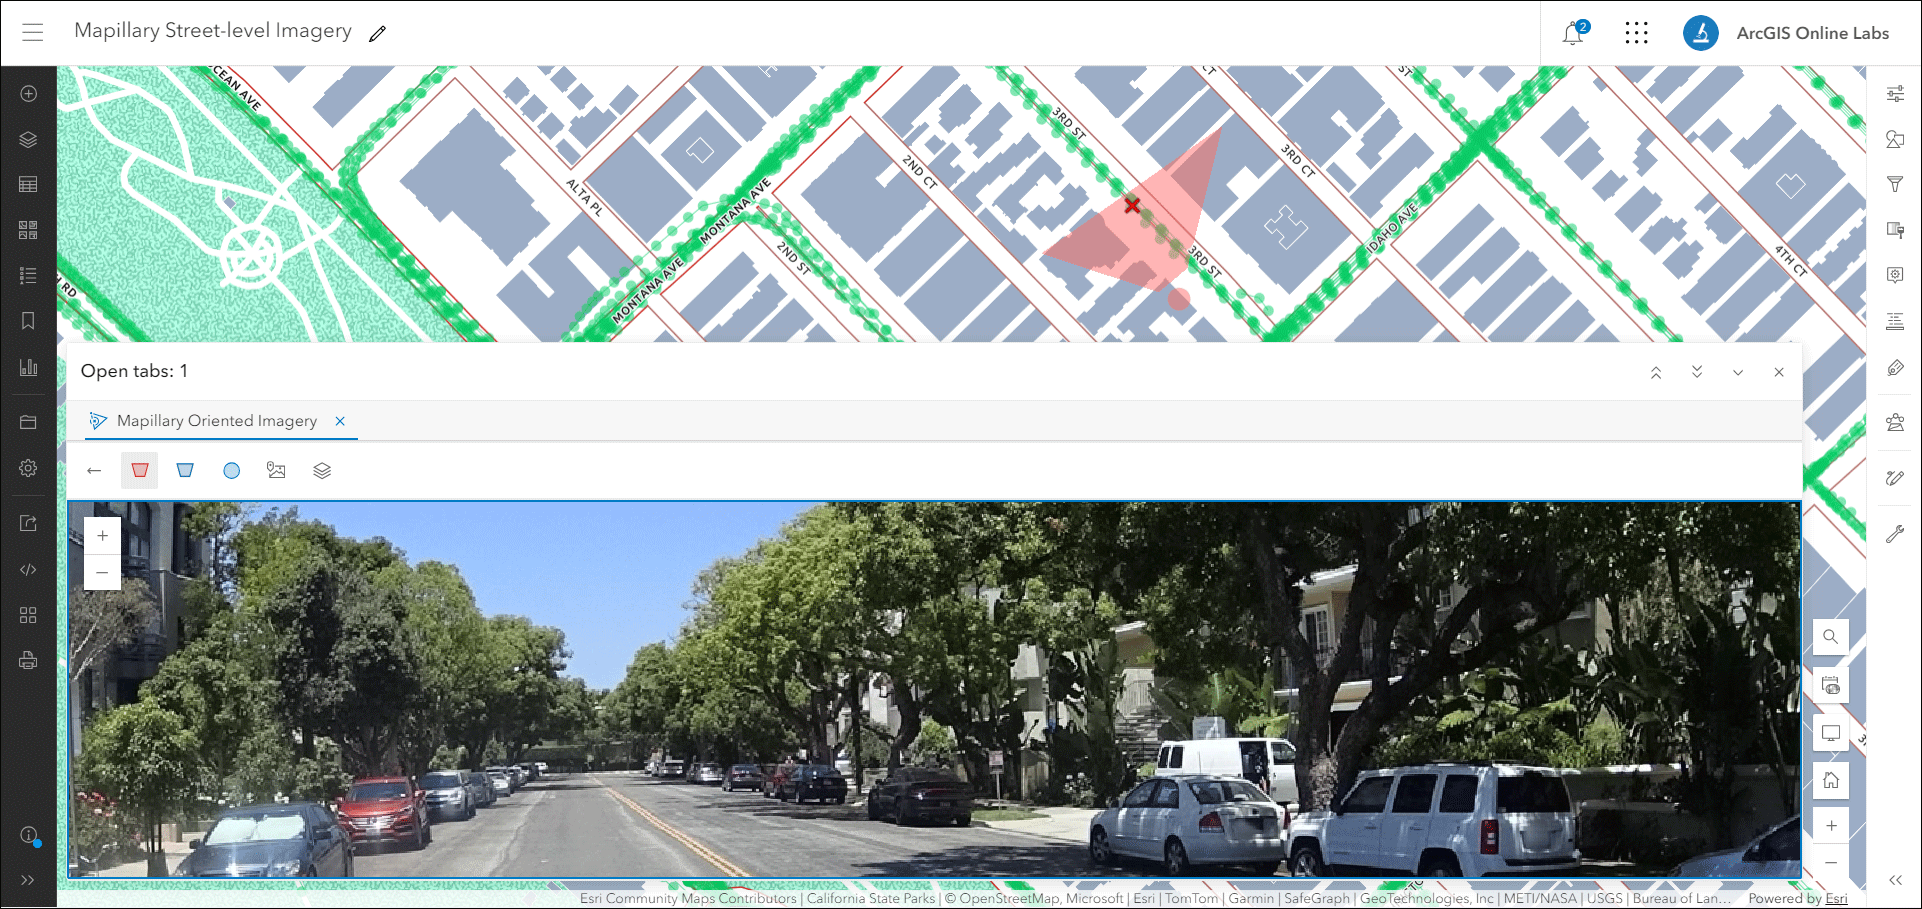
A new Mapillary street-level imagery layer (beta) is now available in ArcGIS Living Atlas, giving you access to over 3 billion global street view images from Mapillary. This open, crowdsourced data integrates immersive, high-quality street-level oriented imagery views into your mapping workflows, allowing you to easily create your own maps, 3D scenes, and web applications. For more information, see Introducing the new Mapillary street view imagery layer (beta).
USA Annual NLCD Land Cover
Users can explore 40 years of National Land Cover Database (NLCD) land cover data with six new layers now available in ArcGIS Living Atlas. Optimized for analysis and enhanced with processing templates for visualization, these layers make it easier to understand how natural processes and human activity have shaped the landscape over time.

Wet Bulb Globe Temperature
To help make more comprehensive heat stress data more readily available, a new Global Wet Bulb Globe Temperature Baseline layer has been added to ArcGIS Living Atlas. The layer is designed to provide projected scenarios to visualize how future heat stress may vary by location, time of year, and climate scenario, while the new baseline layer shows us a summary of patterns of the past calculated with data from 1994 to 2023.

Health Professional Shortage Areas
A Health Professional Shortage Area (HPSA) is a geographic area, population group, or health care facility that has been designated by the Health Resources and Services Administration (HRSA) as having a shortage of health professionals. You can access the three categories – Primary Care, Dental Health, and Mental Health – as three different feature layers.

USA Cloud Cover
USA Cloud Cover Days is now available in ArcGIS Living Atlas, making it easy to integrate cloud cover information into your GIS workflows. This new imagery layer provides the average number of days per year with cloud cover for the contiguous United States (CONUS) and portions of Mexico and Canada. To learn more, see Explore Cloud Cover Across the U.S.

More information
For more information and additional details about this update, see the What’s new help topic or view all posts related to this release. You can also watch an introductory video to see new capabilities in action.
Visit the ArcGIS Online Esri Community to ask questions, view blogs, learn from peers, and submit your ideas for future enhancements.


Commenting is not enabled for this article.