Version 4.28 of the ArcGIS Maps SDK for JavaScript (JS API) introduced three new date-focused field types — date-only, time-only, and timestamp-offset — to represent different levels of information when working with date and time values, and the values stored in these fields adhere to ISO8601 compliant formats. To learn more about these fields check out Emily’s blog. These new field types are supported on FeatureLayer and MapImageLayers, with plans to extend their support to other layers in future releases. The timestamp-offset field type efficiently stores both date and time along with the corresponding time zone offset in the following format: YYYY-MM-DDTHH:MM:SS.sss+/-UTC offset.
Before the introduction of these fields, date and time values were stored as epoch values in the date field type. Epoch values represent a point in time as the number of seconds that have passed since January 1st, 1970, at 00:00:00 (the Unix epoch). For example, October 19, 2021, at midnight in UTC is represented as 1634630400 in epoch value. However, epoch values do not store time zone information, so all values stored in date fields are in the same time zone. This behavior makes it challenging to perform time-based analysis spanning multiple time zones. This is where timestamp-offset fields prove to be invaluable. They are particularly useful for mapping events that occur across various time zones. Practical applications for timestamp-offset values are diverse and varied including flight departure and arrivals, crime statistics or whenever it is advantageous to persist the local time of an event.
Let’s see the timestamp-offset in action!
This blog will explore the power of timestamp-offset field values for visualization and analysis. Below are two sample applications that demonstrate the advantages of using the new timestamp-offset field.
This application displays all 2021 fatal car accidents that occurred in the United States. The data is color coded by in one by the time of day, that is, morning, afternoon, evening, and night. This data was obtained from Fatality Analysis Reporting System here.
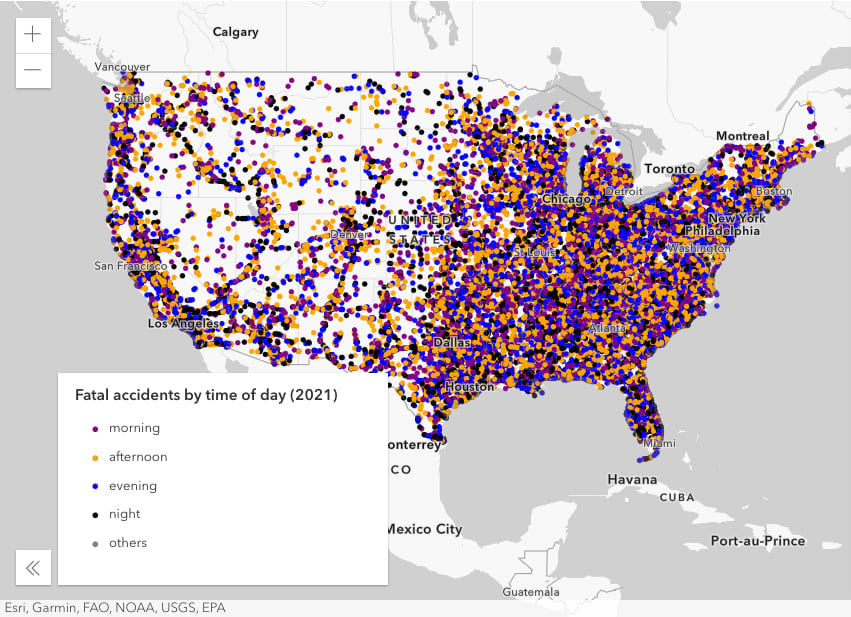
Visualizing accidents by time of day
Let’s examine how the unique value renderer is created for the accidents layer. It utilizes an Arcade expression to extract the local time, specially the hour, that each car accidents occurred. For the purpose of this map, the four named time periods were defined as:
nightfor hours between midnight and 6 AM,morningfor hours between 6:01 AM and noon,afternoonfor hours between 12:01 PM and 6 PM, andeveningfor hours between 6:01 PM and midnight.
The process of obtaining the local time from a timestamp-offset field is relatively simple as demonstrated below. The Arcade expression below uses the hour function to extract the hour an incident occurred. For example, data captured at 8AM in Hawaii and data captured at 8AM in New York would both be classified as ‘morning’ because both were captured in the morning relative to their time zone. Had these incidents been stored in a traditional date field then we would have had to infer each location’s time zone. For national or global datasets this can be difficult or impossible.
layer.renderer = {
   type: "unique-value",
   valueExpression: `
     var d = $feature.TSODate;
     var h = Hour(d);

     When(
       h <= 6, "night",
       h <= 12, "morning",
       h <= 18, "afternoon",
       "evening"
     );`,
   uniqueValueInfos: [
     {
       value: "morning",
       symbol: createSymbol("purple")
     },
     {
       value: "afternoon",
       symbol: createSymbol("orange")
     },
     {
       value: "evening",
       symbol: createSymbol("blue")
     },
     {
       value: "night",
       symbol: createSymbol("black")
     }
   ],
   defaultSymbol: createSymbol("gray")
};
Visualizations depicting the distribution of accidents on charts
The charts displayed on the right side of the application offer a breakdown of the total number of accidents based on time of day, weekdays, and months. In the weekday chart, you can explore accident data by hours for the selected day of the week, while the monthly chart provides a breakdown of accidents by days within the chosen month.
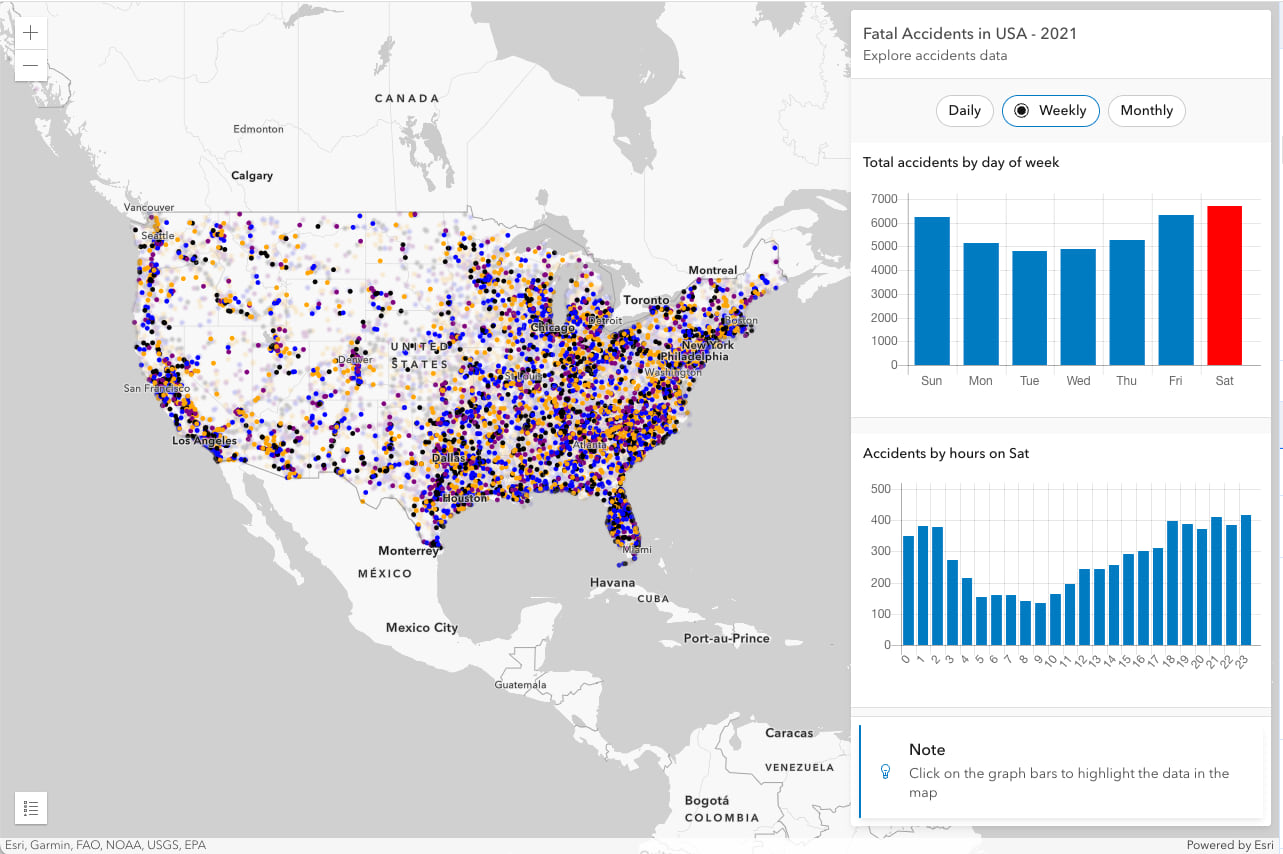
These charts are generated by querying the dataset to obtain accident counts. The query involves extracting information about the hour, day, and month from the timestamp-offset field available in the service. For example, the Total accidents by time of day chart data is efficiently prepared using timestamp-offset values. This approach enables seamless time-based analysis across multiple time zones. For example, we can compare data captured at 8 AM in Hawaii with data captured at 8 AM in New York because both were recorded in the morning relative to their respective time zones. While it may have been possible to generate this information using a traditional date field, it would have required additional information such as the state, in order to determine the localized time offset and ultimately the local time of each accident. This is complicated by the fact that some dates honor daylight savings while others do not. The following code demonstrates how the data for the Total accidents by time of day chart is prepared. It involves querying the accident data, extracting the hours from the timestamp-offset field values, and obtaining the total count of accidents grouped by the hours.
const query = layer.createQuery();
query.where = "1=1;
query.outStatistics = [
  {
    statisticType: "count",
    onStatisticField: "*",
    outStatisticFieldName: "count"
  }
];
query.groupByFieldsForStatistics = ["extract(hour from tsodate)];
query.orderByFields = ["extract(hour from tsodate)];
const hourResult = await layer.queryFeatures(query);

for (let feature of hourResult.features) {
  hourData.push(feature.attributes["count"]);
  hourLabels.push(feature.attributes["EXPR_1"]);
}
// create a bar chart showing total number of accidents by time of day
updateChart("chart-day", hourData, hourLabels, false, 3000);
Aggregation based on timestamp-offset field
In the example above, a unique value renderer is assigned to the accidents layer to show what time of day accidents occurred. We can change the visualization further by aggregating the accidents based on time of the accident.
The application below demonstrates how accidents data can be presented as clustered pie charts. Once again this demonstrates the benefit of using timestamp-offset with data that spans multiple time zones. Chart size corresponds to the overall number of fatal car incidents whereas the size of each slice illustrates when during the day or night the accidents occurred. You can vary the size of each pie based on data with any other field value or Arcade expression using visualVariables. Check out Kristian’s blog on 8 ways to style point clusters on the web to dive into clustering. The Total Accidents by Time of Day chart automatically updates as the user zooms or pans the map. The chart updates dynamically by re-processing in-memory data without requesting additional content from the server. This technique is called client-side query, check out this blog for additional information on ultra-fast maps, charts and visualization.

Summary
If you are working with temporal data spanning multiple time zones, then the timestamp-offset may be advantageous for certain time-based queries.
- Trans-time zone comparison: Storing event instances in timestamp-offset fields allows for easy inter-time zone comparison and analysis. For example, what time of day has the most accidents across the US? Based on national store transactions, what is the best operating hours for a new coffee stop in Los Angeles?
- Temporal Aggregation: Aggregate data irrespective of time zone to see higher-level trends and make comparisons. The samples above that aggregate data by local hour, day, week and month is a great example of this advantage over traditional. Another example, what if a coffee chain wanted to know which store sold the most on Christmas day. It would be unfair to base statistics in a specific time zone. Instead, the local time zone of each store could be used.

Article Discussion: