The 4.8 release of the ArcGIS API for JavaScript (JS API) completed support for layer view queries in 2D web apps. This means the query capabilities for features available on the client is almost on par with query operations made against a feature server. Now you can execute fast and complex spatial, attribute, and statistical queries for FeatureLayerView and CSVLayer. Rapid browser-based computation makes data exploration fun, easy, and useful. As demonstrated below, finding data trends is as easy as moving your mouse.
For example, check out the app below, which explores homicide data from 2007-2017 for 50 cities in the U.S. With just the move of a mouse, you can view various statistics related to homicides within one mile of the cursor location. All the queries are fast because they run locally on the client.
This blog will explore this, and other apps to demonstrate the power of client-side queries.
A quick review
Queries are essentially questions you ask your data. In the JS API, these questions are defined in an instance of the Query class. You can create a query as a simple JavaScript object, or you can call the createQuery() method directly on the layer. Creating a query object with createQuery() is convenient because the resulting object maintains the configuration settings of the layer, such as definitionExpression and outfields. So I usually call createQuery() to get started.
We revamped the Query documentation at 4.8 to be more explicit about the following types of queries you can execute against a feature service or layer view.
These query types aren’t exclusive of one another. Elements of each can be combined to answer more complex questions related to your data. We encourage you to explore the documentation and samples to learn more about the query capabilities we support since we can’t cover them all here.
How it works
Generally speaking, the concepts mentioned above aren’t new. The JS API has supported query functionality server-side for years. What is new, is that you can now do all of that client-side, vastly improving the interactivity of your applications.
Querying a lot of features rapidly can be very computation intensive and could easily freeze the web browser. However, you can use the JS API to execute queries rapidly on every pointer move event without much cost to the performance of the application. We accomplish this using two major strategies:
1. Leveraging web platform tooling and advanced features of the web browser, and
2. Developing new technologies in the JS API.
Leveraging web platform tooling and advanced features of the web browser
Over the last few releases, we have used Web Workers to offset heavy computational processing to lightweight threads, thus preventing your application’s user interface from freezing. This allows you to accomplish heavy processing in the browser without negatively affecting the user experience. We developed a RPC framework around web workers and promises to streamline development, allowing us to implement key features such as module loading and falling back code execution to the main thread if the web application runs in a restricted environment (CSP).
More recently, we have leveraged WebAssembly, which allows us to compile and run C code in the web browser with great performance taking advantage of mature and efficient code Esri already developed through the years for the ArcGIS Pro and Runtime SDKs. WebAssembly is the mechanism that allows us to run the Projection Engine client-side for converting geometries to other spatial references on the fly.
Developing new technologies in the JS API
The following pieces of the JS API have also played an integral role in beefing up our support for client side queries.
The Geometry Engine, which evaluates the spatial relationship between two or more geometries client side, is used to evaluate queries that specify a query distance and/or a spatial relationship.
We added a SQL92 parser and runtime, which uses grammar processed with PegJS, to evaluate where clauses. It was originally used for the definitionExpression property of the SceneLayer, but we now use it more broadly to process SQL client-side throughout the API.
Finally, we wrapped up all these technologies in a query engine that processes the queries, projects (or converts) the geometries on demand, tests feature attributes against the SQL where clause, and evaluates outFields as expressions.
While the query engine powers the query methods in the FeatureLayerView, it is also used in the CSVLayer to display your data in hundreds of projections and query CSV files transparently. In the upcoming 4.9 release of the JS API, FeatureLayers constructed with client-side features will take advantage of this as well.
A few examples
The following are some examples that demonstrate combinations of queries executed on the client rather than a service.
Mexico Educational attainment
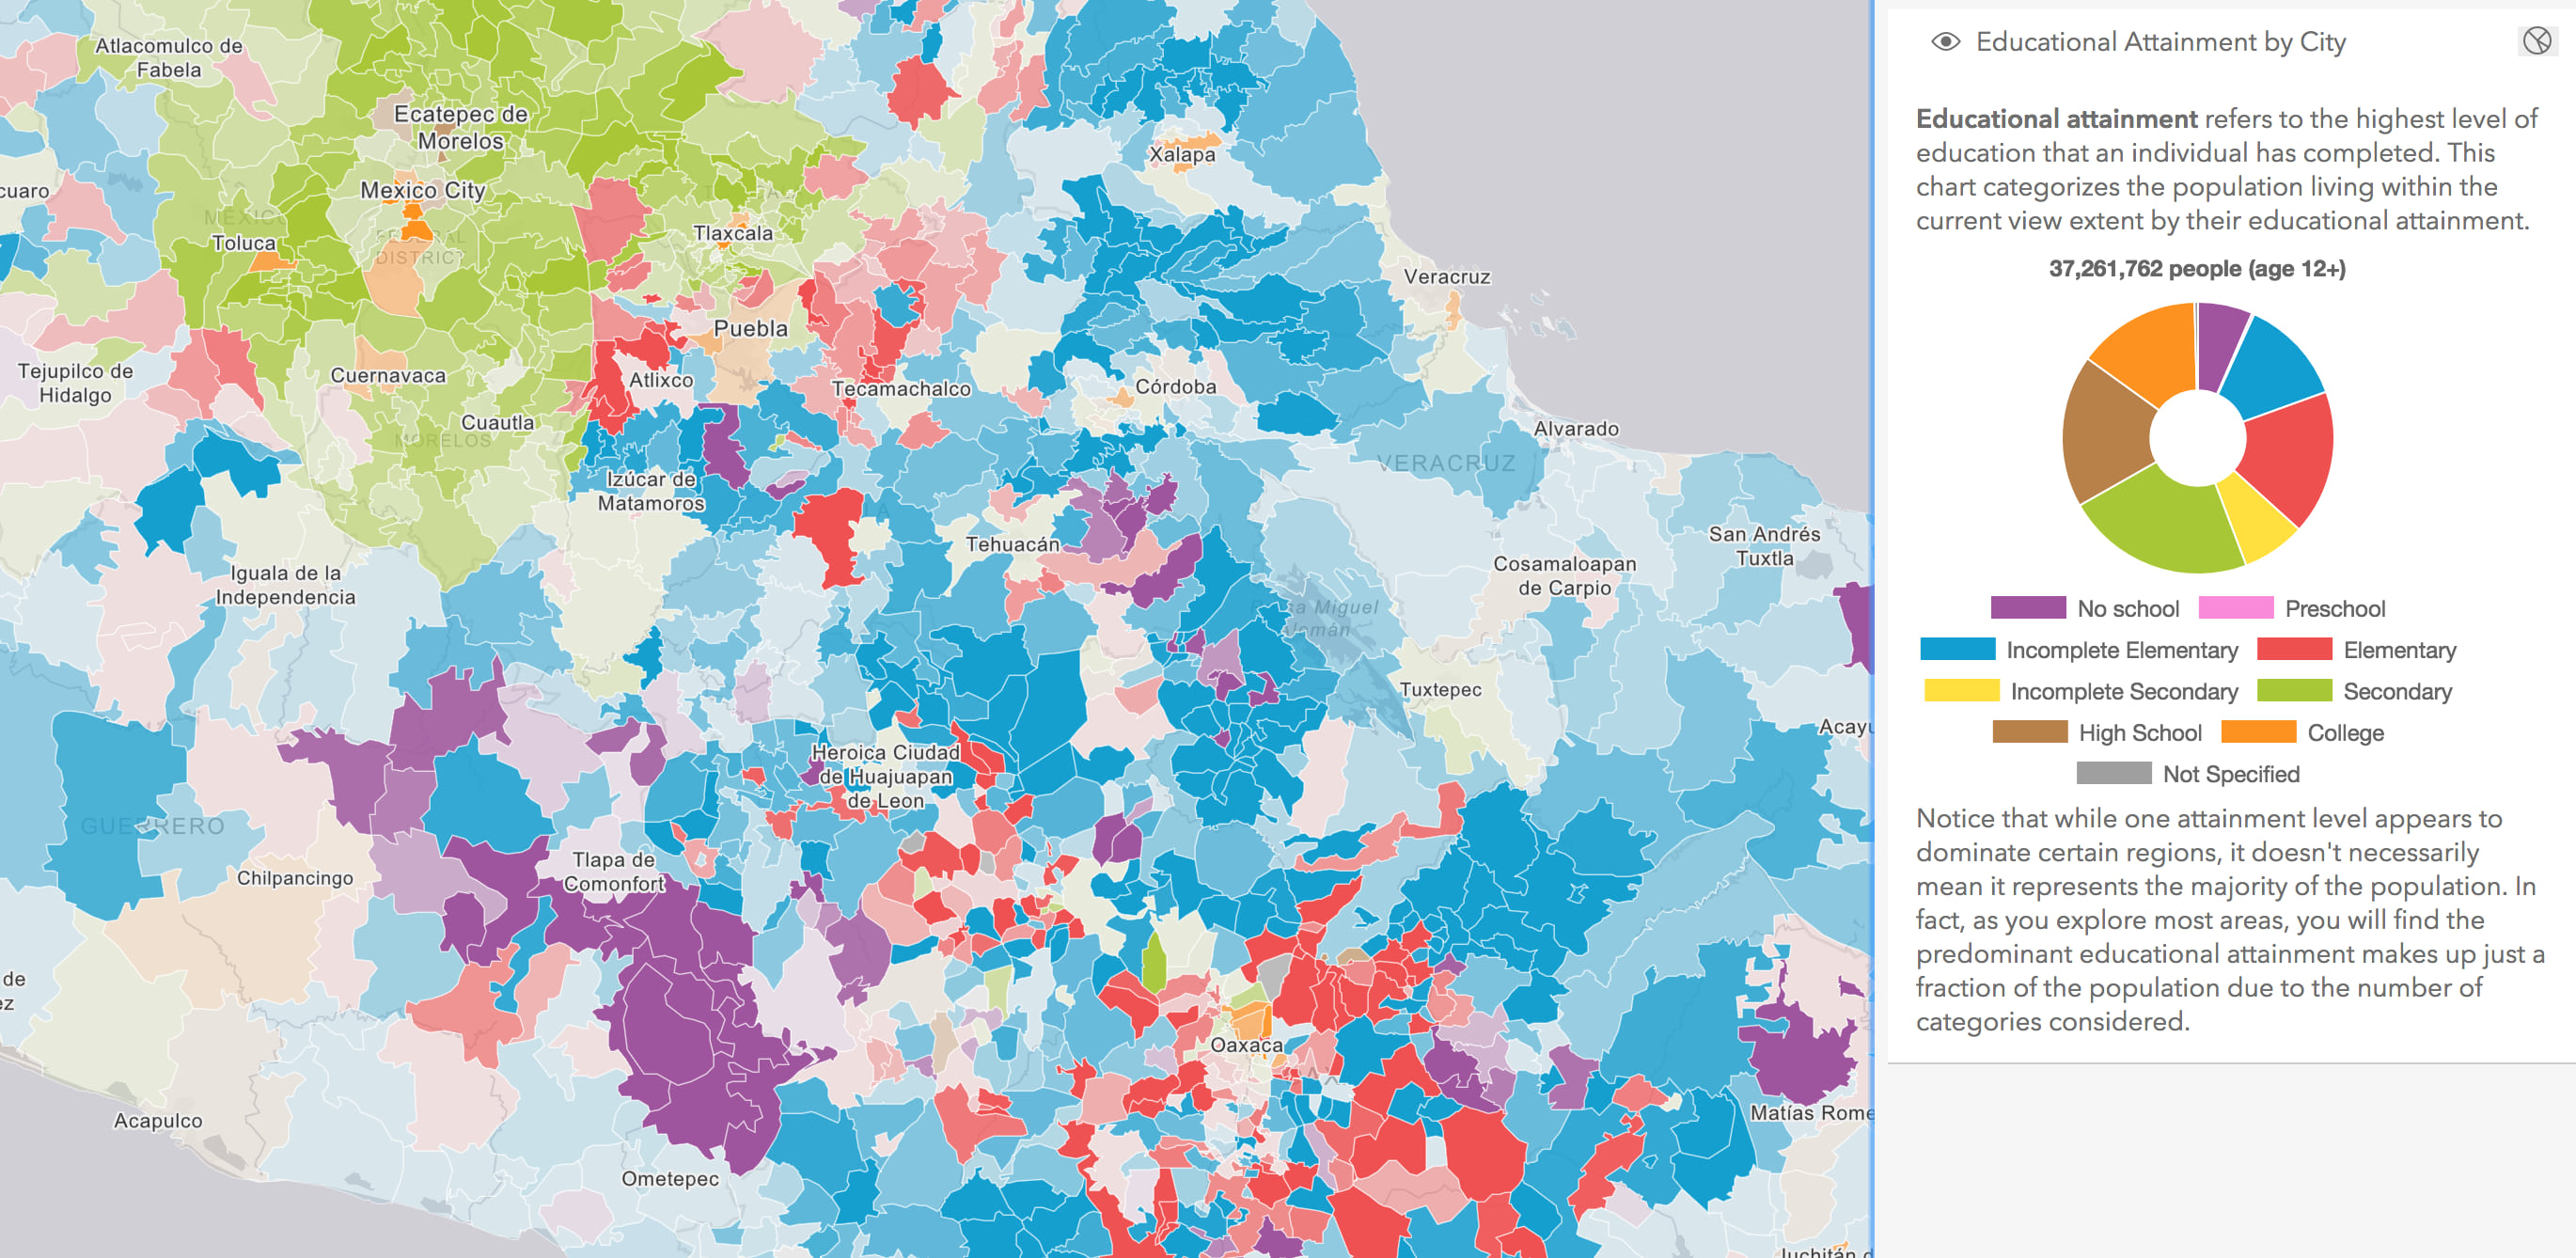
This app visualizes the predominant educational attainment level achieved in each municipality of Mexico. The chart to the right breaks down the proportion of each attained level for all features in the current view. As you pan and zoom to different regions, you’ll see the chart update to reflect the statistics of features within the new extent.
This is accomplished by querying for the sum of each educational attainment field and setting the query geometry to the view’s extent.
// educationFields is an array of field names
// e.g. "EDUC01_CY", "EDUC02_CY", "EDUC03_CY"

const statDefinitions = educationFields.map(function(fieldName){
  return {
    onStatisticField: fieldName,
    outStatisticFieldName: fieldName + "_TOTAL",
    statisticType: "sum"
  };
});

// query statistics for features only in view extent
const query = layerView.layer.createQuery();
query.outStatistics = statDefinitions;
query.geometry = view.extent;

return layerView.queryFeatures(query)
  .then(function(response){
    const stats = response[0].attributes;
    // send the stats to the function that updates the pie chart
  });
Explore homicides within a distance of a location
The following application displays various statistics about homicides within a one mile radius of the cursor’s location. In all, about 30 statistics are queried with each mouse move, allowing the user to dynamically interact with the data in ways that otherwise wouldn’t be possible if those queries had to be requested from a server.
There are four relevant fields of interest in this dataset: disposition, victim_sex, victim_age, victim_race. Since some of these fields contain string values, we can write a set of SQL expressions to return a count for each unique type. The following snippet demonstrates how the query looks for getting the count of each value of the disposition field. Notice the query geometry references the location of the pointer buffered to one mile. Again, this query executes on every pointer-move event, something that isn’t feasible for server-side queries.
view.on("pointer-move", function(event) {
  const query = layerView.layer.createQuery();
  // converts the screen point to a map point
  query.geometry = view.toMap(event);
  // queries all features within 1 mile of the point
  query.distance = 1;
  query.units = "miles";
  // disposition (aka crime status) is a string field, so we can write a SQL
  // expression to return the total number of each type
  query.outStatistics = [
    {
      onStatisticField: "CASE WHEN disposition = 'Closed by arrest' THEN 1 ELSE 0 END",
      outStatisticFieldName: "num_closed_arrest",
      statisticType: "sum"
    }, {
      onStatisticField: "CASE WHEN disposition = 'Open/No arrest' THEN 1 ELSE 0 END",
      outStatisticFieldName: "num_open",
      statisticType: "sum"
    }, {
      onStatisticField: "CASE WHEN disposition = 'Closed without arrest' THEN 1 ELSE 0 END",
      outStatisticFieldName: "num_closed_no_arrest",
      statisticType: "sum"
    }
  ];

  layerView.queryFeatures(statsQuery)
  .then(function(response){
    const stats = response.features[0].attributes;
    // send the stats to the function that updates the charts
    // stats.num_closed_arrest
    // stats.num_closed_no_arrest
    // stats.num_open
  });

});
A note on precision
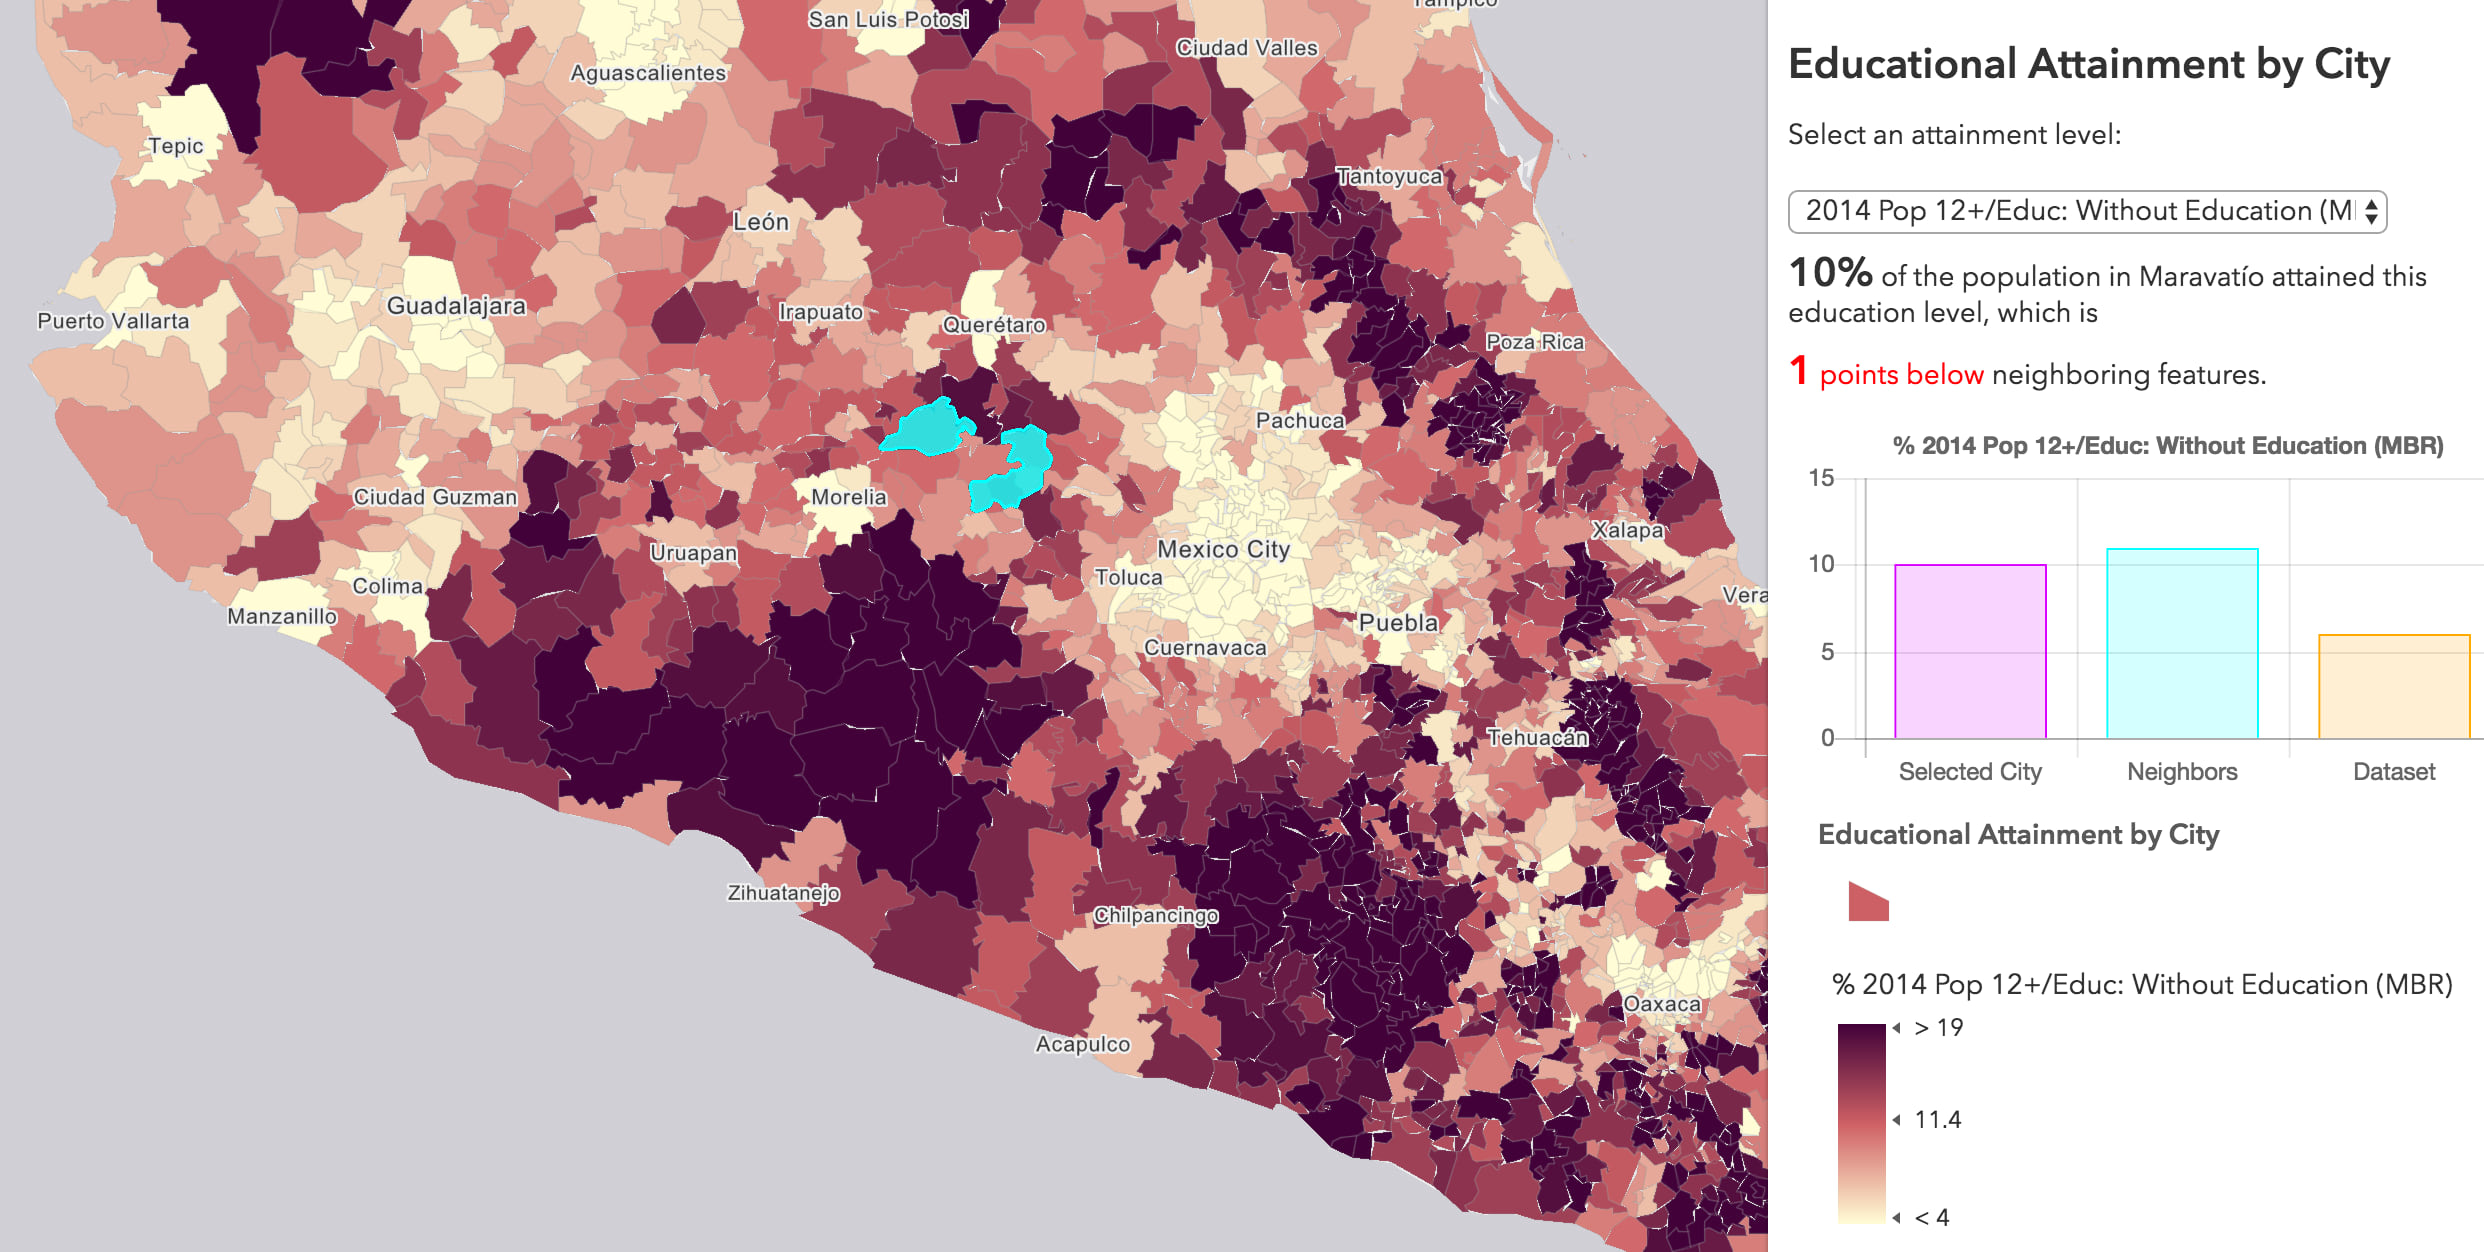
Spatial queries are only as good as the precision of the data. Since the LayerView generalizes geometries for optimized performance in a browser, each spatial relationship, such as touches, may yield unexpected results. Smaller features may also be completely dropped from the client, since they can’t be appropriately visualized anyway, thus yielding incomplete query results for certain cases. In the app below, for example, as the user moves the cursor over a municipality, a spatial query is executed for all features that touch the feature intersecting the pointer. The value of a variable from the selected feature is then compared to the average value of the same variable from the neighboring, or touching, features.
As you zoom away from the data, the polygons become more generalized, causing the touches query to return imprecise results even though the full resolution geometries from the service follow strict topological rules. As you zoom closer to the data, the geometries are loaded at a higher resolution, allowing the queries to return expected results.
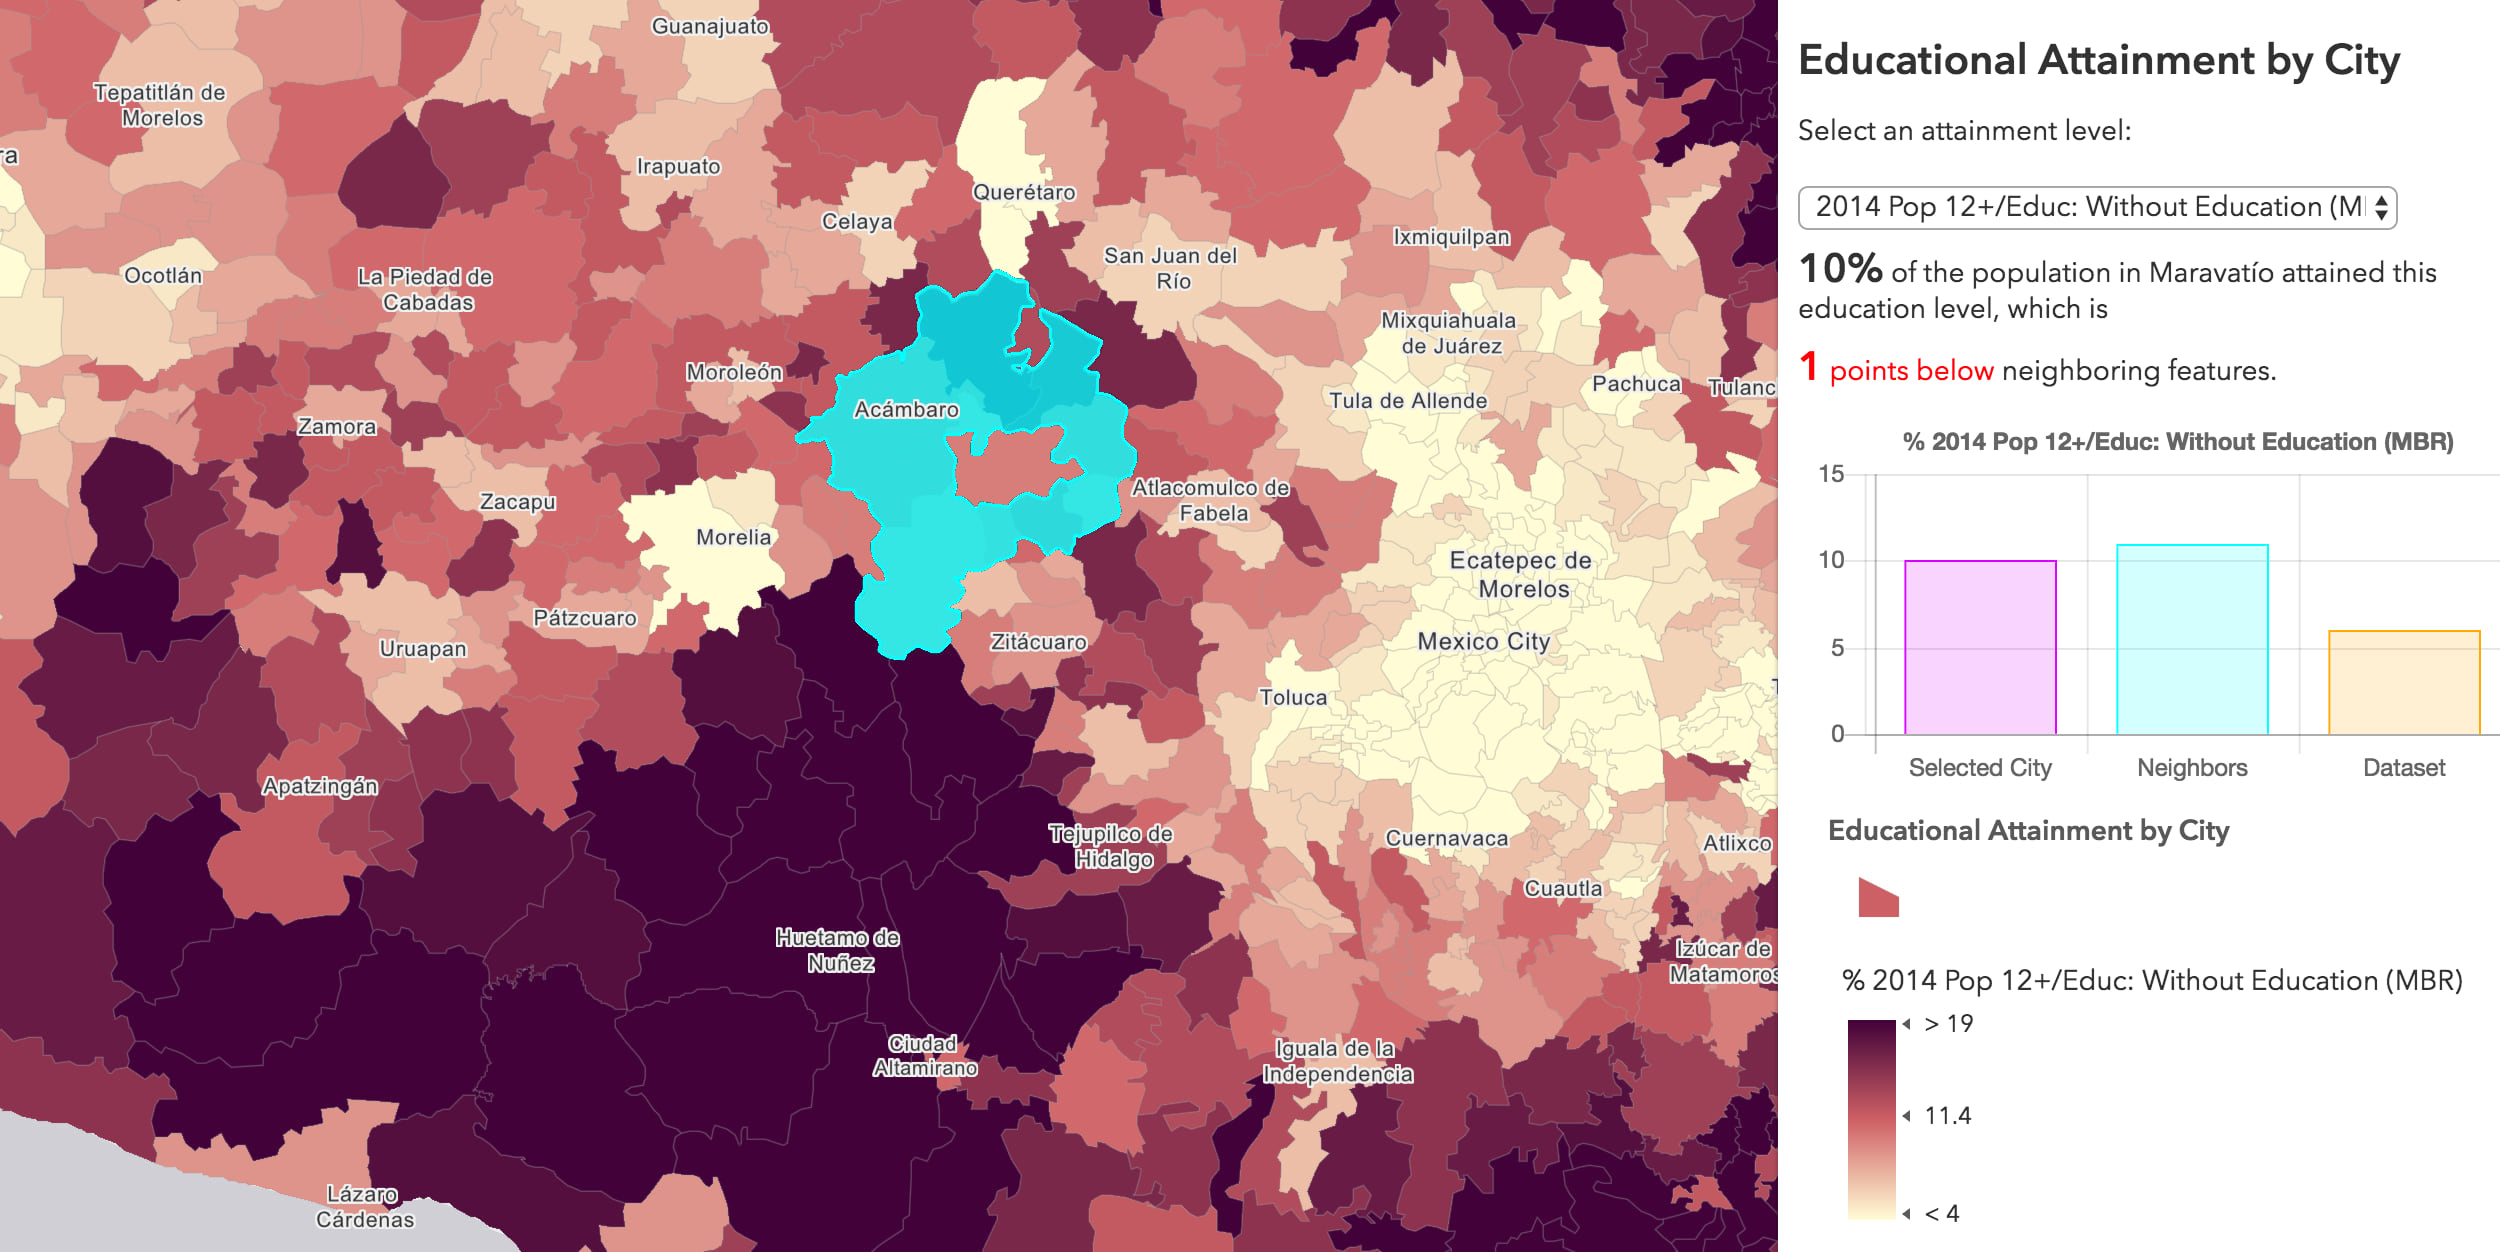
To keep the user from seeing imprecise results, you can set a scale constraint on the view to prohibit them from zooming out to scales where low resolutions are inevitable, or you can compromise and alter the query in the following manner.
const layerView = params.layerView;
const geometry = params.centerFeature.geometry;
const layer = layerView.layer;

const queryParams = layer.createQuery();
// geometry of feature returned from a hitTest() of the cursor location
queryParams.geometry = geometry;
// use "intersects" instead of "touches"
queryParams.spatialRelationship = "intersects";
queryParams.returnGeometry = false;
// exclude the query geometry
queryParams.where = `OBJECTID <> ${params.centerFeature.attributes.OBJECTID}`;

// query for the ids of the features that touch the
// input feature, then highlight them
// this code executes in an async function allowing us to take advantage
// of await to make the code more readable
const ids = await layerView.queryObjectIds(queryParams);
highlightFeatures(layerView, ids);
This query is for intersecting features that don’t match the input geometry, yielding better results at smaller scales.
If precision is more important than fast performance, then you need to query the service for the full resolution geometries.
Summary
LayerView queries can be a powerful way to add interactivity to your application. However, they come at the expense of precision. So if geometry precision matters more than fast interactivity in your app, then stick with executing server-based queries against the feature service. However, if interactivity wins, then give LayerView queries a shot. Your users will find your apps more engaging and may be prompted to ask additional questions resulting in them gaining more insight into the data.


Commenting is not enabled for this article.