ArcGIS Connectors for Power Automate allow you to format dynamic spatial data into reoccurring statical reports. This blog article shows you how to use these connectors to format a weekly statistics table from a continuously updated feature layer.
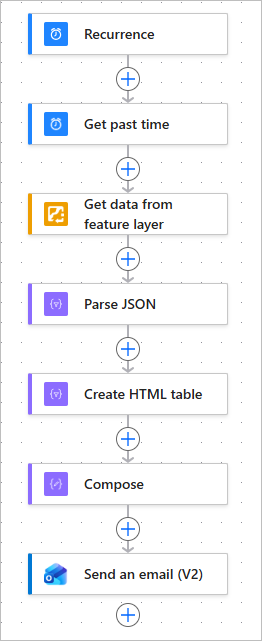
This workflow builds on another flow that generates a weekly statistic email from a feature layer. In this article, you upgrade this flow to send multiple statistics at once, group these statistics by a field, and format them in a table for the email.
The ArcGIS connectors are available with a premium license to Microsoft Power Automate and are accessible with ArcGIS Online (ArcGIS) or ArcGIS Enterprise connectors. To learn more, see Set up the ArcGIS Online (ArcGIS) connector and Set up the ArcGIS Enterprise connector.
Before you start
This workflow automates notifications that summarize recent updates to a feature layer. Before you begin, ensure you have the following:
- A connection to the ArcGIS Online (ArcGIS) connector from a login or API key or to the ArcGIS Enterprise connector in Microsoft Power Automate
- A connection to Office 365 Outlook
- A feature layer with a Date field and numerical field
Like the previous workflow, this one will use an air quality readings feature layer to aggregate air quality measurements throughout a town. The results will differ depending on the feature layer you query.
Edit a flow to retrieve multiple statistics from a feature layer
This workflow builds on a Power Automate workflow that automates a weekly average report from a feature layer. In the previous blog article workflow, only one summary statistic is retrieved from the feature layer. Complete the following steps to retrieve multiple summary statistics grouped by a field from the feature layer:
1. If necessary, reopen the designer for the flow that creates a weekly notification for a single statistic.
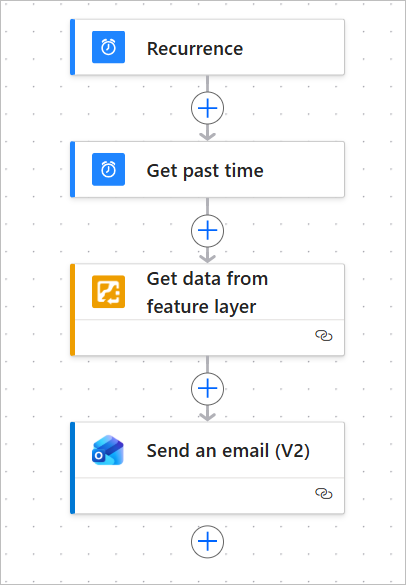
2. Click the Get data from feature layer action to open its window.
3. For the Output format parameter, select JSON.
4. Click the Advanced parameters drop-down menu and select Group by fields for statistics.
5. In the Group by fields for statistics parameter box, select the feature layer field to group your statistics by.
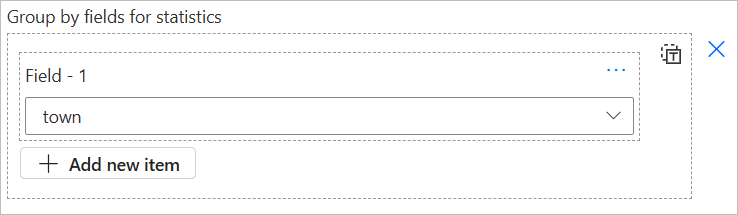
In this example, the statistics will be grouped by a field that holds the town where each measurement is taken.
Note: If you do not have a field to group statistics by, omit this step
6. Find the Output statistics parameter you configured to fetch the feature layer average. In the Output Field Name parameter, change the input to average-air-quality.
7. Under the average statistic you configured, click Add new item.
8. For each field that appears in the new statistic box, do the following:
- For On Statistic Field, select the field that holds the values you want to summarize.
- For Statistic Type, select stddev.
- For Output Field Name, type standard-deviation-air-quality and type the field name.
- For Sorting, leave empty.

9. Repeat steps 7 and 8 for each statistic you want to include in the report. In this demonstration, the average, standard deviation, count, and variance are retrieved.
10. Click Save at the top of the flow designer, and then click Test.

10. In the Test flow window, select Manually, and click Test.
11. Click Run flow and then click Done. Once the flow runs, leave the run window open.
Create an HTML table with your data
Now that the flow is prompted to retrieve multiple statistics from a feature layer, you’ll format the results so that they are organized in a table. Complete the following steps to generate an HTML table with your data:
1. After the flow runs, click on the Get data from feature layer action to open the run results.
2. Scroll down to the Outputs section and select Show raw outputs.
A code window appears showing the raw output data. At the bottom of this code you will see your statistic results.

3. In the section containing your statistics, select the contents of the “data” array by clicking just before the opening square bracket and highlighting the code until just after the closing square bracket.

4. Copy the highlighted section.
5. At the top of the designer, click Edit.
6. Between the Get data from feature layer action and Send an email (V2) action, add a new action.

7. Search for, and add, the Parse JSON
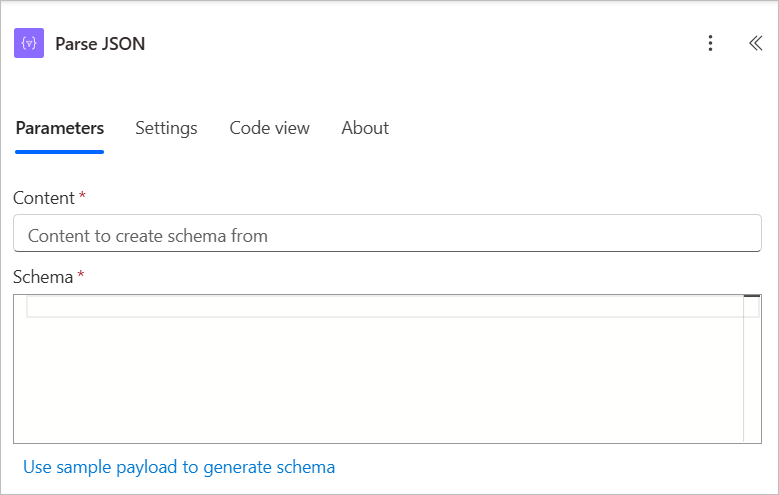
The Parse JSON window opens.
8. In the Content parameter, type a slash (/) and select Insert dynamic content.
9. On the Get data from feature layer menu of the dynamic content pane, click See more to expand the list, and select body/data.
10. Under the Schema parameter, click Use sample payload to generate schema.
11. In the blank code window, paste the copied code, and click Done.

The generated schema appears in the Schema parameter. You have now created independent attributes for each statistic value that you can reference later as dynamic content.
12. Below the Parse JSON action, add a new action.
13. Search for and add the Create HTML action.
The Create HTML window opens.
14. In the From parameter, type a slash (/) and select Insert dynamic content.
15. Select Body from the Parse JSON menu.
16. Click the Advanced parameters menu and select Columns.
17. In the Columns parameter, change the selection to Custom.
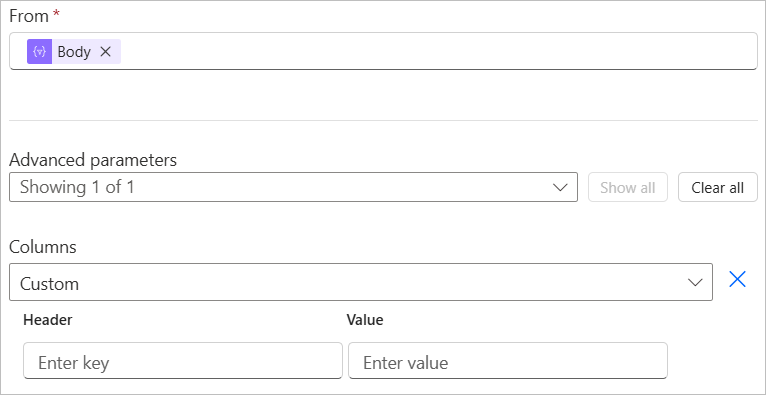
18. In the Header field, type the name of the first column you want to display.
In this example, the Town grouping field will be in the first column.
19. In the Value field, type a slash (/) and select Insert dynamic content.
20. Select the dynamic content option that includes the name of the content you want to display in the first column.
In this example, the attribute corresponding to the grouping field, Body town, is selected.
21. Repeat steps 18-21 for each statistic you retrieved from the feature layer, typing the display title for each statistic in Header and its corresponding dynamic attribute in Value.

You have now created an HTML table that will be dynamically populated with your statistics data.
Format a table in an email
With an HTML table of your statistics data, you can now use CSS to format the table in an email to send to yourself or stakeholders. Complete the following steps to automate an email containing the styled table:
1. Click the button to add an action under the Create HTML table action, search for the Compose action, and add it to the flow.
2. In the Input parameter, paste the following code:
<style>
table {
border-collapse: collapse;
}
table td, table th {
border: 1px solid #AAAAAA;
padding: 3px 10px;
}
table tr:nth-child(even) {
background: #D9E1F2;
}
table thead {
background: #4472C4;
}
table thead th {
font-size: 15px;
font-weight: bold;
color: #FFFFFF;
text-align: left;
}
table tfoot {
font-weight: bold;
}
</style>
3. Click after </style>, type a slash (/), and select Insert dynamic content.
4. Under the Create HTML table menu, select Output.
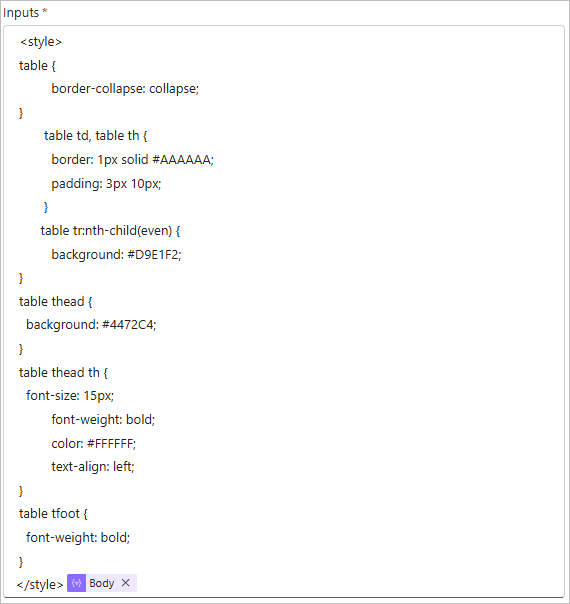
The table is now styled with delineated cells and blue backgrounds for the headers.
5. Click the Send an email (V2) action at the bottom of the flow.
The Send an email (V2) window opens.
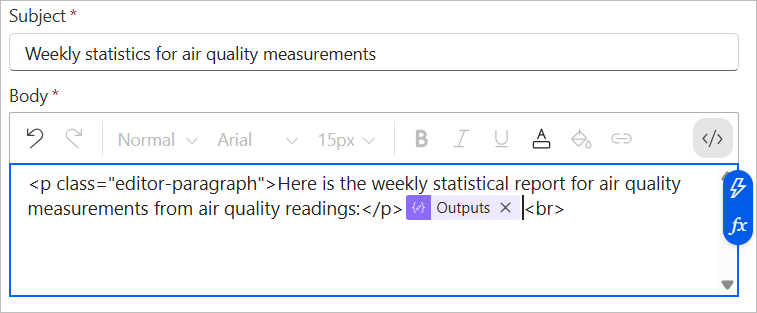
6. Update Subject and Body parameters with the following information:
- For the Subject parameter, type Weekly statistics for and type your value field.
- In the Body parameter, type Here is the weekly statistical report for [field] from [feature layer]: using the value field name and feature layer included in the report.
7. Press the Toggle code view button (</>).
8. Place your cursor after the last paragraph tag (</p>), type a slash (/), select Insert dynamic content, and select Outputs.
9. Press the Toggle code view button (</>) to return to text view.
10. Click Save at the top of the flow designer, and then click Test to ensure the flow works.
The flow will now send an email detailing the weekly statistics of a field from the feature layer in a formatted table.
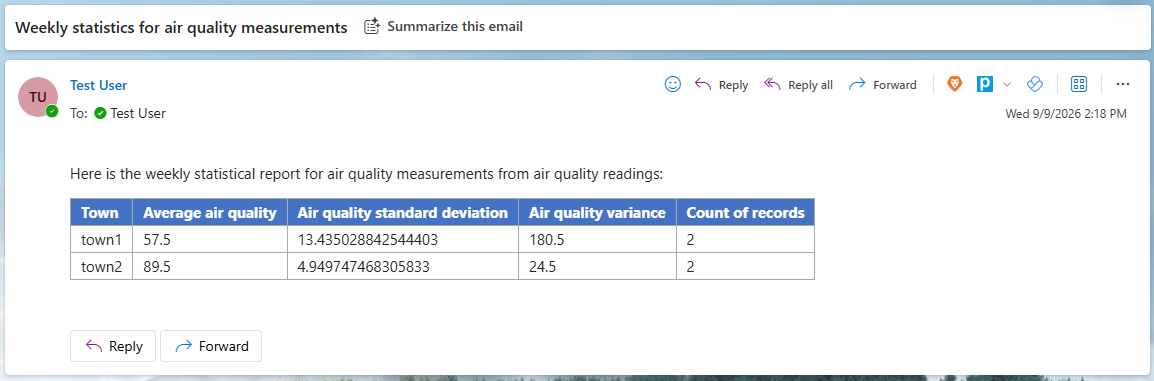
Note: If CSS styling breaks in the Microsoft Outlook desktop app, try opening the test email in a separate window.
By formatting dynamic content for automated data reports, you can share multiple statistics, with multiple people, without manually composing emails. This blog series enables continuous updates to collaborators and decision-makers on dynamic feature layers.
Additional resources
For more information on ArcGIS Connectors for Microsoft Power Automate see the following resources:





Article Discussion: