ArcGIS Monitor provides observability into your ArcGIS Enterprise deployments by collecting metrics on the health, performance, and usage of your enterprise GIS. It is designed to help administrators and managers ensure their ArcGIS Enterprise deployments are working efficiently by reducing and preventing system downtime, resulting in operational cost savings.
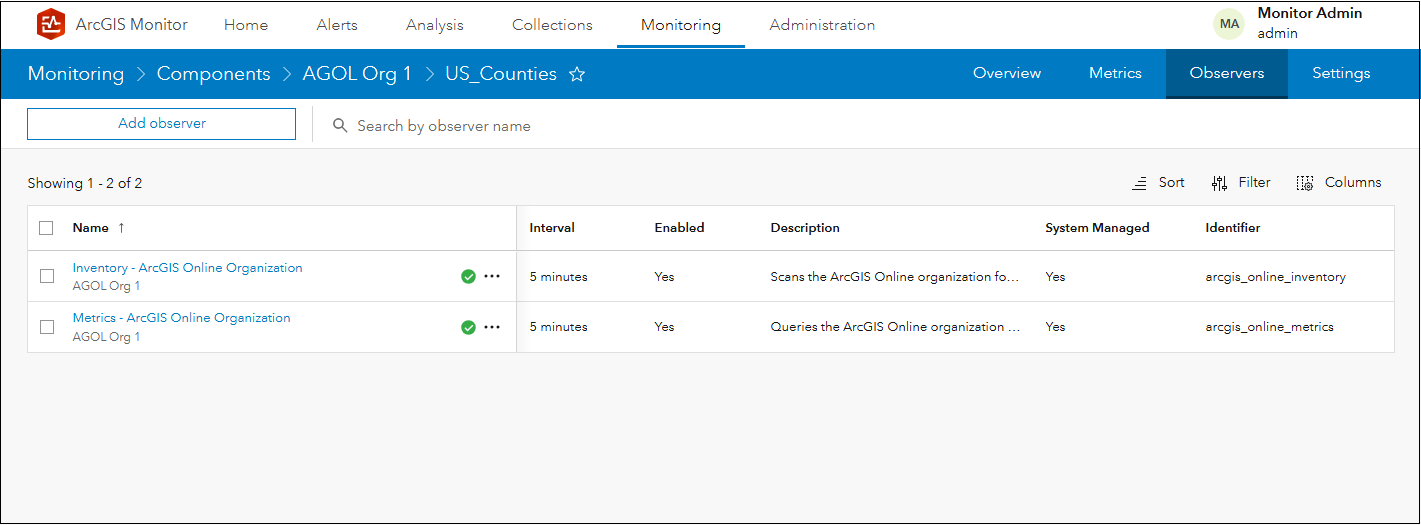
All enterprise GIS assets such as: enterprise portals, GIS Servers, services, geodatabases, and hosts become components when they are registered with ArcGIS Monitor. Every component in Monitor has observers which are responsible for collecting attribute and metric information about the component. Each component type has a unique set of observers that run at specified intervals. You can view the observers for a component by selecting the component on the Monitoring page > Observers subtab. For example, a service component in an ArcGIS Online organization has two observers: inventory and metrics.
You can learn more about the default observers for each component type in this help topic.
At the ArcGIS Monitor 2024.1 release, a Check-Service observer was introduced. This observer allows a Representational State Transfer (REST) request to be configured against a registered service component, which enables admins to apply requests to monitor a variety of scenarios. The observer sends the configured request and captures four metrics on a service component: check response code, check response size, check response matches and check response time. These ‘response check’ metrics can be helpful to admins for quantifying health and testing performance on Monitor service components.
To enable the Check-Service observer, under the Monitoring page > select a service component > Observers subtab. Click the Add observer button to display the Add Observer dialog. For Observer Type, select Check – Remote Service and click Next.
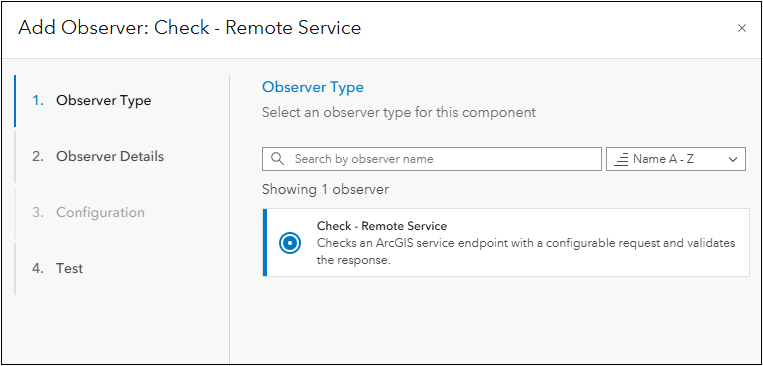
Note: In the image above, the Add Observer dialog displays Check – Remote Service option, because an ArcGIS Online service component was selected, the behavior is the same for third party ArcGIS Server site service components. However, for an ArcGIS Server service component, the dialog would display a Check – Service option.
Provide a name and description for the new observer that will be added to the service component. Click Next.
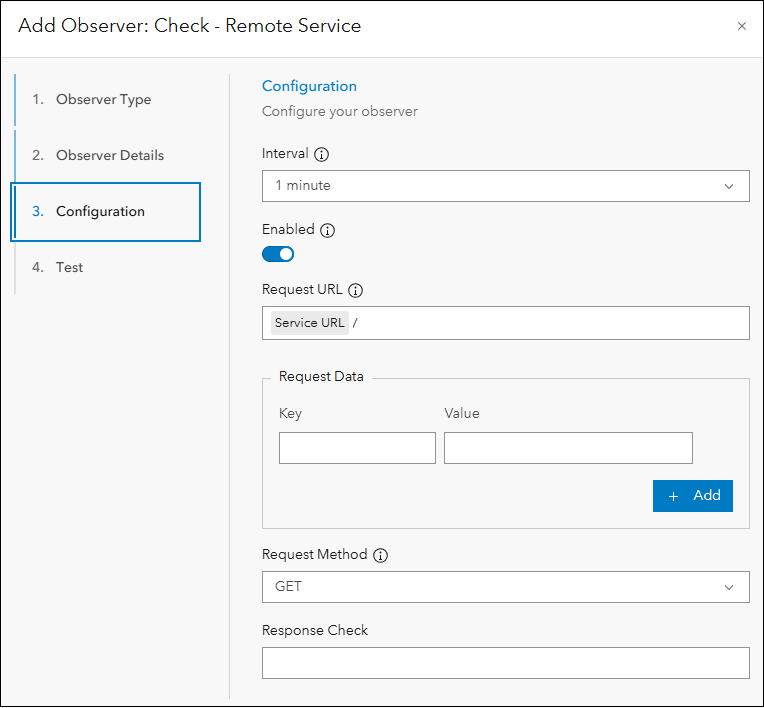
In the Configuration panel of the Add Observer dialog, this is where admins can configure different types of REST endpoint requests to apply to the registered service component. Typically, these would be applied to feature or map services. A comprehensive discussion on REST requests is beyond the scope of this blog, but you can learn more from the Query (Feature Service) and Export Map help topics, respectively from the Esri Developer site.
This blog will discuss three example use cases for using the Check-Service observer to apply some simple health and performance tests against a service component. The use cases are:
- Test to check features in a feature service
- Test response time for an export map operation on a map service
- Test for a specific response from a feature service (to check data integrity)
The intention is to illustrate the potential of the Check-Service observer to help admins test health and performance of Monitor service components.
1. Test to check features in a feature service
This is an easy and simple test to execute on a feature service. This query sends a request that queries all features in the feature service and returns their count. For example, you may have a feature service that is updated daily. You could apply this query at the end of each day to ensure new features were added and are available. This test checks that the service can be queried and can help measure performance.
In this example, the Check-Service observer is applied to a service component named US_Counties in an ArcGIS Online organization.
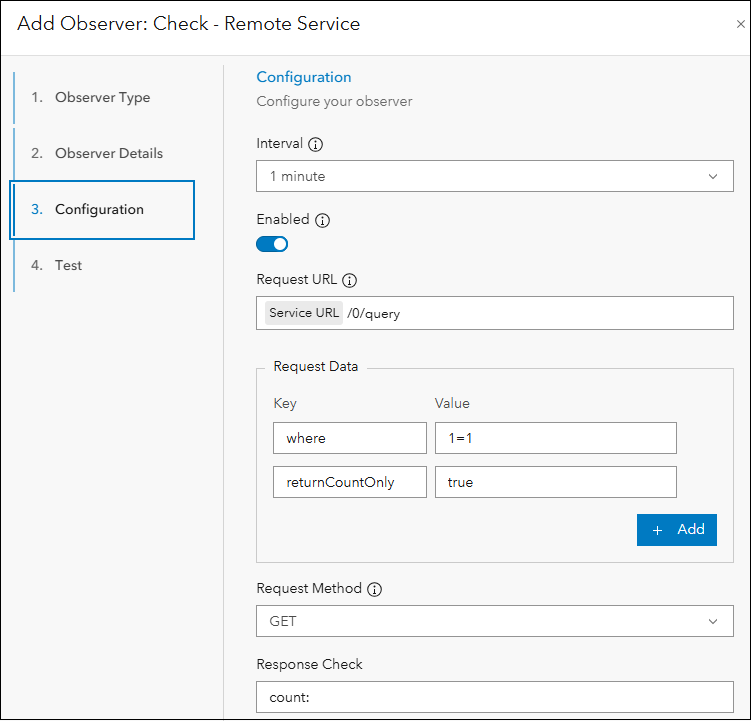
Where:
- Interval is 1 min, determines how often the configured request will be sent by the observer
- Enabled, determines if the observer will execute
- Request URL, specifies the layer and operation to be applied by the observer
- Request Data, this specifies the query string if you are sending a GET request, or a request body if you are sending a POST request; in this case “where 1 = 1” is the condition that returns all records from the service without any filtering, returnCountOnly is set to true to return a feature count
- Request Method is GET; this is the HTTP method over which the request will be sent
- Response Check, a prefix “count:” is added to the returned feature count in the response
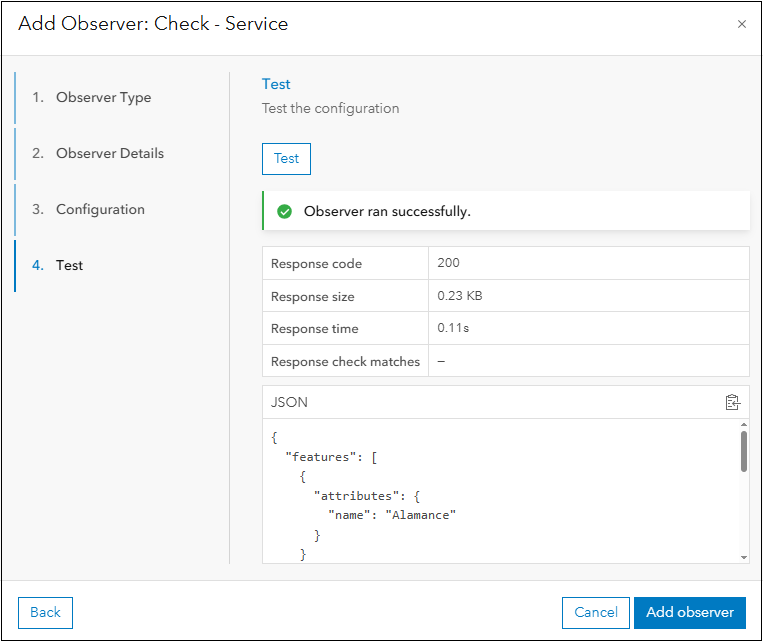
Click Next to advance to the Test panel. You can click Test to ensure the query configuration for the observer works.
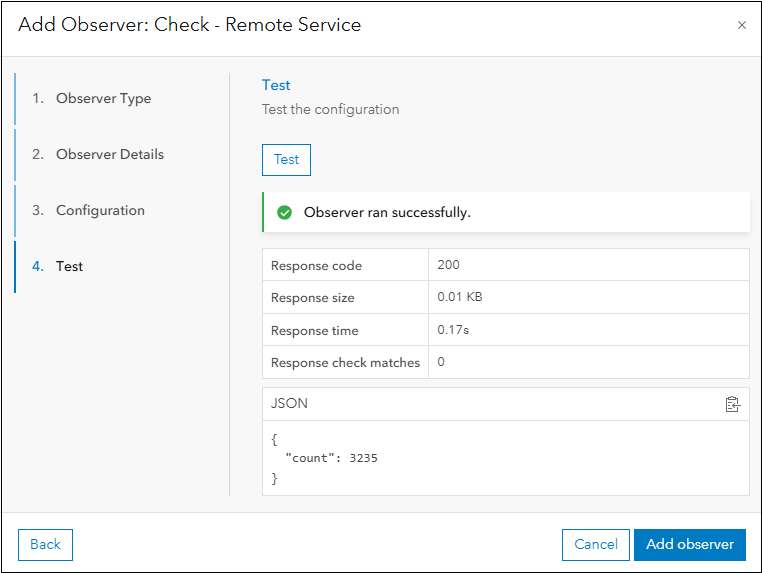
If the query successfully returned data from the US_Counties service component, an “Observer ran successfully” message is displayed, along with data for each of the four metrics provided by the Check-Service observer. The response code is 200, for REST API queries this indicates that the request was successfully completed. Note the JavaScript Object Notation (JSON) response is also shown, where “count: 3235” meaning 3235 features were returned.
Click Add observer to add it to the service component and create the metrics. The new observer appears under the Observers subtab for the US_Counties service component.
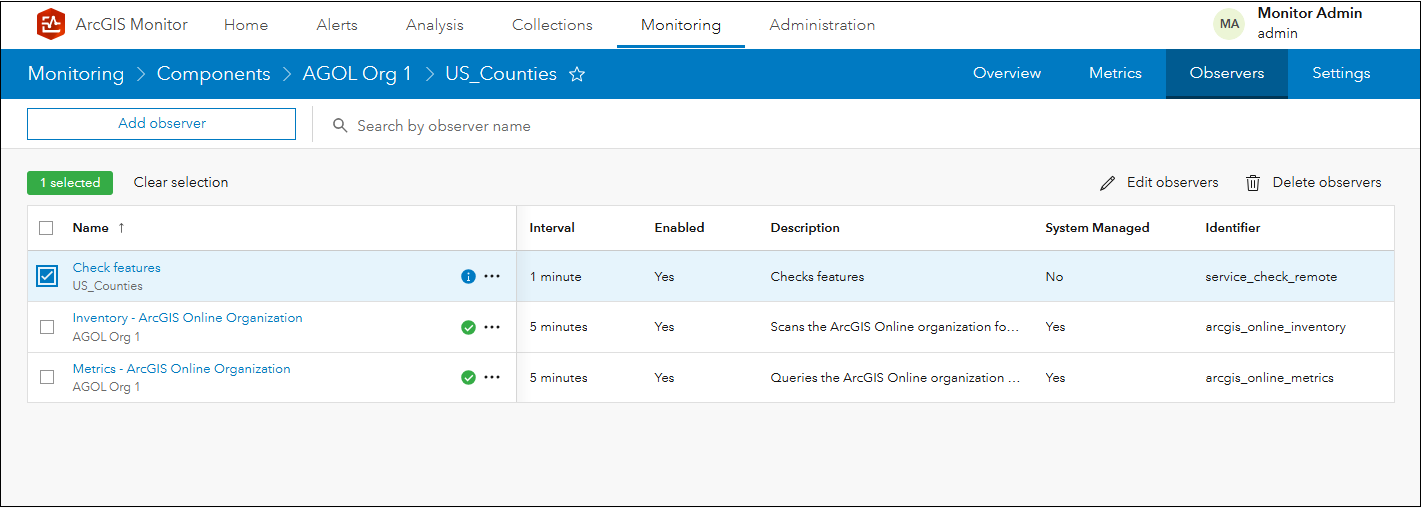
When you navigate to the Metrics subtab of the US_Counties service component, four new metrics provided by Check-Service observer appear. They will have the name of the user configured observer.
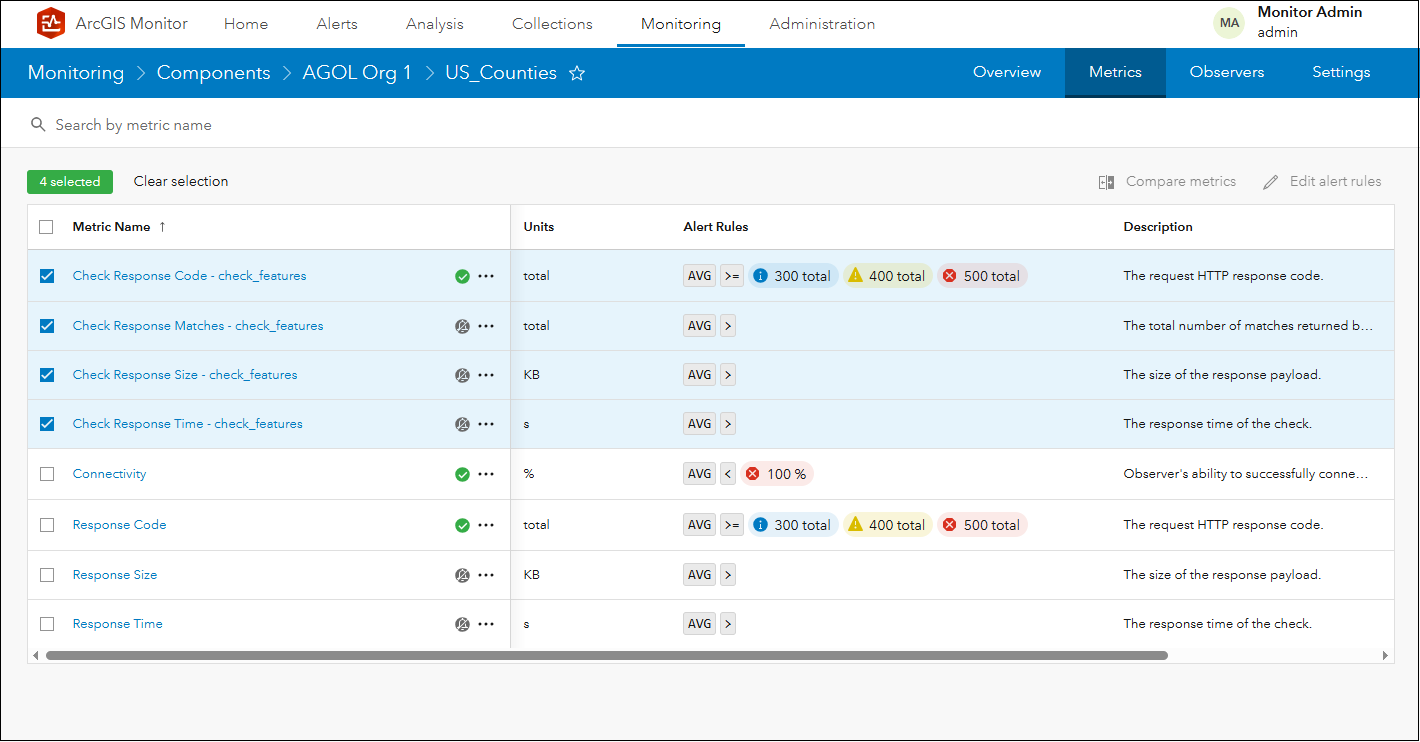
While it may seem like the new metrics are similar to the service component’s existing metrics (e.g., similar names) they are reporting different data. For example, Response Time for the US_Counties service reports the response time for the service:
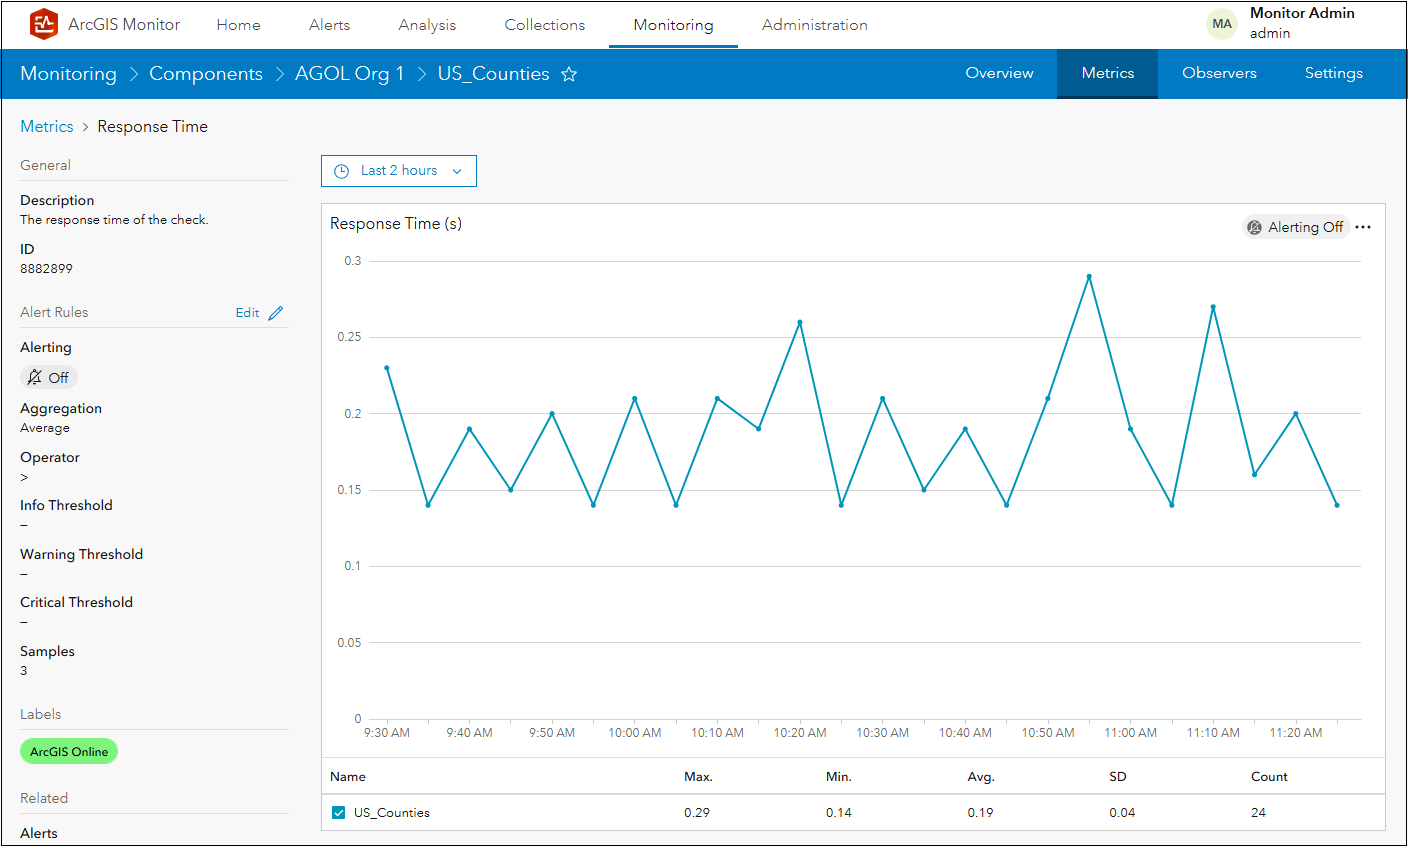
The Check Response Time – check_features, reports the response time for executing the Check-Service observer query for the US_Counties service.
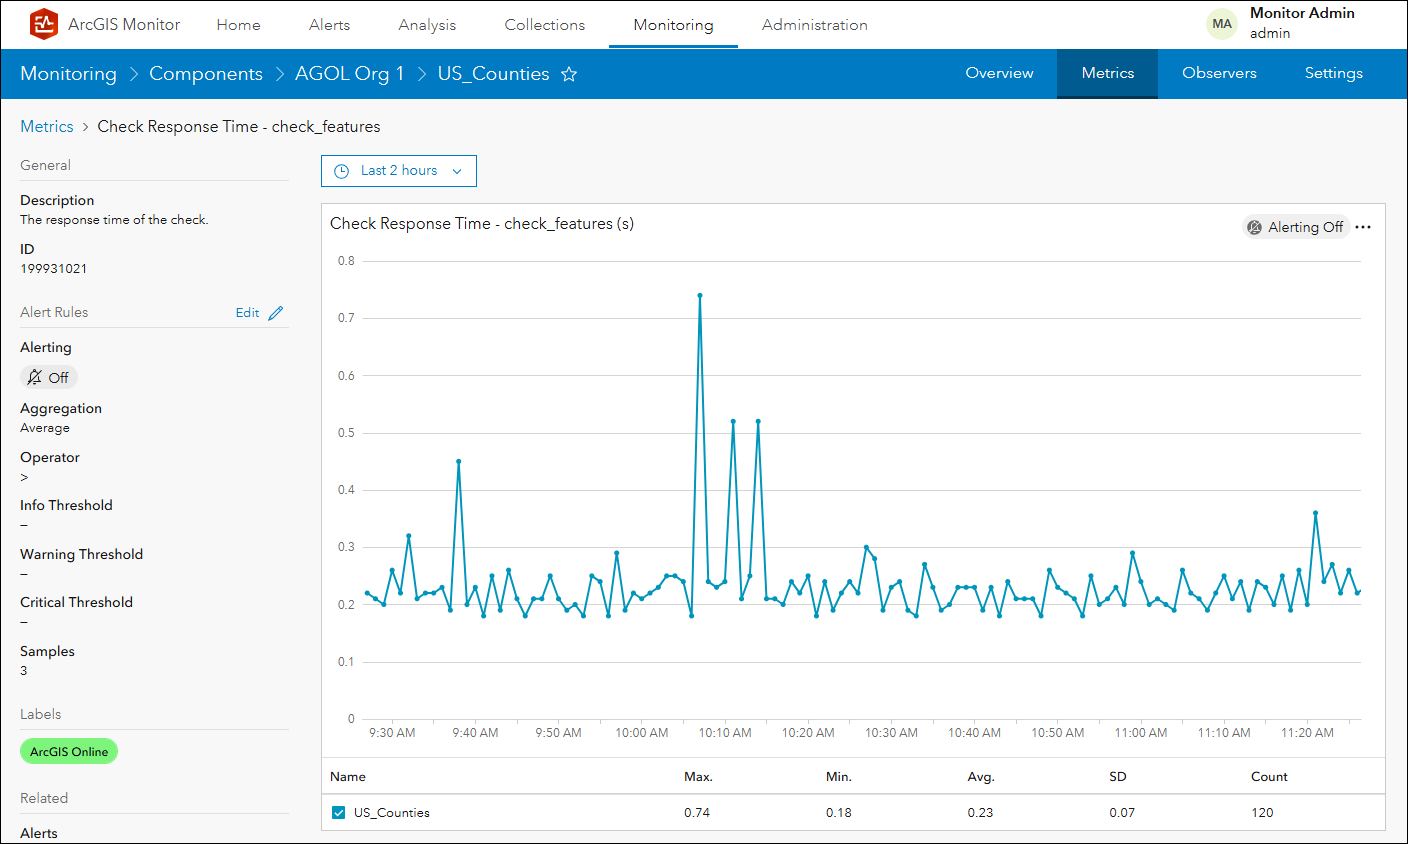
Observe the response time for executing the Check-Service observer query is low, which indicates fast responses.
2. Test response time for an export map operation on a map service
This second use case is for map services. The query specifies a bounding box that defines a spatial extent to be exported, which emulates the action of “zooming in” on a map service. In this example, the Check-Service observer is applied to a map service named SampleWorldCities in an ArcGIS Server component.
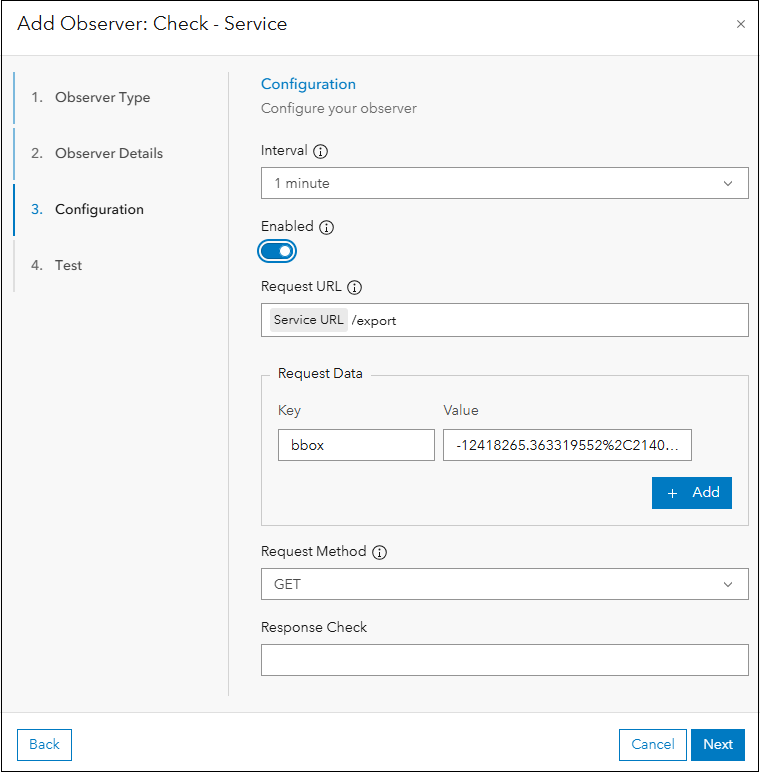
Where:
- Interval is 1 min, determines how often the configured request will be sent by the observer
- Enabled, determines if the observer will execute
- Request URL, specifies the layer and export operation to be applied by the observer
- Request Data, this specifies the spatial extent of the bounding box (bbox), defined as: <xmin>, <ymin>, <xmax>, <ymax> coordinate values (see Side note below for details)
- Request Method is GET, this is the HTTP method over which the request will be sent
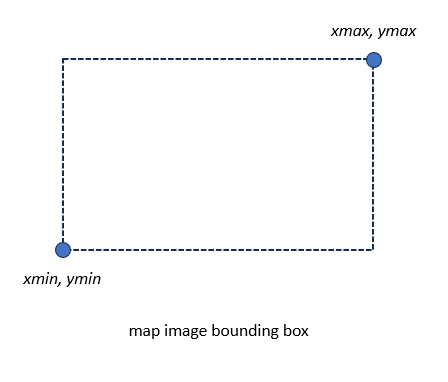
Side note: The export map operation uses a bounding box to define the spatial extent of the map image. It is defined by two coordinate pairs, a minimum and a maximum coordinates.
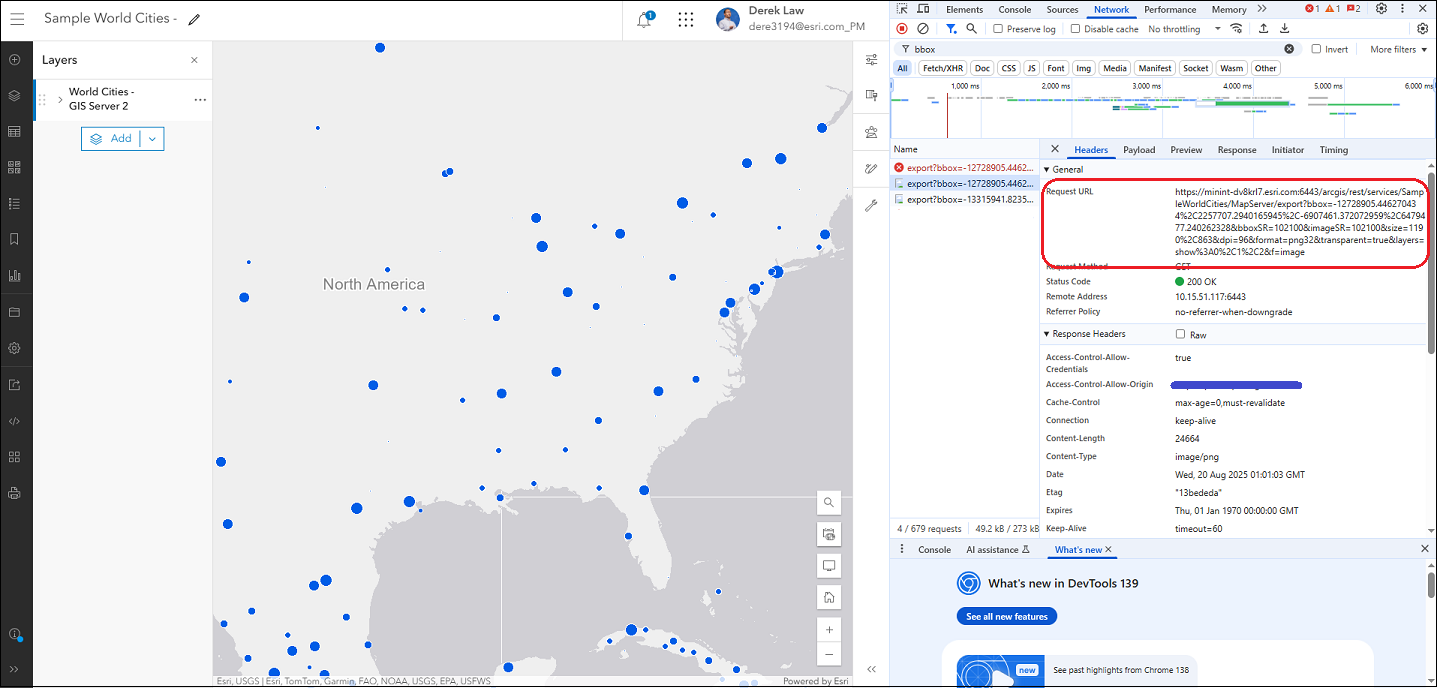
You can acquire the <xmin>, <ymin>, <xmax>, <ymax> coordinate values for the spatial extent of the bounding box with these simple steps,
- Open map service in the ArcGIS Online or enterprise portal Map Viewer.
- Access the web browser developer tools (the image below shows Chrome web browser).
- Find the request URL that is requesting the exported map image from the layer.
- Copy the values for the ‘bbox’ parameter.
A comprehensive discussion on this type of REST request is beyond the scope of this blog, but you can learn more from the Export Map help topic in the Esri Developer site.
Click Next to advance to the Test panel. You can click Test to ensure the query configuration for the observer works.
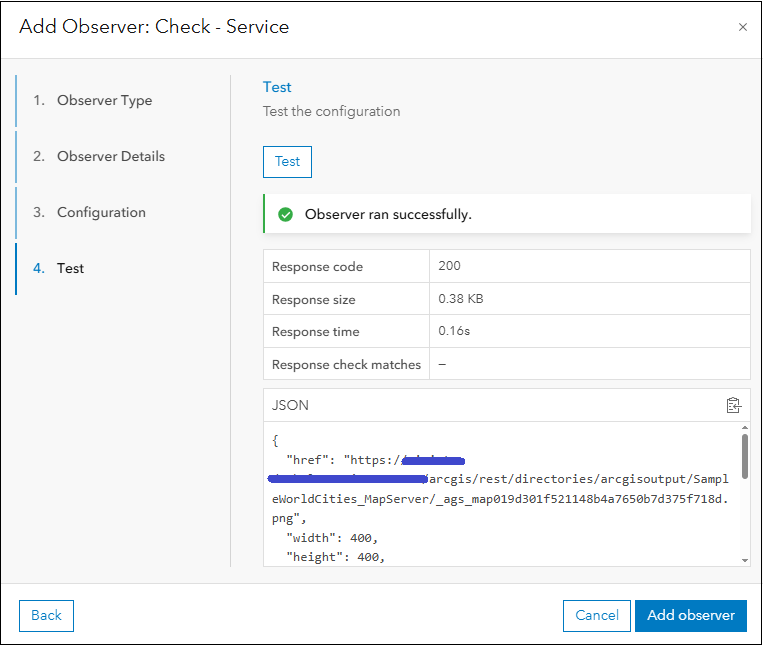
If the query successfully returned data from the SampleWorldCities service component, an “Observer ran successfully” message is displayed, along with data for each of the four metrics provided by the Check-Service observer. The response code is 200, for REST API queries this indicates that the request was successfully completed. Note the JSON response is also shown, in this case a URL to the exported image defined by the bounding box in the query.
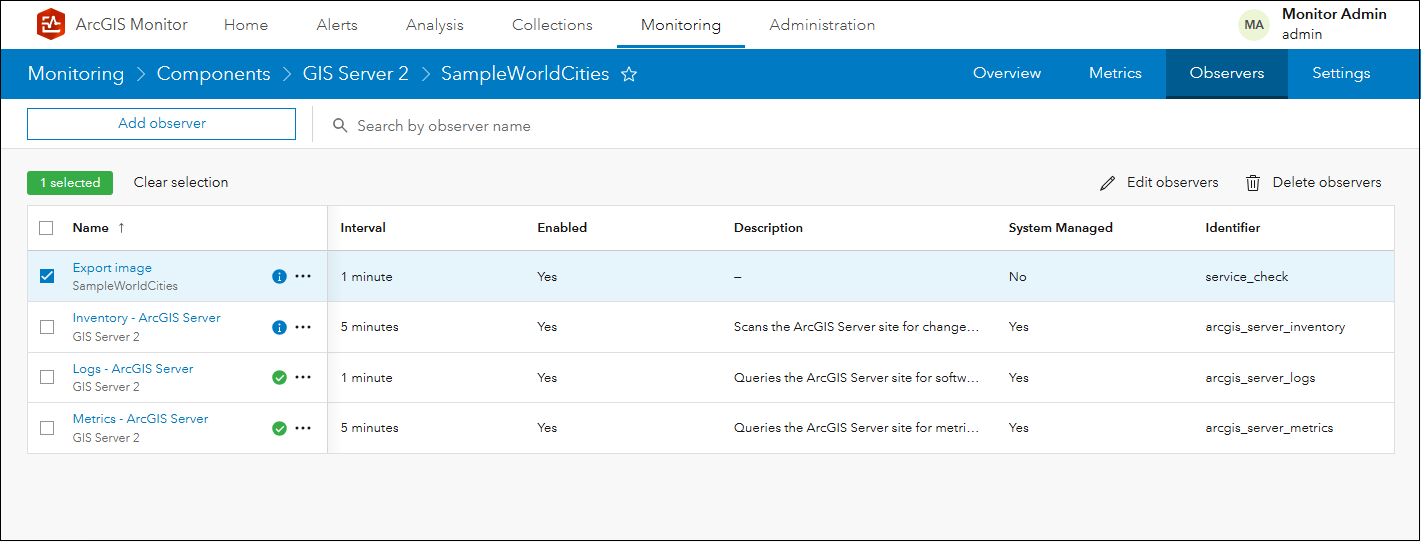
Click Add observer to add it to the service component and create the metrics. The new observer appears under the Observers subtab for the SampleWorldCities service component.
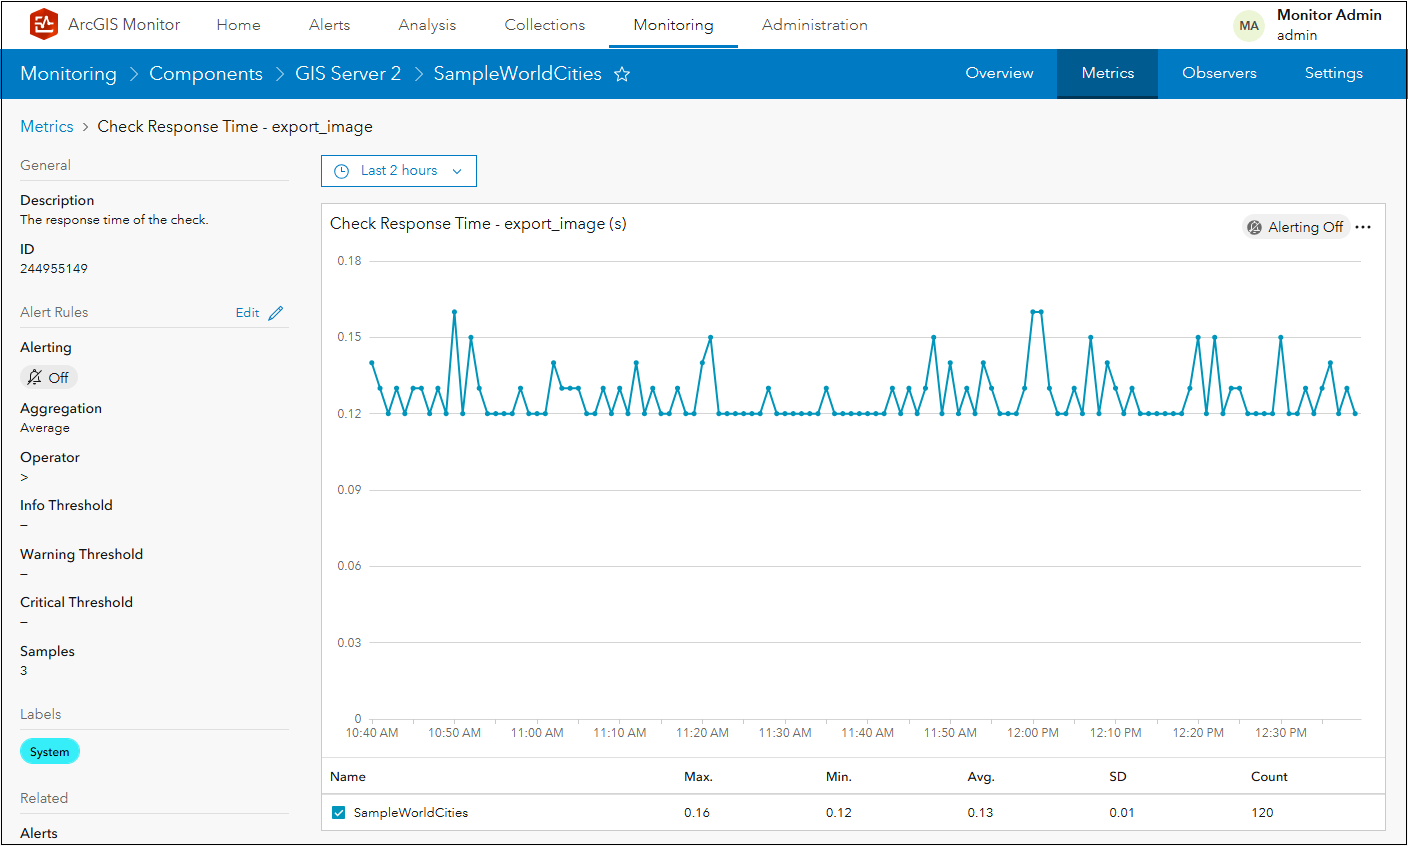
You can observe the response time for executing the Check-Service observer export image query. The resulting response time metric can be used to measure performance of the export map operation on a map service. And the response size metric can be an indicator that layers are correctly rendering within the spatial extent bounding box specified.
3. Test for a specific response from a feature service (to check data integrity)
In this last use case, the Check-Service observer can be used to query for specific data in a feature service. In this example, a feature service called NC_Counties contains all counties in North Carolina as polygon features. Each feature in the layer has an attribute field called “NAME” which contains the county names. The Check-Service observer will verify the integrity of the data in the layer by checking for the presence of Alamance county in the data. The query will search for a county with its NAME = Alamance.
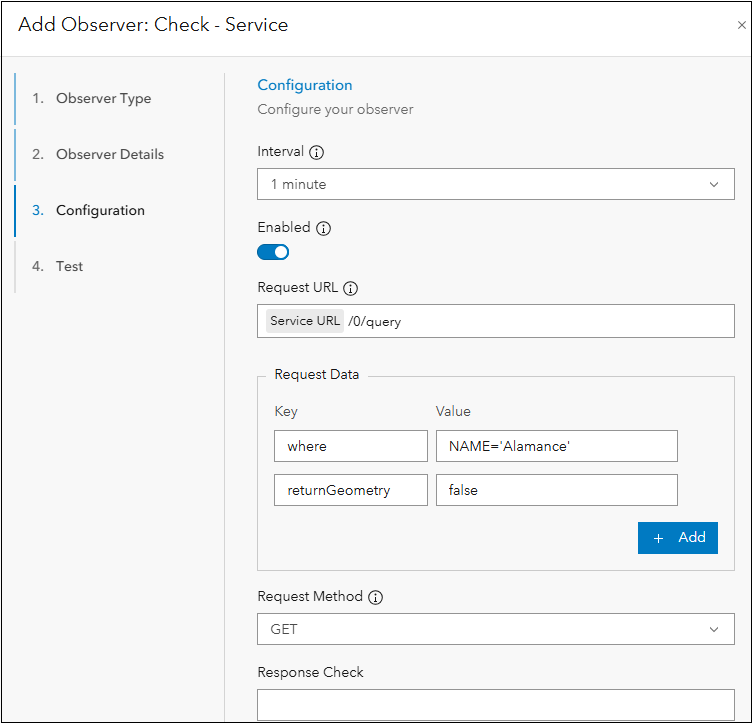
Where:
- Interval is 1 min, determines how often the configured request will be sent by the observer
- Enabled, determines if the observer will execute
- Request URL, specifies the layer and query operation to be applied by the observer
- Request Data, this specifies the query, in this case where “NAME = Alamance” and returnGeometry is false, so it only queries for the attribute information
- Request Method is GET, this is the HTTP method over which the request will be sent
Click Next to advance to the Test panel. You can click Test to ensure the query configuration for the observer works.
If the query successfully returned data from the NC_Counties service component, an “Observer ran successfully” message is displayed, along with data for each of the four metrics provided by the Check-Service observer. The response code is 200, for REST API queries this indicates that the request was successfully completed. Note the JSON response is also shown, in this case the specific feature, Alamance county.
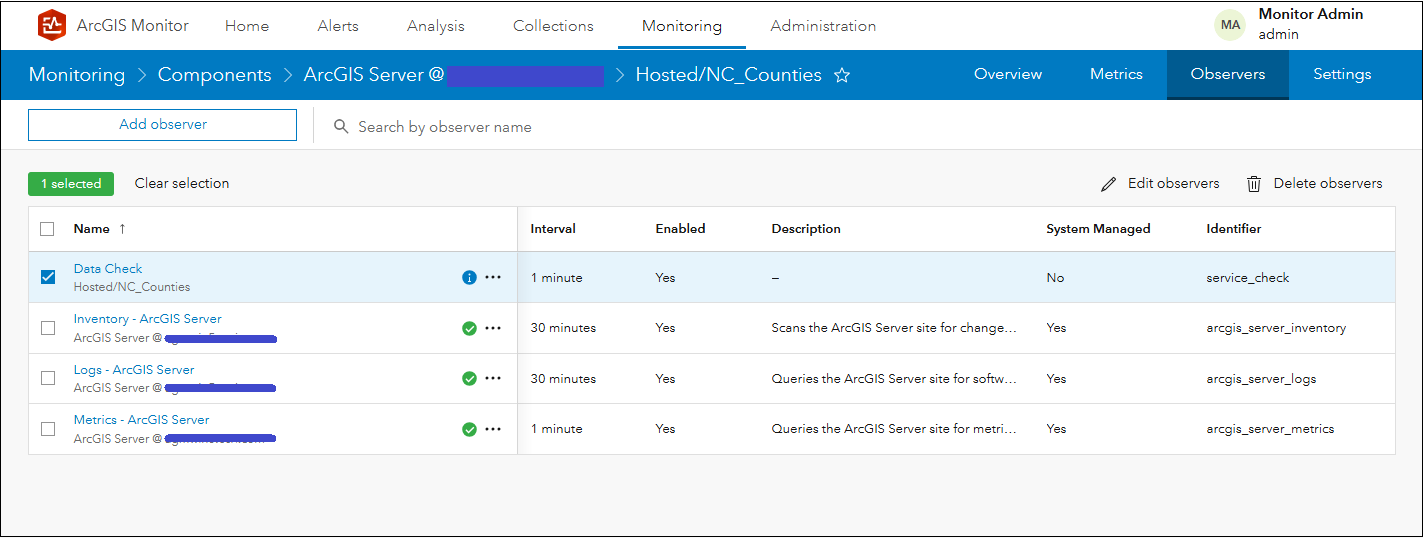
Click Add observer to add it to the service component and create the metrics. The new observer appears under the Observers subtab for the NC_Counties service component.
Configuring Alerts
After configuring the Check-Service observer and enabling the four additional metrics, alerts could be configured on the new metrics to indicate when no data is returned by the query. This can help indicate when there might be a problem with the service component.
This blog discusses three example use cases for using the Check-Service observer. However, you can leverage the observer to apply your own custom REST queries on feature and map services.
To learn more and connect with us about ArcGIS Monitor 2025.0, please visit:
Sincerely,
The ArcGIS Monitor team


great capability.
But, how would you take account of the possibility of caching impacting the validity of the observers for service requests?
E.g. Hosted Feature layers can have request responses cached in Object Store (or in CDNs or proxy servers between the Monitor and the ArcGIS Server/AGOL site). If the test request is the same each time, the results will come from the cache and perhaps not be a good indication of the health of the service.
I’m interested in using the Check-Service observer to alert me when a service(s) go down. Am I correct in assuming that in order to do that, you would need to configure the observer with each REST Service component individually?