Whether you’re building your first dashboard or refining an existing one, the November 2026 update of ArcGIS Dashboards in ArcGIS Enterprise 12.2 is designed to help you move faster, communicate more clearly, and trust what you see.
This update focuses on making dashboards easier to use in everyday workflows, with improvements that simplify how you build, manage, and communicate information.
Key features
- Protect sensitive information with classification labels
- Improve table header readability with line breaks
- A smoother experience from the start
- More consistent, intuitive interactions
- Make information easier to understand at a glance
- Add more context to your dashboards
- Create dashboards for broader audiences
- Explore what’s new

Protect sensitive information with classification labels
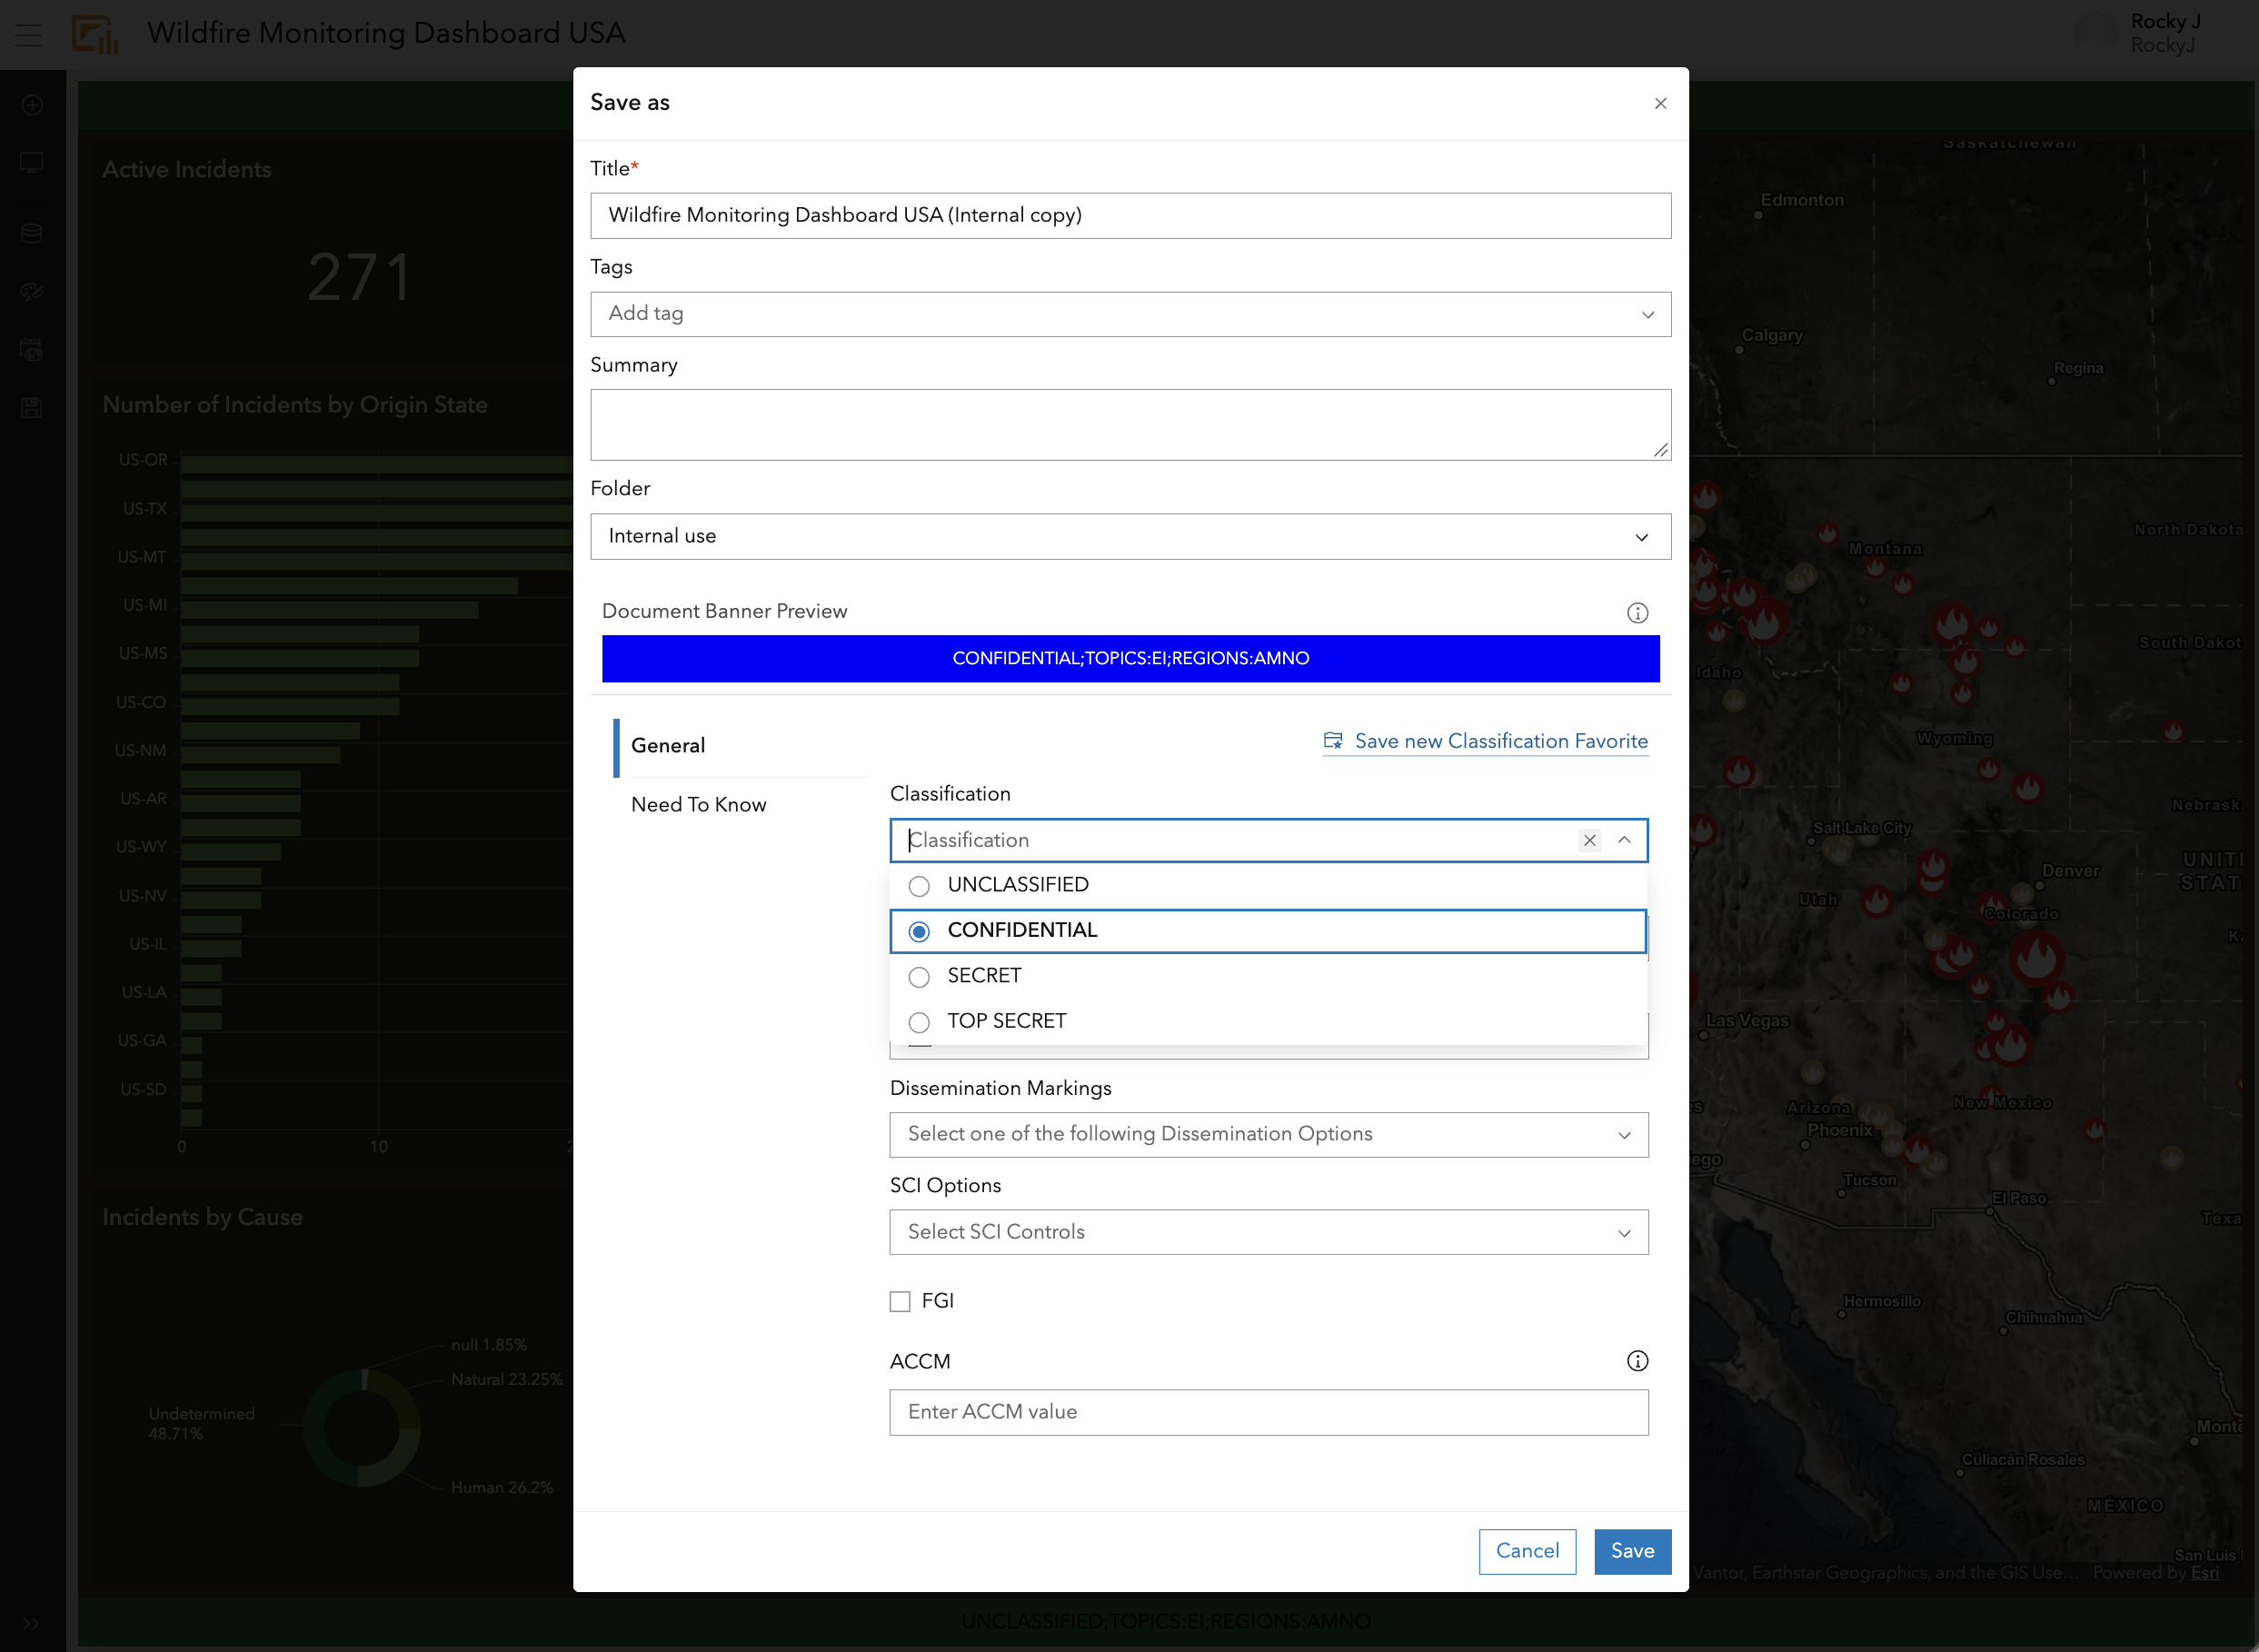
You can now apply organizational classification labels to dashboards to help communicate data sensitivity and support information governance requirements. Classification labels give teams a clear way to understand how dashboard content should be handled and shared across their organization.

Improve table header readability with line breaks
Table headers now support line breaks, giving you more control over how longer headers appear when space is limited. Instead of allowing longer text to be cut off, you can choose where a header wraps, helping keep important information visible while maintaining a clean, organized table.
A smoother experience from the start
Whether you’re creating your first dashboard or working with an existing one, this update introduces improvements that make everyday workflows feel smoother and more consistent.
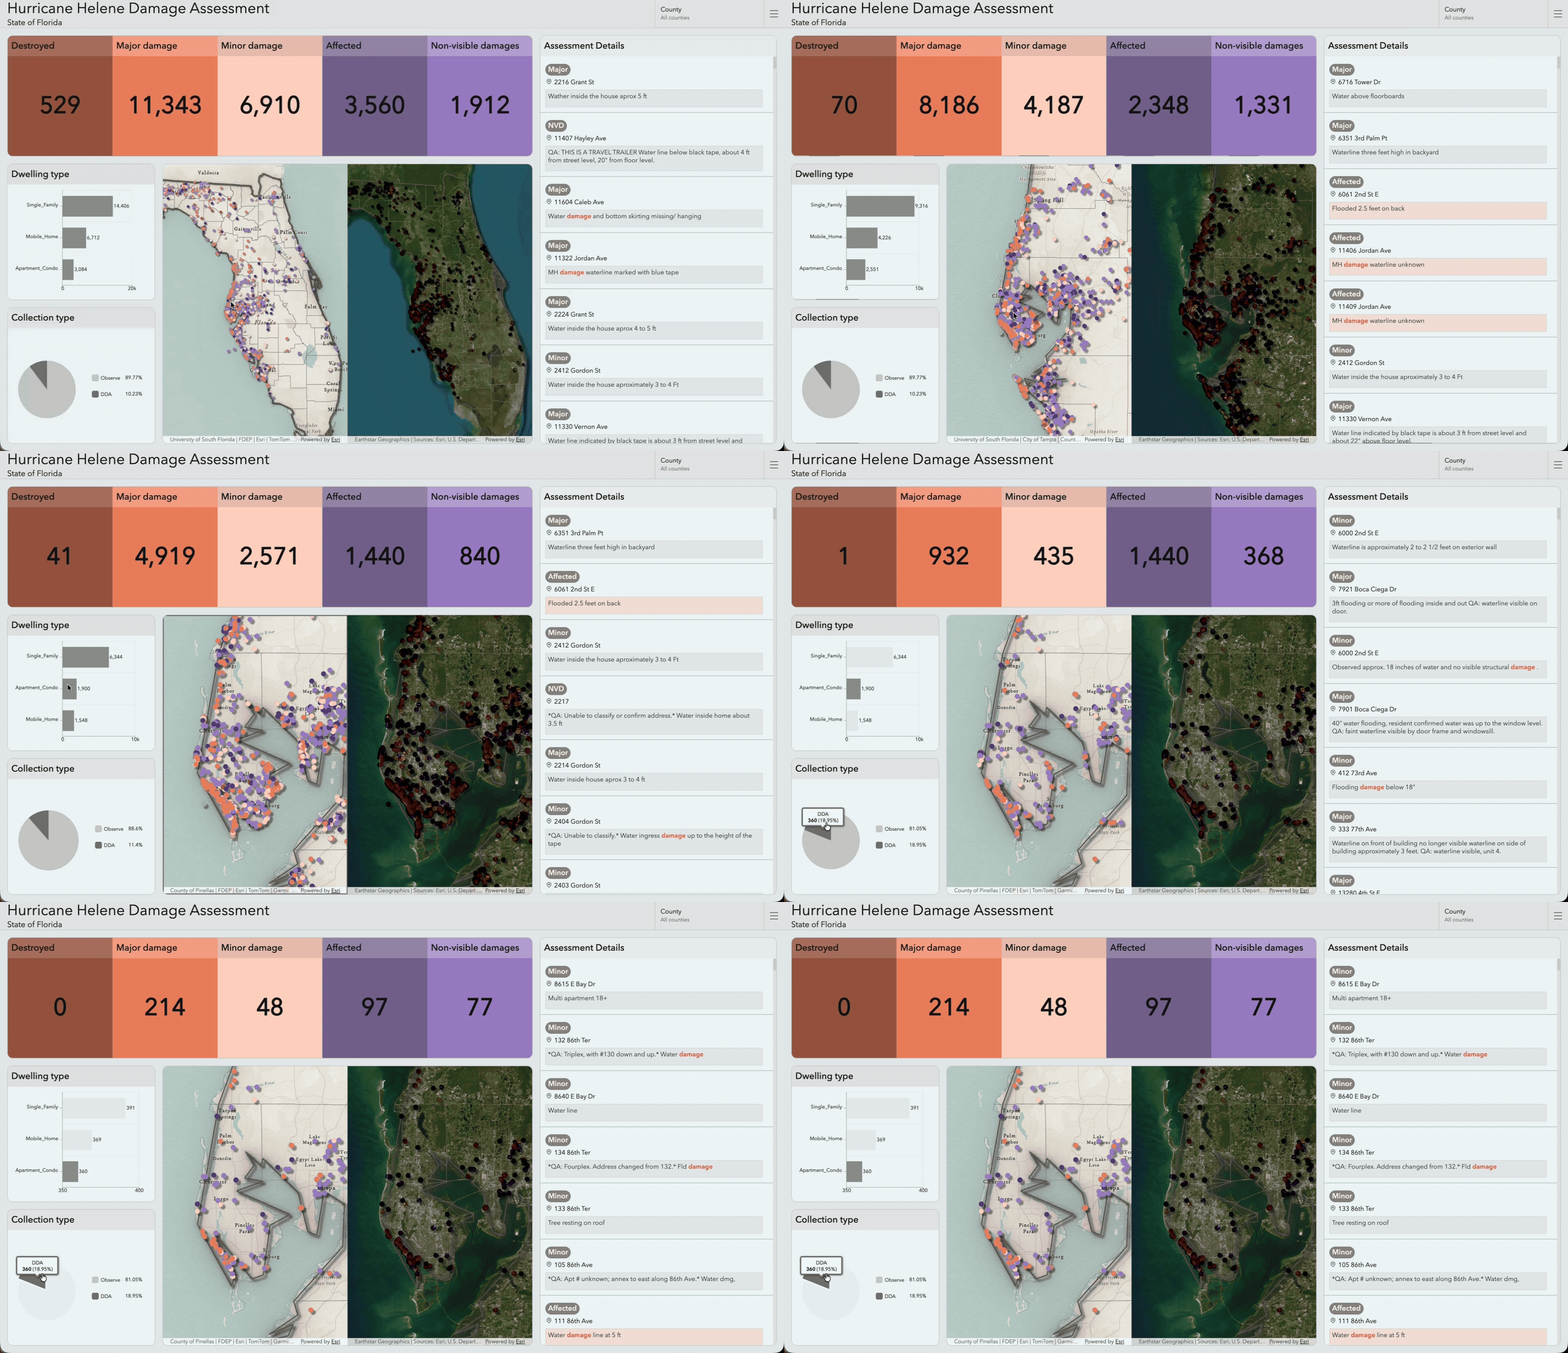
Performance improvements help dashboards load and respond more efficiently, including in environments with heavier usage. Elements and interactions also behave more consistently as users explore information throughout a dashboard.
More consistent, intuitive interactions
Working with dashboards is easier when interactions behave consistently across different elements.
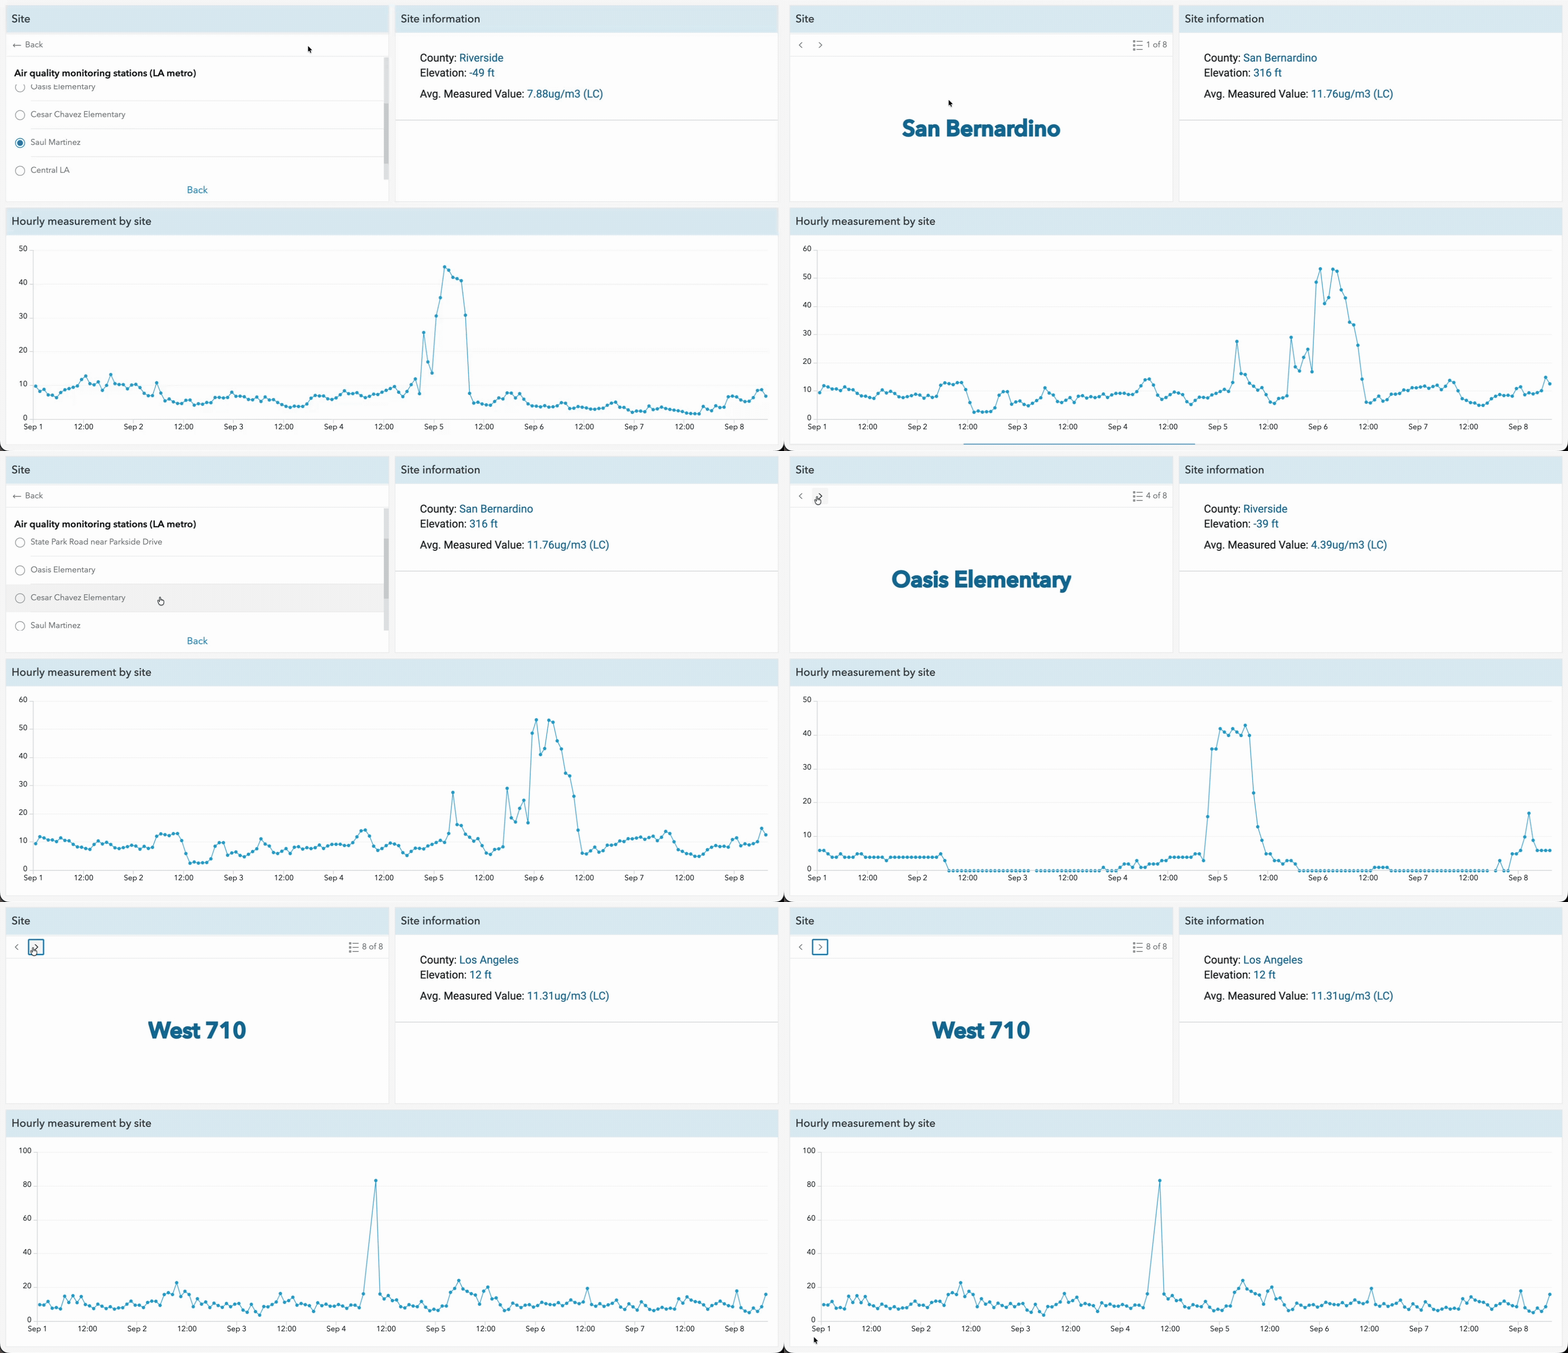
Lists, tables, indicators, and details now follow more consistent interaction patterns, helping reduce the amount users need to learn as they move throughout a dashboard. Pagination is also unified across feature-based elements, making it easier to move between records and jump to the information you need.
Selectors have also been simplified:
- A built-in unselected state clearly indicates when no filter is applied.
- Authors can define whether a selection is required.
- Date selectors focus on a single purpose, either precise date selection or relative filtering.
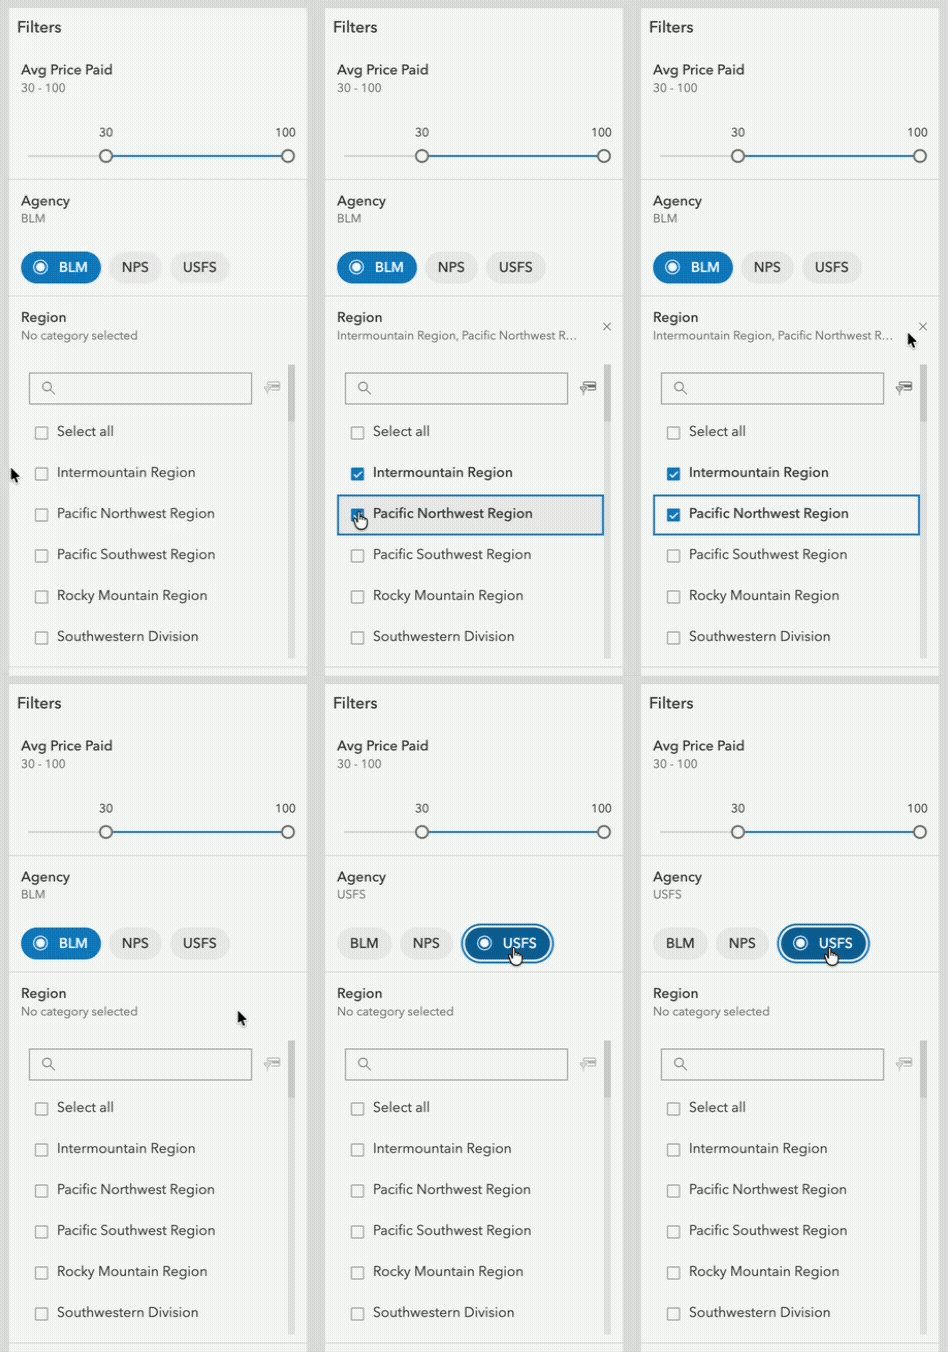
Together, these updates create a more predictable experience for both dashboard authors and viewers.
Make information easier to understand at a glance
Dashboards often need to communicate important information quickly, and this update improves how that information is presented.
Indicators now scale text more consistently, helping maintain visual hierarchy and making values easier to compare across a dashboard.
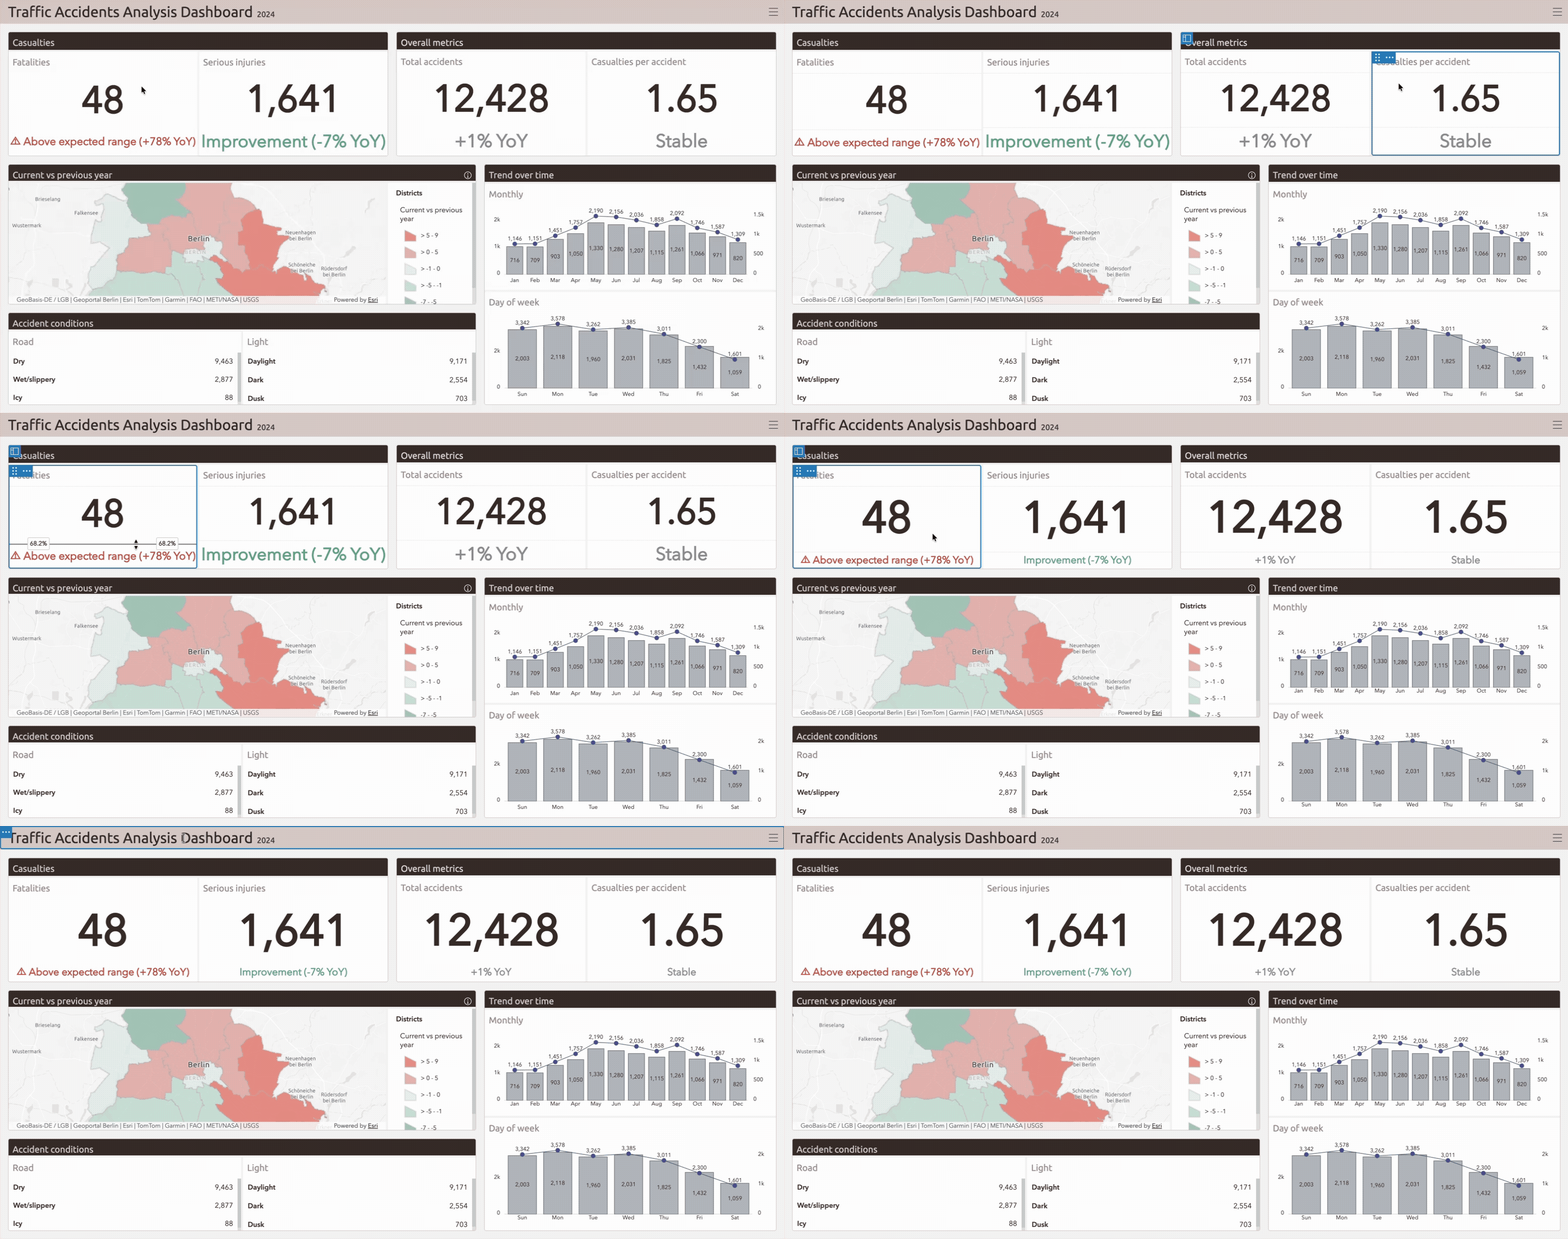
System messages such as “No Data” and “Selection Required” have also been redesigned with a more consistent structure and clearer guidance. These improvements make it easier for viewers to understand what they’re seeing and what, if anything, they need to do next.
Add more context to your dashboards
Dashboards can do more than show what’s happening. They can also provide the context needed to understand why the information matters.
The Rich Text element can now include live data from layers, maps, or Arcade expressions, allowing narrative content to update as the underlying data changes.
Learn more in THIS BLOG by Rocky Jia!
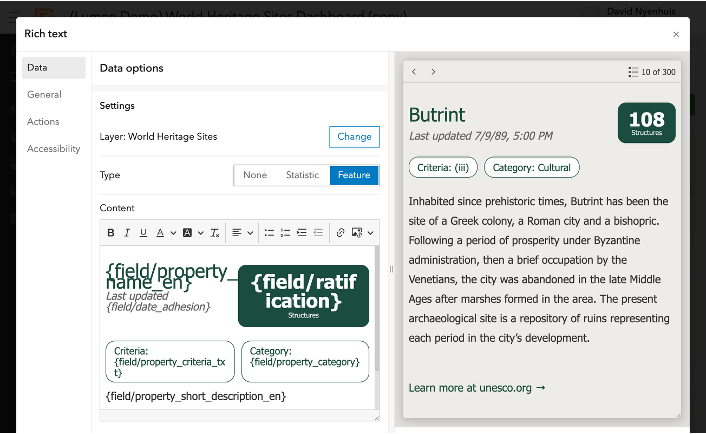
The Details element also supports related records, giving viewers a way to move from a selected feature to associated information directly within the dashboard.
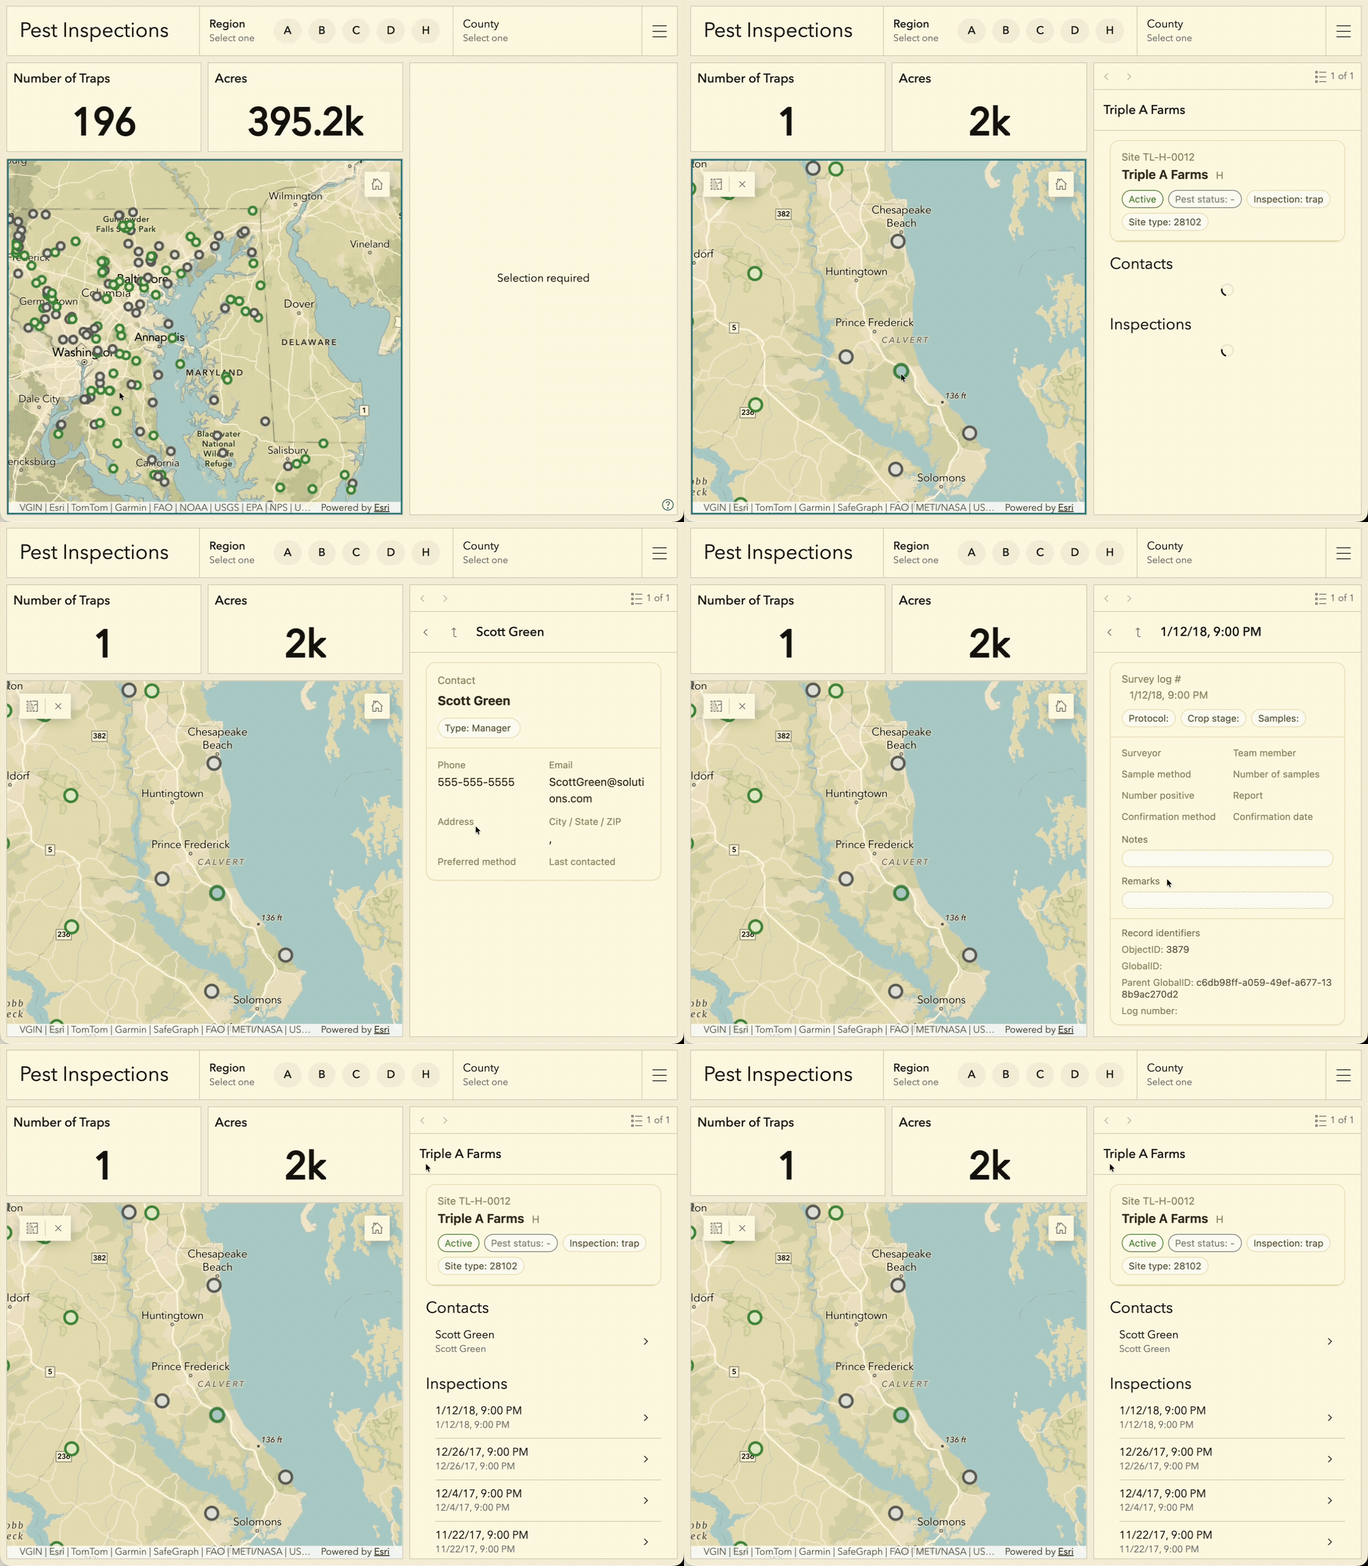
Together, these capabilities make it easier to combine data with context and help viewers understand the story behind the information they’re exploring.
Create dashboards for broader audiences
Dashboards can now better support different languages, regions, and accessibility needs.
Authors can define layout direction as left-to-right, right-to-left, or based on the viewer’s settings, helping dashboard layouts better align with language and regional expectations.
Learn more in THIS BLOG by Olga Serebryannaya!
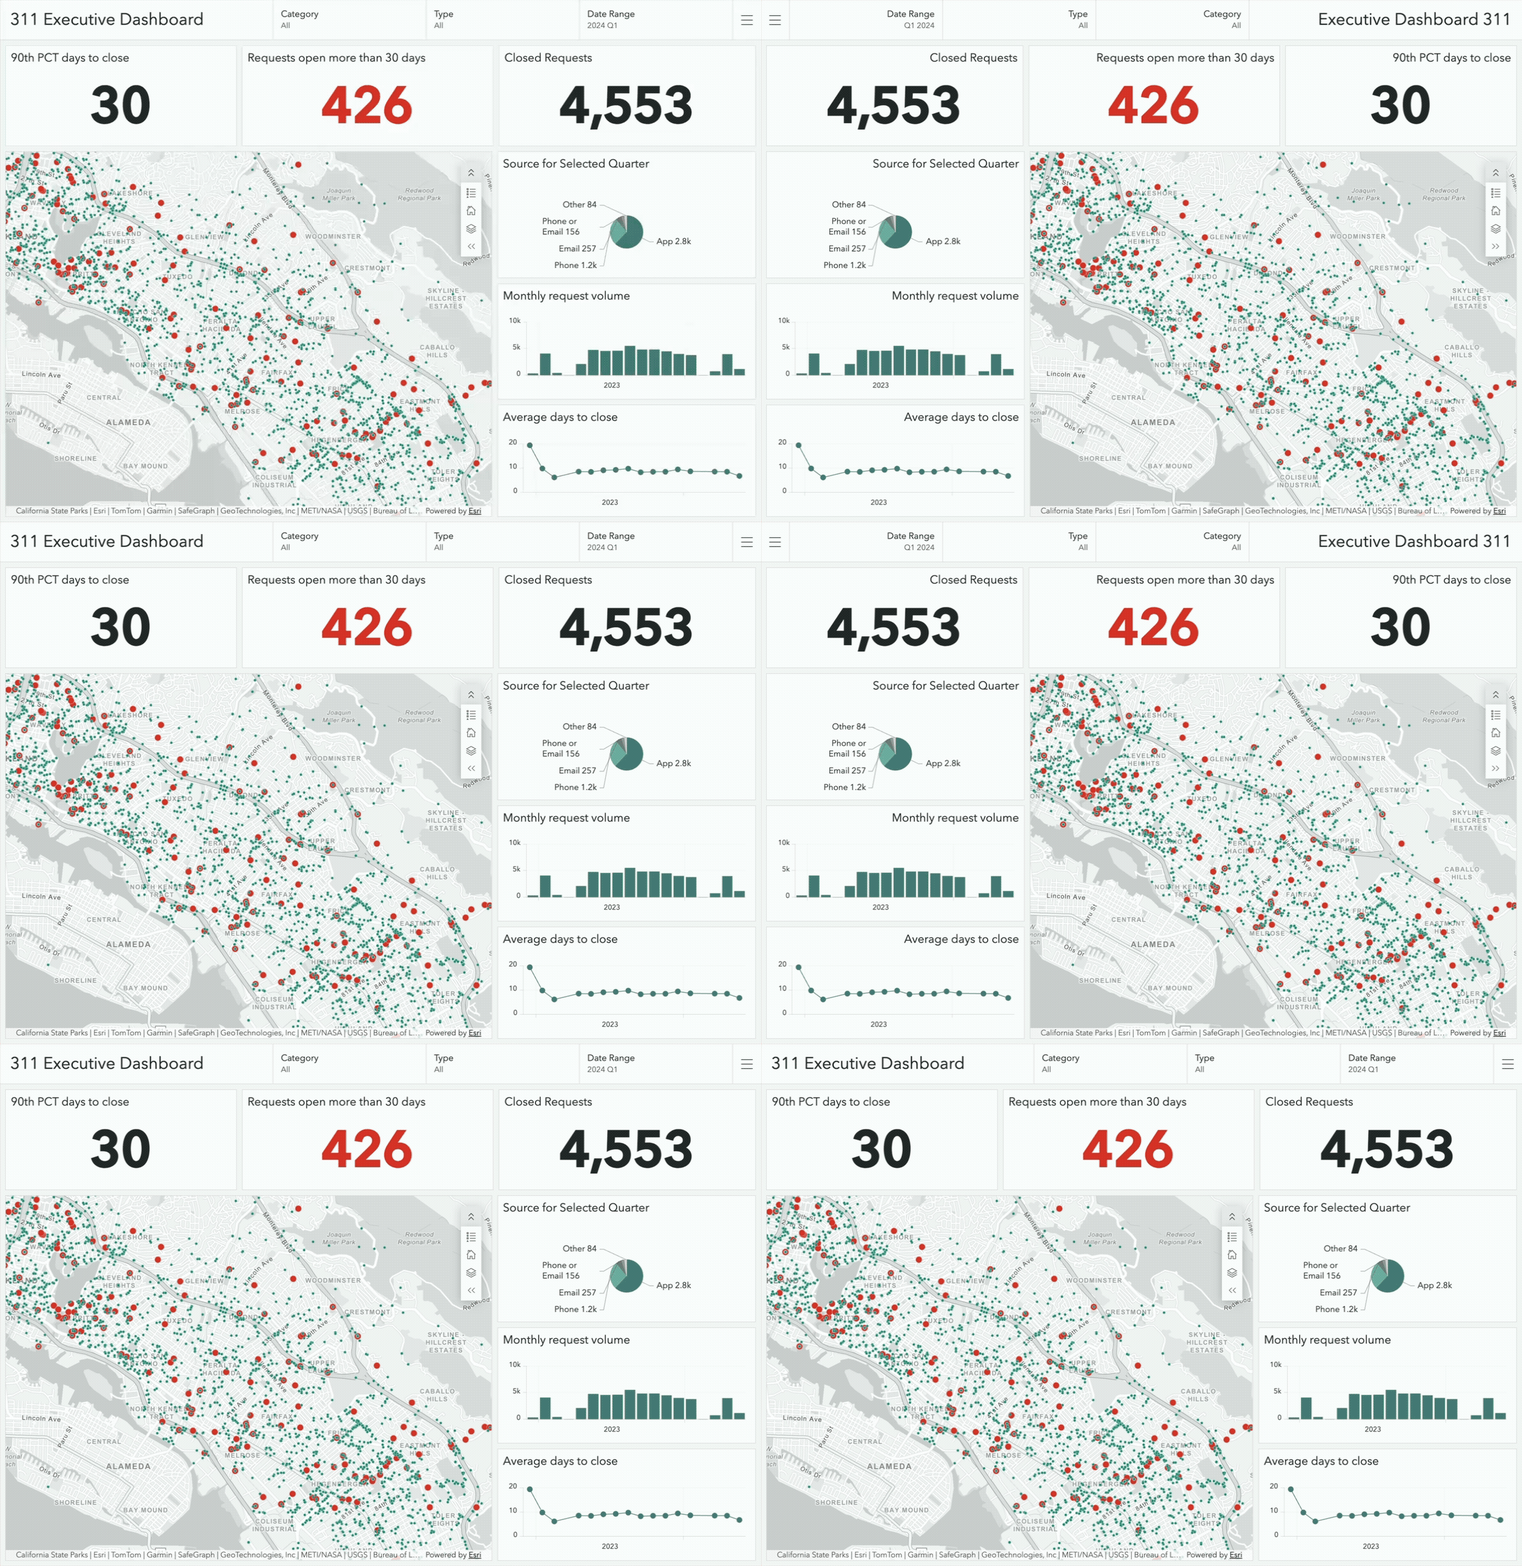
More consistent system messaging and interaction patterns also help create a clearer, more accessible experience across different audiences and ways of interacting with a dashboard.
Explore what’s new
Whether you’re building your first dashboard or managing a larger collection, the ArcGIS Dashboards in ArcGIS Enterprise 12.2 update brings improvements that make everyday workflows more intuitive, information easier to understand, and dashboards more effective at communicating insights.
For more information on the latest enhancements, explore the product release notes. We also encourage you to join the Esri Community to connect with other users, ask questions, and access resources that can help you get the most out of ArcGIS Dashboards.


Article Discussion: