3D is how we see the world. With 3D Web GIS, you bring an extra dimension into the picture. See your data in its true perspective in remarkable photorealistic detail, or use 3D symbols to communicate quantitative data in imaginative ways, creating better understanding and bringing visual insight to tricky problems.
The Evolution of 3D Mapping
Throughout history, geographic information has been authored and presented in the form of two-dimensional maps on the best available flat surface of the era—scrawled in the dirt, on animal skins and cave walls, hand-drawn on parchment, then onto mechanically printed paper, and finally onto computer screens in all their current shapes and sizes. Regardless of the delivery system, the result has been a consistently flat representation of the world. These 2D maps were (and still are) quite useful for many purposes, such as finding your way in an unfamiliar city or determining legal boundaries, but they’re restricted by their top-down view of the world.
Three-dimensional depictions of geographic data have been around for centuries. Artistic bird’s-eye views found popularity as a way to map cities and small-extent landscapes that regular people could intuitively understand. But because these were static and could not be used directly for measurement or analysis, they were often considered mere confections, or novelties, by serious cartographers, not a means of delivering authoritative content.
However, this is no longer the case since ArcGIS introduced the concept of a “scene,” which is actually more than just a 3D map. In a scene, you can also control things like lighting, camera tilt, and angle of view. The mapmaker can craft a scene that creates a highly realistic representation of geographic information in three dimensions, which provides an entirely new way for the audience to interact with geographic content. Spatial information that is inherently 3D, such as the topography of the landscape, the built world, and even subsurface geology, can now be displayed not only intuitively and visually but also quantifiably and measurably, so that we can do real analysis and hard science using 3D data.
Advantages of 3D
Vertical Information
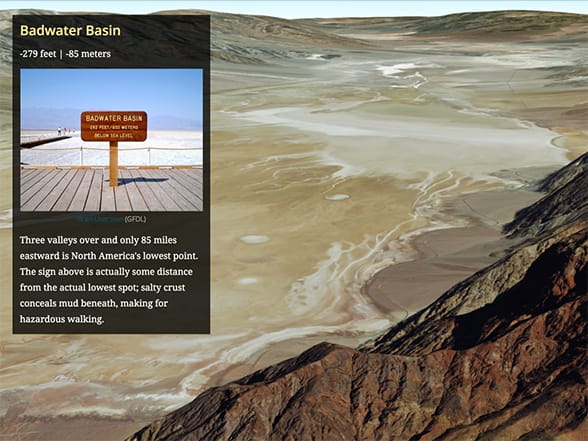
The most obvious advantage of a scene is its ability to incorporate vertical (and thus volumetric) information—the surface elevation of mountains, the surrounding landscape, the shapes of buildings, or the flight paths of jetliners. It’s the power of the Z.

Intuitive Symbology
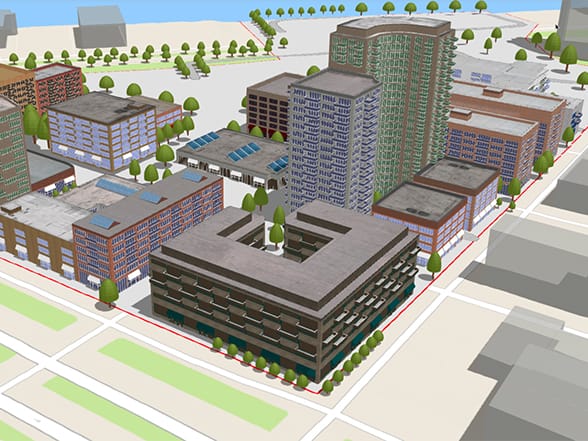
In 3D, the extra dimension enables you to include more readily recognized symbols to make your maps more intuitive. You are able to see all the “data” from all viewpoints in situ. Every symbol that you recognize on a map saves you the effort of referring to the legend to make sure you understand what it shows.
Showing Real-world, Bird’s-eye Views
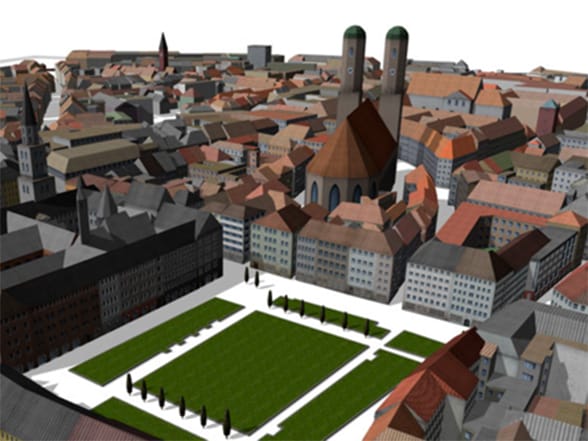
Many of man’s earliest maps, particularly of cities and smaller human habitations, were portrayed as scenes. These stylized maps were created as static 3D bird’s-eye views and were successful in providing understanding of a place. Today’s GIS authors interact with and see these scenes from many perspectives.
Human-style Navigation
For most of our living moments, we experience the world within a few feet of the ground. 3D allows us to replicate this view. With data presented from this approachable perspective, the size and relative positions of objects are intuitively understood as you wander virtually through the scene. There’s no need to explain that you’re in a forest or that a lake is blocking your route—the 3D perspective immediately makes the features recognizable.

This post is excerpted from The ArcGIS Book, Second Edition: 10 Big Ideas about Applying The Science of Where by Christian Harder and Clint Brown. The twin goals of this book are to open your eyes to what is now possible with Web GIS, and then spur you into action by putting the technology and deep data resources in your hands. The book is available through Amazon.com and other booksellers, and is also available at TheArcGISBook.com for free.

Commenting is not enabled for this article.