Discover how dashboards improve decision making in chapter 9 of The ArcGIS Book
Dashboards provide actionable views into the daily operations of organizations, empowering decision makers and stakeholders with the latest information they need to drive current and future ideas and strategies. Real-time dashboards answer questions like: What’s happening right now? Where is it happening? Who is affected? What assets are available? Where are my people? Chapter 9 of The ArcGIS Book illustrates many applications of dashboards in a variety of industries.
Real-time GIS can be characterized as a continuous stream of events flowing from sensors or data feeds. Each event represents the latest state, including position, temperature, concentration, pressure, voltage, water level, altitude, speed, distance, and directional information flowing from a sensor.
With real-time GIS, you acquire real-time data, perform continuous processing and analysis, and communicate updates and alerts to those who need it, where they need it, in a way that is convenient for them. Of course, maps provide one of the most basic frameworks for viewing, monitoring, and responding to real-time data feeds.
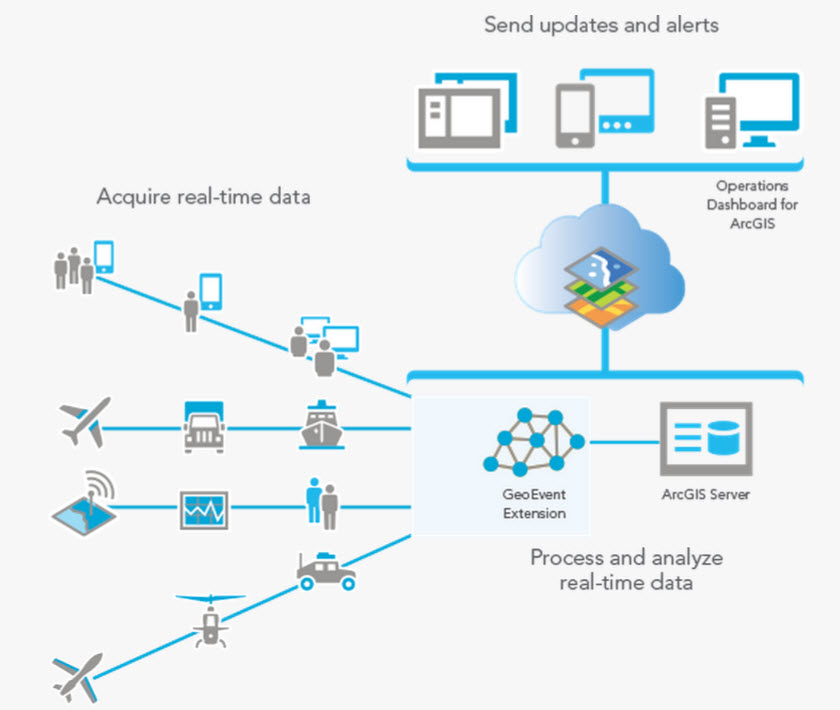
This chapter outlines the capabilities of ArcGIS GeoEvent Extension for Server and Operations Dashboard for ArcGIS. GeoEvent is an extension to ArcGIS for Server that brings your real-time data to life, allowing you to connect to virtually any type of streaming data, process and analyze that data, and send updates and alerts when specified conditions occur—all in real time.
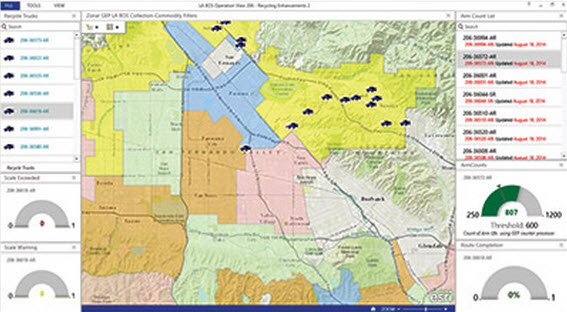
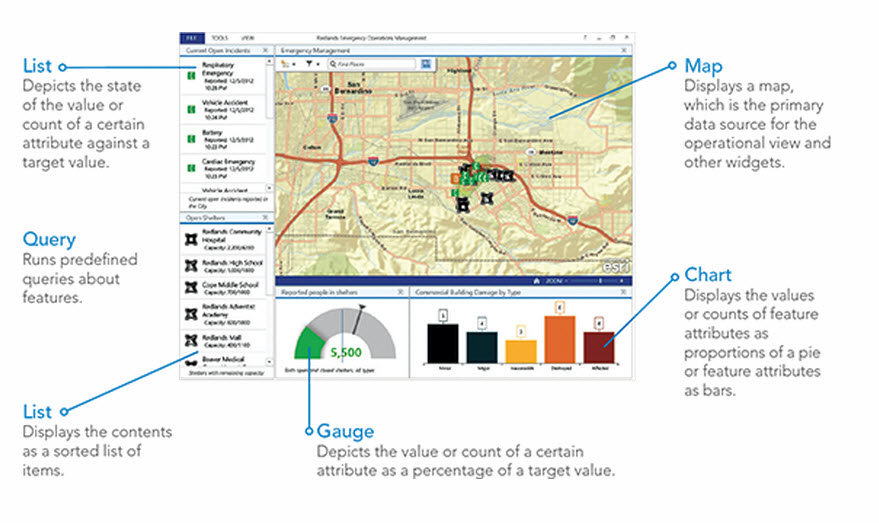
With Operations Dashboard you can create real-time dashboards that allow you to visualize and display key information about your operations. Operational views can be stored in your ArcGIS organizational account and shared with members of your organization, with groups within your organization, as well as publicly with anyone who has an ArcGIS organizational account.
The Quickstart in chapter 9 outlines principles and applications to consider to get your real-time dashboards up and running quickly. In this chapter’s Learn ArcGIS lesson, you will assume the role of a GIS coordinator at an emergency response agency in the city of Redlands, California. You will explore an existing real-time dashboard and also create an instance of the dashboard. You will build skills in the following areas:
- Create a web map
- Create a real-time dashboard
- Work with real-time data
- Customize an operations view
Article Discussion: