The Geostatistical Analyst (GA for short) uses sample points taken at
different locations in a landscape and creates (interpolates) a continuous surface.
The sample points are measurements of some phenomenon, such as radiation leaking
from a nuclear power plant, an oil spill, or elevation heights. Geostatistical
Analyst derives a surface using the values from the measured locations to predict
values for each location in the landscape.
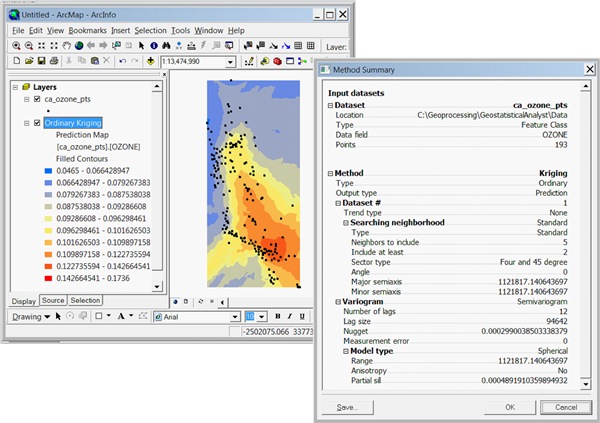
The results of an analysis using GA are saved to a geostatistical layer
(GA layer for short), illustrated below. A GA layer is like any ArcMap layer;
you add, remove, rename, and alter its symbology in countless ways.
GA layers store the source data (typically point features) and the
parameters used to interpolate values, but do not store the full result of the
interpolation. When a GA layer is drawn in ArcMap, a coarse grid is
placed over the whole extent of the layer and values are interpolated on-the-fly for each cell in the grid.
These interpolated values are used to create the filled isolines displayed by
the layer. These isolines are only produced for 10 classes that fall between
the min and max values of the source data. The resolution of the grid is optimized so as to speed up the drawing of the
layer; using a finer grid would cripple drawing speed. (Note: when deemed
necessary, the drawing algorithm uses a finer resolution grid to interpolate
values in complex areas.)
The fact that a GA layer interpolates values on-the-fly is sometimes a
source of confusion. For example, when a GA layer is exported to a grid using
the GA Layer to Grid tool, interpolation is performed for each cell of the output grid. If your output
grid has 1000 rows and 1000 columns, one million calculations are performed.
(In contrast, the grid used to draw a GA layer may be 100 rows and 100 columns).
Fine resolution output grids may require several billion calculations.
Obviously, the performance of the GA Layer to Grid tool depends on the
resolution of the output grid.
There is another effect of exporting the layer to a grid — the output cell values, and therefore the min and max values of the output grid, can be affected by the grid’s cell size.
The min and max values
of the grid are almost always different from the min and max values of the input
data. For example, the illustration below shows a GA layer with its min and max
values and the exported grid with its min and max values. Note both the visual
and statistical difference between the min and max values of the two displays.

Exact interpolators, such as Inverse Distance Weighting, can produce an output
grid that has a max value that is less than the input data’s max value,
as illustrated above. This happens when the input point containing the max
value does not fall in the exact center of an output grid cell. In such cases,
the max value is weighted according to the distance from the cell center as well
as nearby points.
Suggested readings
Understanding Geostatistical Analysis
Article Discussion: