By Charlie Frye, Esri Chief Cartographer
“If I want to create a digital elevation model (DEM) by interpolating from a point shapefile (digital terrain model or DTM), how can I select the most correct cell size given the original separation of the point file?” We recently received this question via the Ask a Cartographer Web page, so we checked with a couple of the product engineers on our Spatial Analyst development team and found that we didn’t have a help topic addressing the subject. Moreover, the answer was not simple—it varied depending upon why the DEM was needed.
The consensus was that the cell size should be suited to what the data will be used for. However, another dimension of the Ask a Cartographer question was directed toward the distribution of the points that would be used to produce the DEM. So, we determined that before producing the DEM based solely on the use requirements some checking needed to be done to ensure the input points were suitable for producing the desired output. We also thought the approaches we would use in addressing this problem could be applied more broadly than just producing DEMs. This discussion can be extended to any continuous raster data – that is, raster data that vary smoothly across the landscape, like rainfall or elevation or statistical surfaces, like hot spot or density surface. It does not pertain to discrete raster data like land cover.
Using the map scale of the final product to guide cell size
There are many uses for interpolated raster surfaces; however, We’re going to keep this discussion to maps and give a few of scenarios for map products that can be generated using DEMs hoping this provides some guidance for how to think about the solution required for other map products not described here.
- Paper map at 1:25,000 scale, printed at 300 DPI (dots per inch). We’ve found that 10 meter DEMs barely work for these types of maps (larger map scales should definitely not use 10 meter DEMs). Although, if the main purpose of the map is to show terrain, We would recommend finding a DEM with a smaller cell size, perhaps 3 or 5 meters.
- On-screen map at 1:12,000 scale, displayed at 96 PPI (pixels per inch). The same 10 meter DEM can be used to a scale of 1:12,000. A smaller cell size would be better if the terrain is integral to the purpose of the map.
- On-screen map at 1:5,000, displayed at 96 PPI. This requires that the cell size be no more than 3 meters.
Bilinear Interpolation Resampling Method
All of the methods above require that the raster layer’s display resampling be set to use Bilinear Interpolation (access this through the raster layer properties on the Display tab). When displaying continuous raster data on-screen or on paper, use the Bilinear Interpolation resampling method – this smoothes out the pixellated appearance of the data but only for display purposes – it does not change the data. This is a great way to get your data to look smooth but it should not be used to mask inappropriate data resolution.
You can alternate the display between Bilinear Interpolation and Nearest Neighbor resampling to easily see the pixilation. This is what we did for In scenarios #2 and #3 above.
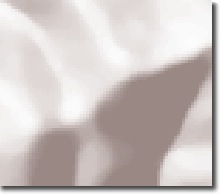
This raster hillshade has an appropriate resolution (cell size is 3 meters for a map scale of 1:4,000) but it appears pixilated because it is shown using the Nearest Neighbor resampling method.

This raster hillshade has an appropriate resolution (cell size is 3 meters for a map scale of 1:4,000) but it appears pixilated because it is shown using the Nearest Neighbor resampling method.
It is inappropriate to use the resampling method to mask inadequate resolution of your raster data.
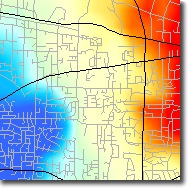
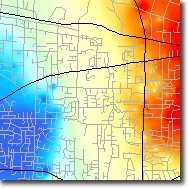 This map shows an appropriate level of detail for the raster data based on visual comparison with the base data used to show geographic reference (in this case two classes of roads). That the resolution of the raster data (hot spots) matches the resolution of the base data (roads) is obvious because identifiable cold or other spots can be seen along identifiable roads. |
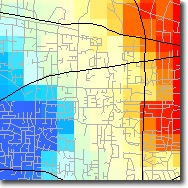 This raster, shown with the Nearest Neighbor resampling method, has a cell size that is too large in comparison to the base data. The mismatch in resolution is obvious because there is no ability of make obvious connections between the roads and the raster cells – the level of detail in the base data is much greater than the level of detail in the raster data. |
 This is the same raster as in the previous figure – it has a cell size that is too large. But because it is shown with Bilinear interpolation, the raster data might appear to be at the same resolution as the base geographic data. This is an inappropriate use of the resampling method to mask the coarse resolution of the raster data. |
Checking for an appropriate cell size
It is important to verify that the point distribution of the input data is adequate for the output raster resolution that you want to use. This relates back to the requirements for your product – it could be for display purposes only, this but also holds for analysis.
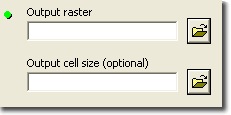
In order to check the cell size, we suggest producing a DEM at the cell size you anticipate needing, then evaluating the appropriateness of this raster by checking to see whether there are enough nonzero values. To do this, you can use the Point to Raster tool (available with ArcInfo license or with ArcView or ArcEditor licenses when either the Spatial Analyst or 3D Analyst are available).
To do this, first set the resolution (cell size) of the output raster to what you think is adequate for your purposes, then use the Point to Raster tool to check the output to see how many pixels have “no data” values.
- If there are too many it is too sparse, decrease the resolution by making the cell size larger or use an interpolation method that finds trends between data points.
- If there are too many, increase the resolution by decreasing the cell size.
Note that there are eight methods you can use in the Point to Raster tool – two of them are useful for determining cell size:
- COUNT tells you how many points that have data values fall within a cell – when the count is too low, your input points are too sparse.
- STANDARD DEVIATIONS tells you the standard deviation of the attributes of all the points within the cell – when the standard deviation is high, you have a cell size that is too large because the number of points in a cell is too dense.
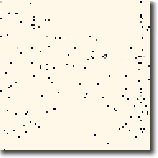
 Sparse points with COUNT values ranging from 0 to 3 indicating that the input point distribution is too sparse for this resolution (cell size). |
 By increasing the cell size, there are now more points within each cell – the COUNT values now range from 0 to 15; this indicates that there is more coalescence of points within cells is better for interpolation. |
 With an even greater cell size, there are even more points within each cell; COUNT values range from 0 to 60. This indicates that a smaller cell size could be used but this could be checked using the STANDARD DEVIATION option to see if there are high standard deviations which would indicate that a smaller resolution SHOULD be used. |
Choosing an Interpolation Method
Regardless of the cell size you ultimately choose, care should be taken in deciding which method you use to interpolate the raster surface. All of these tools can be used to create a DEM from point input data.
- The Point to Raster tool does not interpolate the values of cells between the points.
- The Spatial Analyst and 3D Analyst extensions both have a suite of raster interpolation tools. If you are unfamiliar with how these tools work, read about them before choosing to use any of them.
- We recommend using the Natural Neighbor tool for creating terrains, provided the points are not spaced too far apart, because this method will not infer trends.
- If the point data are quite sparse and a small cell size is needed to create an aesthetic display, then you might try the Spline tool, finds non-linear trends in the data.
- The Kriging tool is a good option if you are familiar with kriging algorithms and their implications for creating surfaces.
If you have other methods and would like to share the reasons for using them, please add them to the comments. Thank you.

Article Discussion: