By Aileen Buckley, Mapping Center Lead
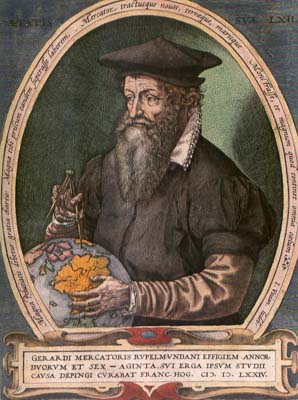
March 5, 2012 marked what would be the 500th birthday of Gerhardus Mercator (1512—1594). Mercator was a Flemish map maker and geographer. In 1569, he created the Mercator projection, which is widely used for navigation because straight lines drawn on maps that use this cylindrical projection are lines of constant compass bearing (rhumb lines); a variation of his projection is used today for many web maps. Mercator mastered the essentials of mathematics, geography, and astronomy and primarily supported himself through his craftsmanship of mathematical instruments. With Gemma Frisius, another producer of globes and mathematical instruments, and Gaspar à Myrica, an engraver and goldsmith, he made Louvain, Belgium, an important center for the construction of globes, maps, and astronomical instruments.
Mercator began making maps independently in 1537. He encouraged Abraham Ortelius to compile the first modern world atlas, Theatrum Orbis Terrarum (1570). Mercator’s first atlas, published in 1578, contained corrected versions of maps originally drawn by Ptolemy. The atlas he published in 1585 included maps of France, Germany and the Netherlands, and in 1588 he published an atlas showing the Balkans and Greece. After his death, Mercator’s son Rumold added additional maps in a final part published in 1595.
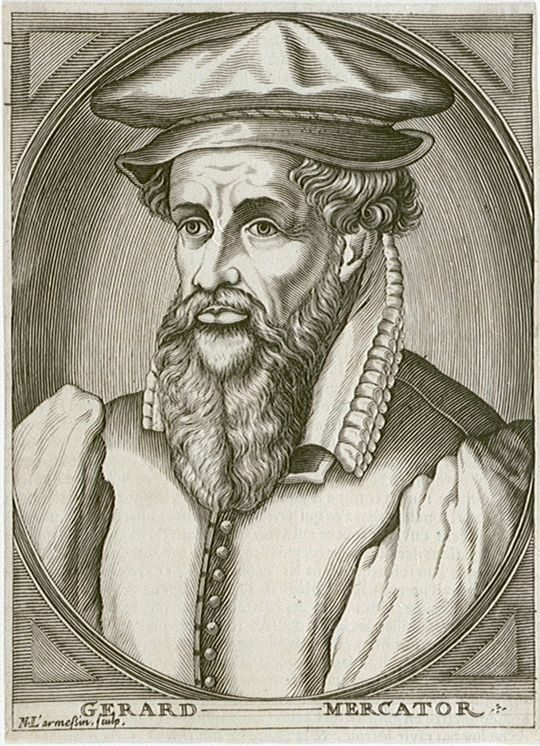
Figure 1. This portrait engraving of Mercator was published in 1739 in the first volume of Joannis Francisci Foppens’ Bibliotheca Belgica.
About the Mercator projection
The following is excerpted from Map Use: Reading, Analysis, Interpretation, Map Use: Reading, Analysis, Interpretation, Seventh Edition, chapter three, “Map Projections” (pages 51—52), with some modifications:
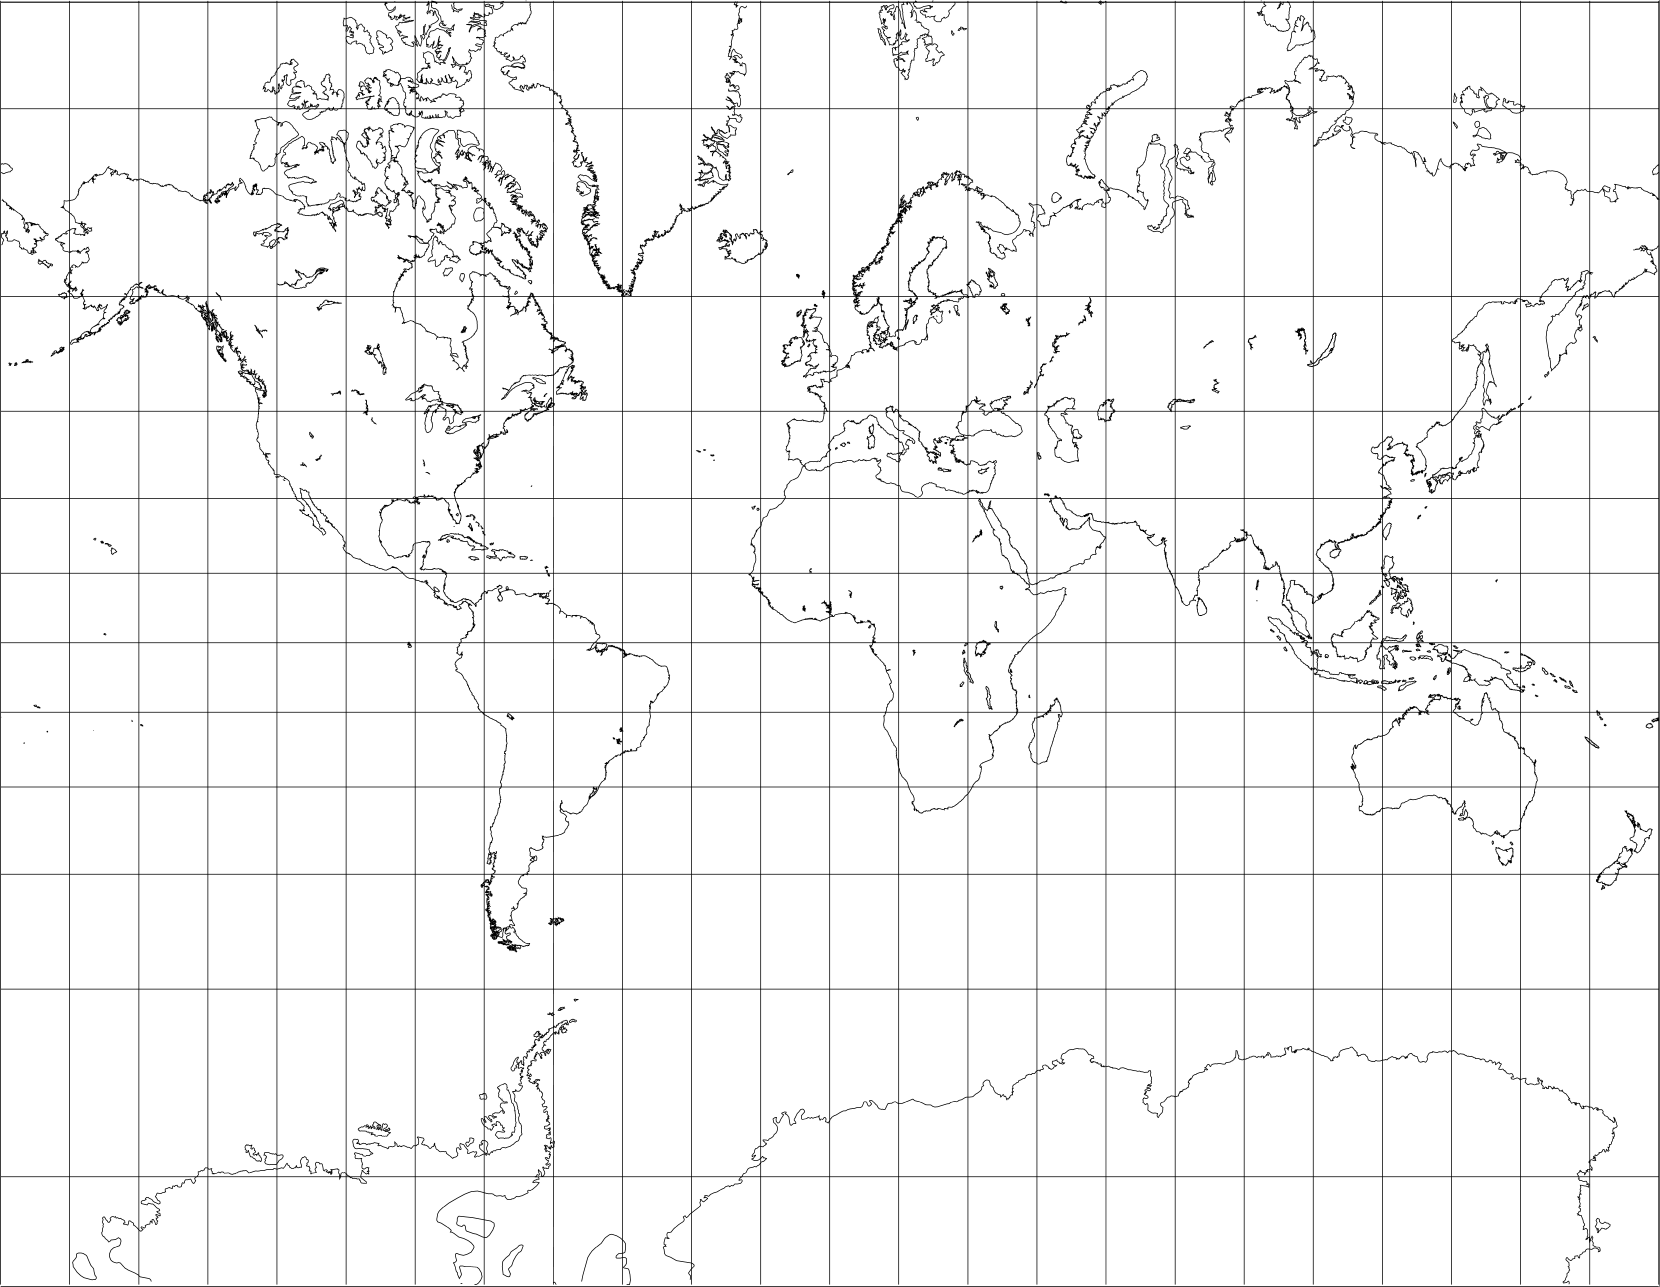
Constructed by Gerhardus Mercator in 1569, the Mercator projection is a tangent case cylindrical conformal projection. As with all conformal projections, shape is preserved in small areas. This projection offers a classic example of how a single projection can be used both poorly and well. Looking at the projection (figure 2), we can imagine Mercator started the construction of his projection with a horizontal line to represent the equator and then added equally spaced vertical lines to represent the meridians.
Figure 2. The Mercator projection
Mercator knew that meridians on the globe converge toward the poles, so that meridians that he had drawn as parallel vertical lines must become progressively more widely spaced toward the poles than they would be on the generating globe. He progressively increased the spacing of parallels away from the equator so that the increase matched the increased spacing between the meridians. As a result of this extreme distortion toward the poles, he cut his projection off at 80°N and S. This not only produced a conformal map projection, but also the only projection on which all lines of constant compass direction, called rhumb lines, are straight lines on the map.
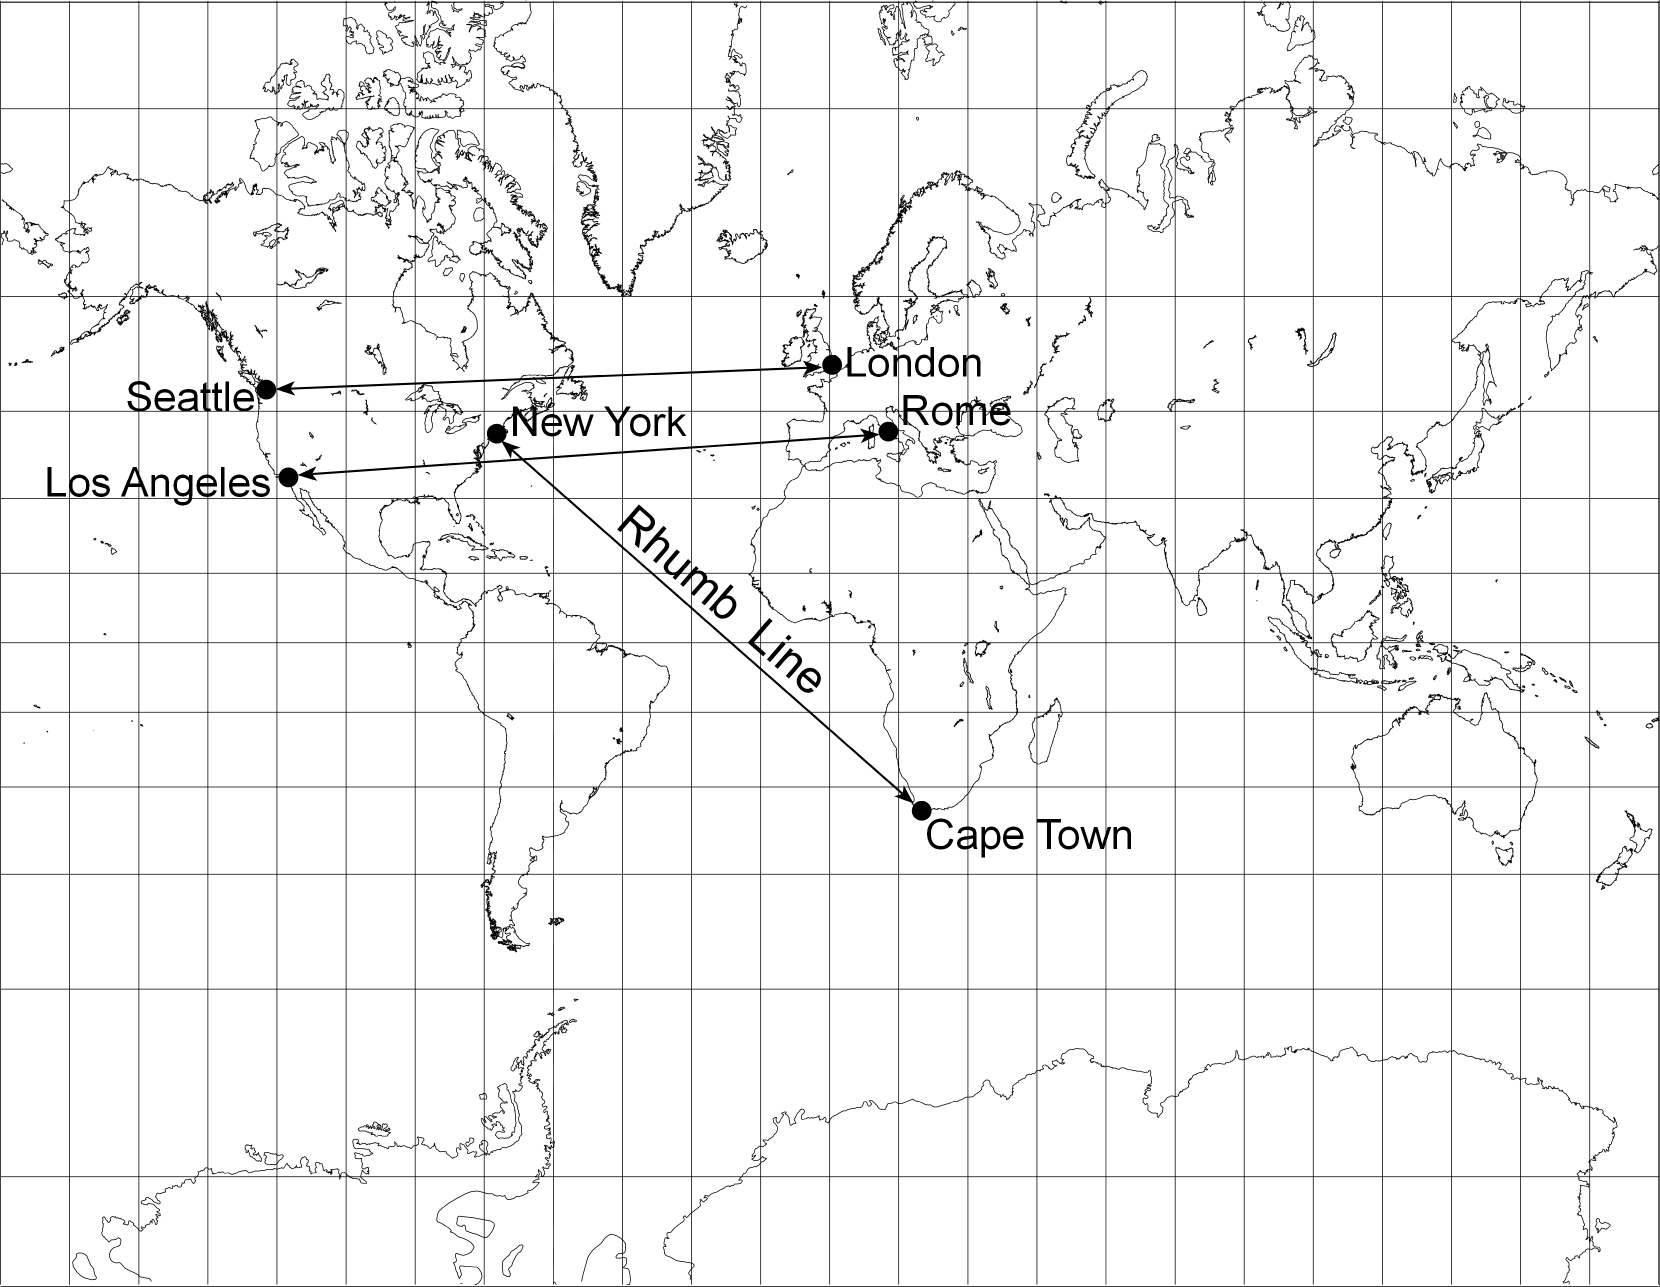
Figure 3. The Mercator projection shown with rhumb lines between selected major world cities
Navigators who used a magnetic compass immediately saw the advantage of plotting courses on the Mercator projection, since any straight line they drew would be a line of constant bearing. This meant they could plot a course on the map and simply maintain the associated bearing during passage to arrive at the plotted location. You can imagine how navigators would prefer a map on which compass bearings would appear as straight rhumb lines. The Mercator projection has been used ever since for nautical charts, such as small-scale piloting charts of the oceans. The large-scale nautical charts used for coastal navigation can be thought of as small rectangles cut out of a world map that uses the Mercator projection.
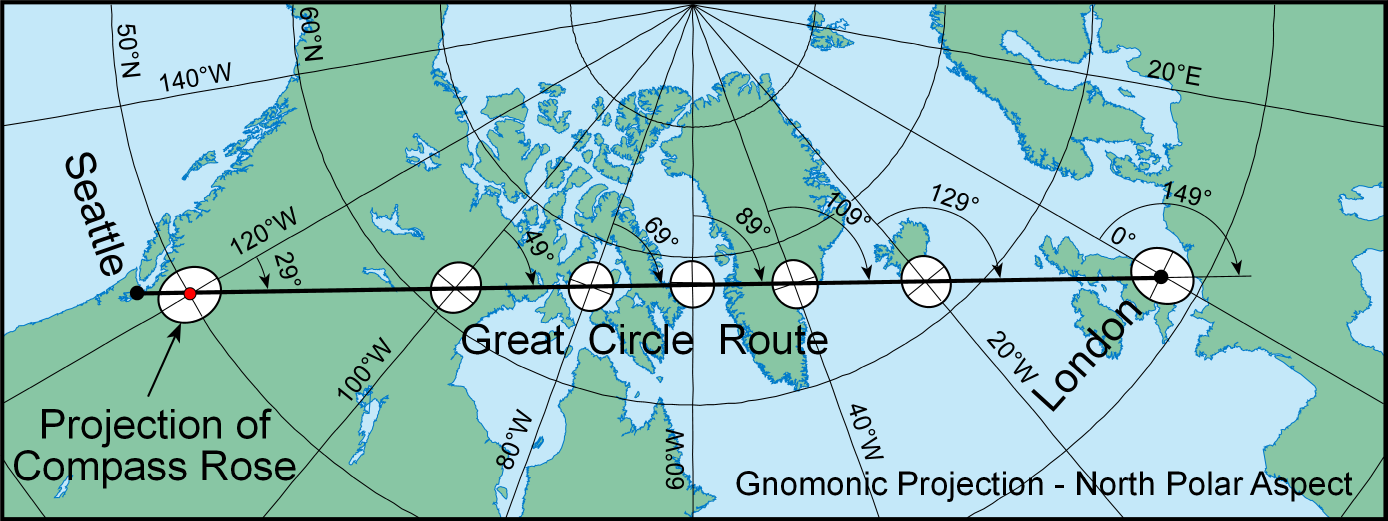
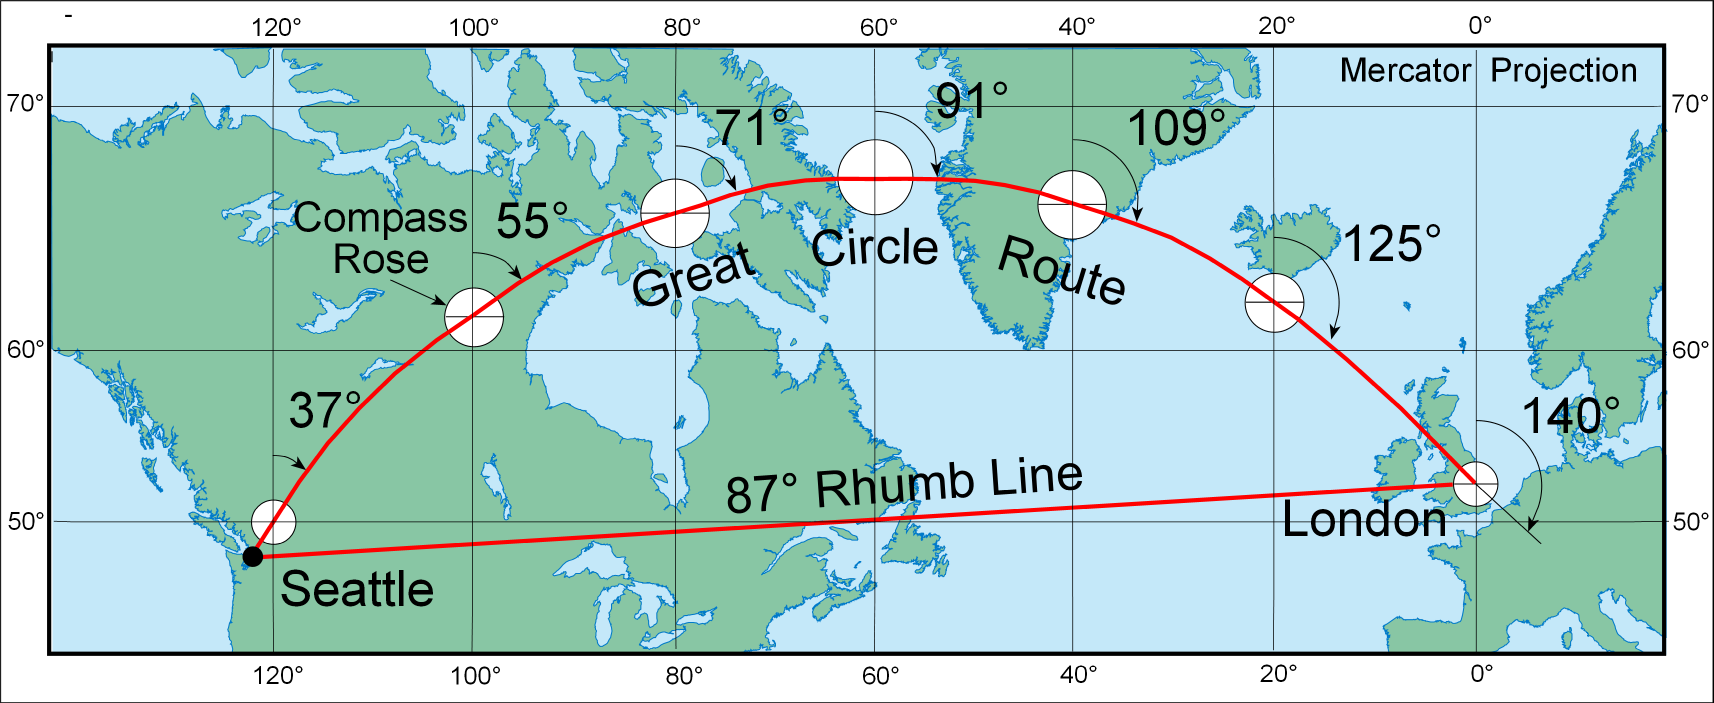
Of course, using these maps for navigation is not really as simple as this. The gnomonic projection is the only projection on which all great circles on the generating globe are shown as straight lines on the flat map (figure 4). Lines drawn on a Mercator projection show constant compass bearing (figure 5), but they are not the same as the great circle route, which is the shortest distance between two points on a globe. Therefore, the Mercator projection is often used in conjunction with the gnomonic projection to plot navigational routes. The gnomonic projection is used first to determine the great circle route between two points, and then the route is projected to transform the great circle to a curve on a Mercator projection. Finally, the curve is translated into a series of shorter straight line segments representing portions of the route, each with constant compass direction (see figures 4 and 5).
Figure 4. The great circle route from Seattle to London is a straight line on the gnomonic map projection. Circular “compass roses” at points where the route crosses major meridians are projected as ellipses, showing the distortion of directions that makes it possible to measure true azimuths only roughly along the route.
Figure 5. Portion of a world map made with the Mercator projection showing the rhumb line and great circle route from Seattle to London. The great circle route, obtained from a gnomonic projection, has been divided into 500 nautical mile legs. Since the Mercator projection is conformal, each simplified compass rose is correctly projected as a circle.
The use of the Mercator projection in navigation is an example of a projection used for its best purpose. A poor use of the Mercator projection is for wall maps of the world. We saw earlier that this projection cannot cover the entire earth, and is often cut off at 80°N and S. Cutting off part of the world does create a rectangular projection surface with a height-to-width ratio that fits walls very well. The problem, of course, is the extreme scale enlargement and consequent area distortion at higher latitudes. The area exaggeration of North America, Europe, and Russia gives many people an erroneous impression of the size of the land masses.
The Mercator projection has also been used as the basis for other projections, such as the transverse Mercator and web Mercator projections.
About the transverse Mercator projection
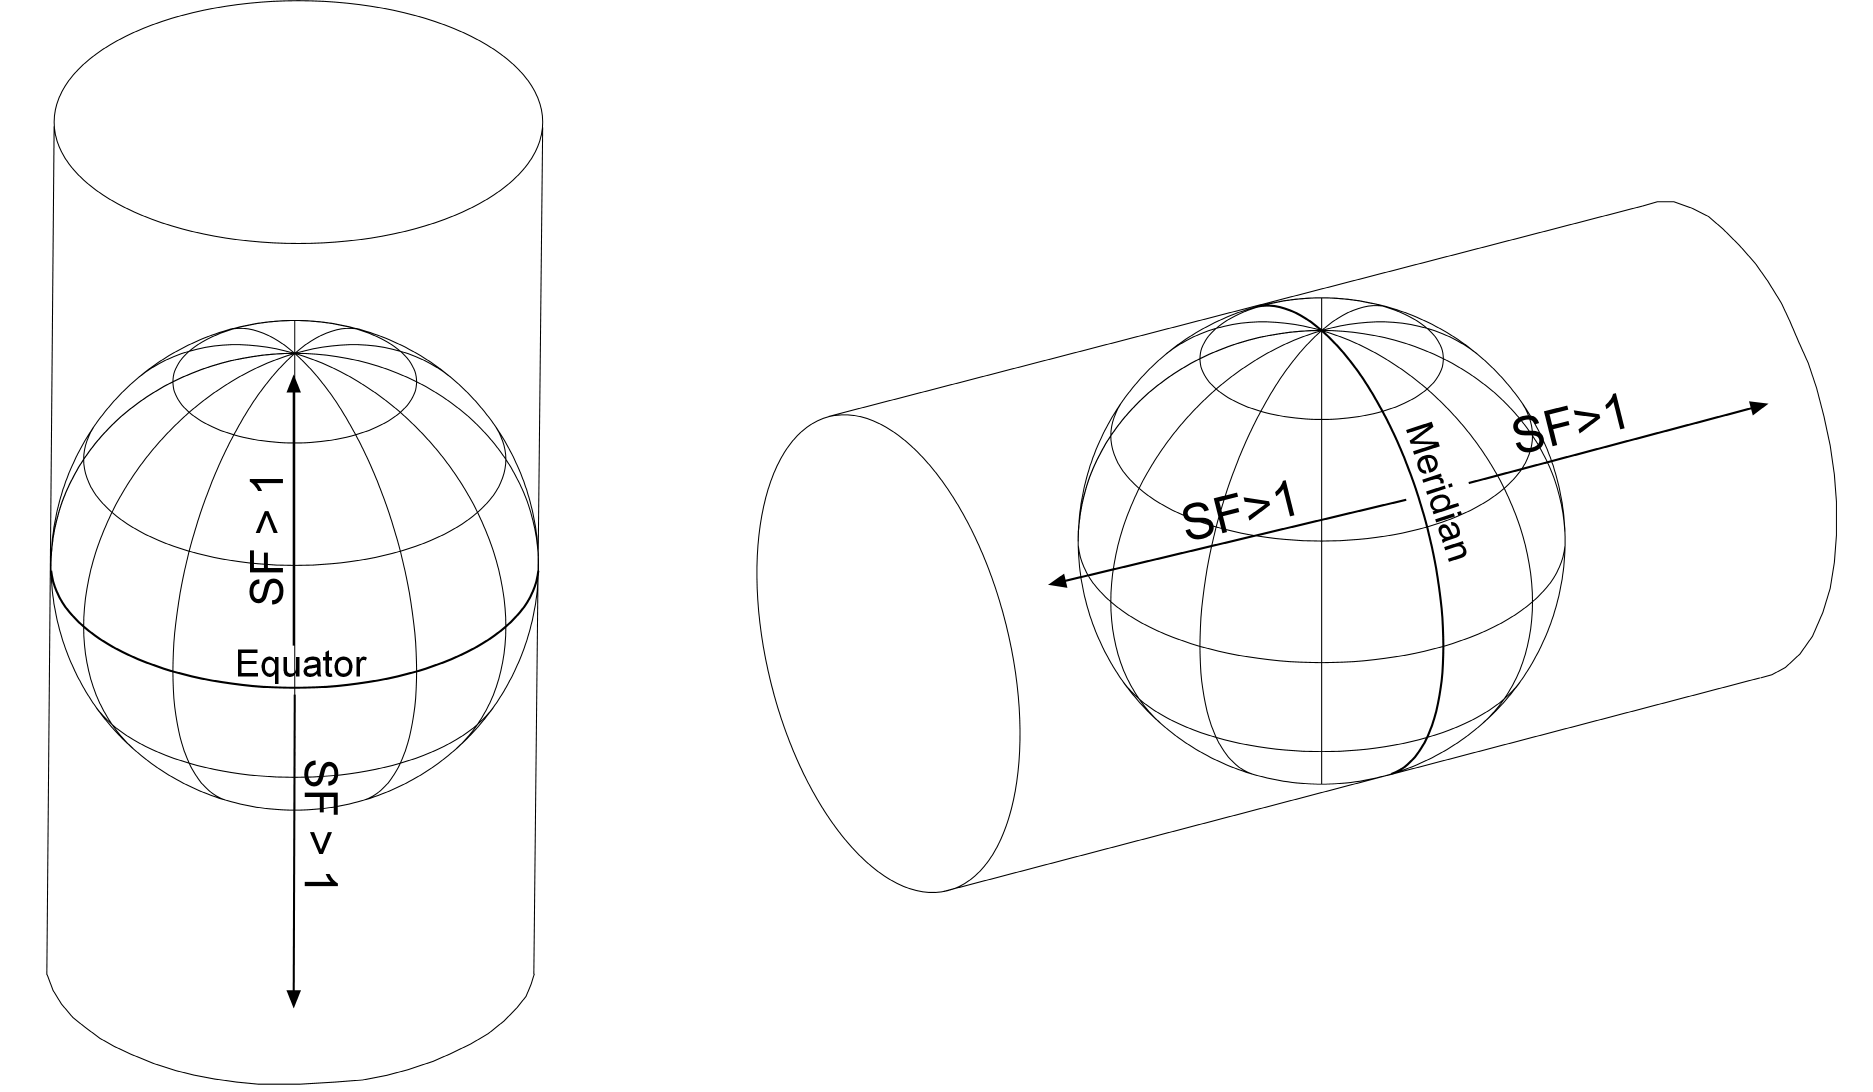
It was actually the mathematician and cartographer Johann Heinrich Lambert who constructed the transverse Mercator projection in 1772. In Europe this projection is called the Gauss-Krüger, in honor of the mathematicians Carl Gauss and Johann Krüger who later worked out formulas describing its geometric distortion and equations for making it on the ellipsoid. Lambert’s idea for the transverse Mercator projection was to rotate the Mercator projection by 90 degrees so that the line of tangency became a pair of meridians?that is, any selected meridian and its antipodal meridian (figure 6).
Figure 6. Normal and transverse aspects of the cylindrical Mercator projection.
The resulting projection is conformal, as is the Mercator projection, but rhumb lines no longer are straight lines. Along the central meridian of the projection (the vertical meridian that defines the y-axis of the projection), there is no distortion and the scale increases perpendicularly away from the central meridian. Thus, narrow north–south strips of the earth are projected with no local shape distortion and little distortion of area.
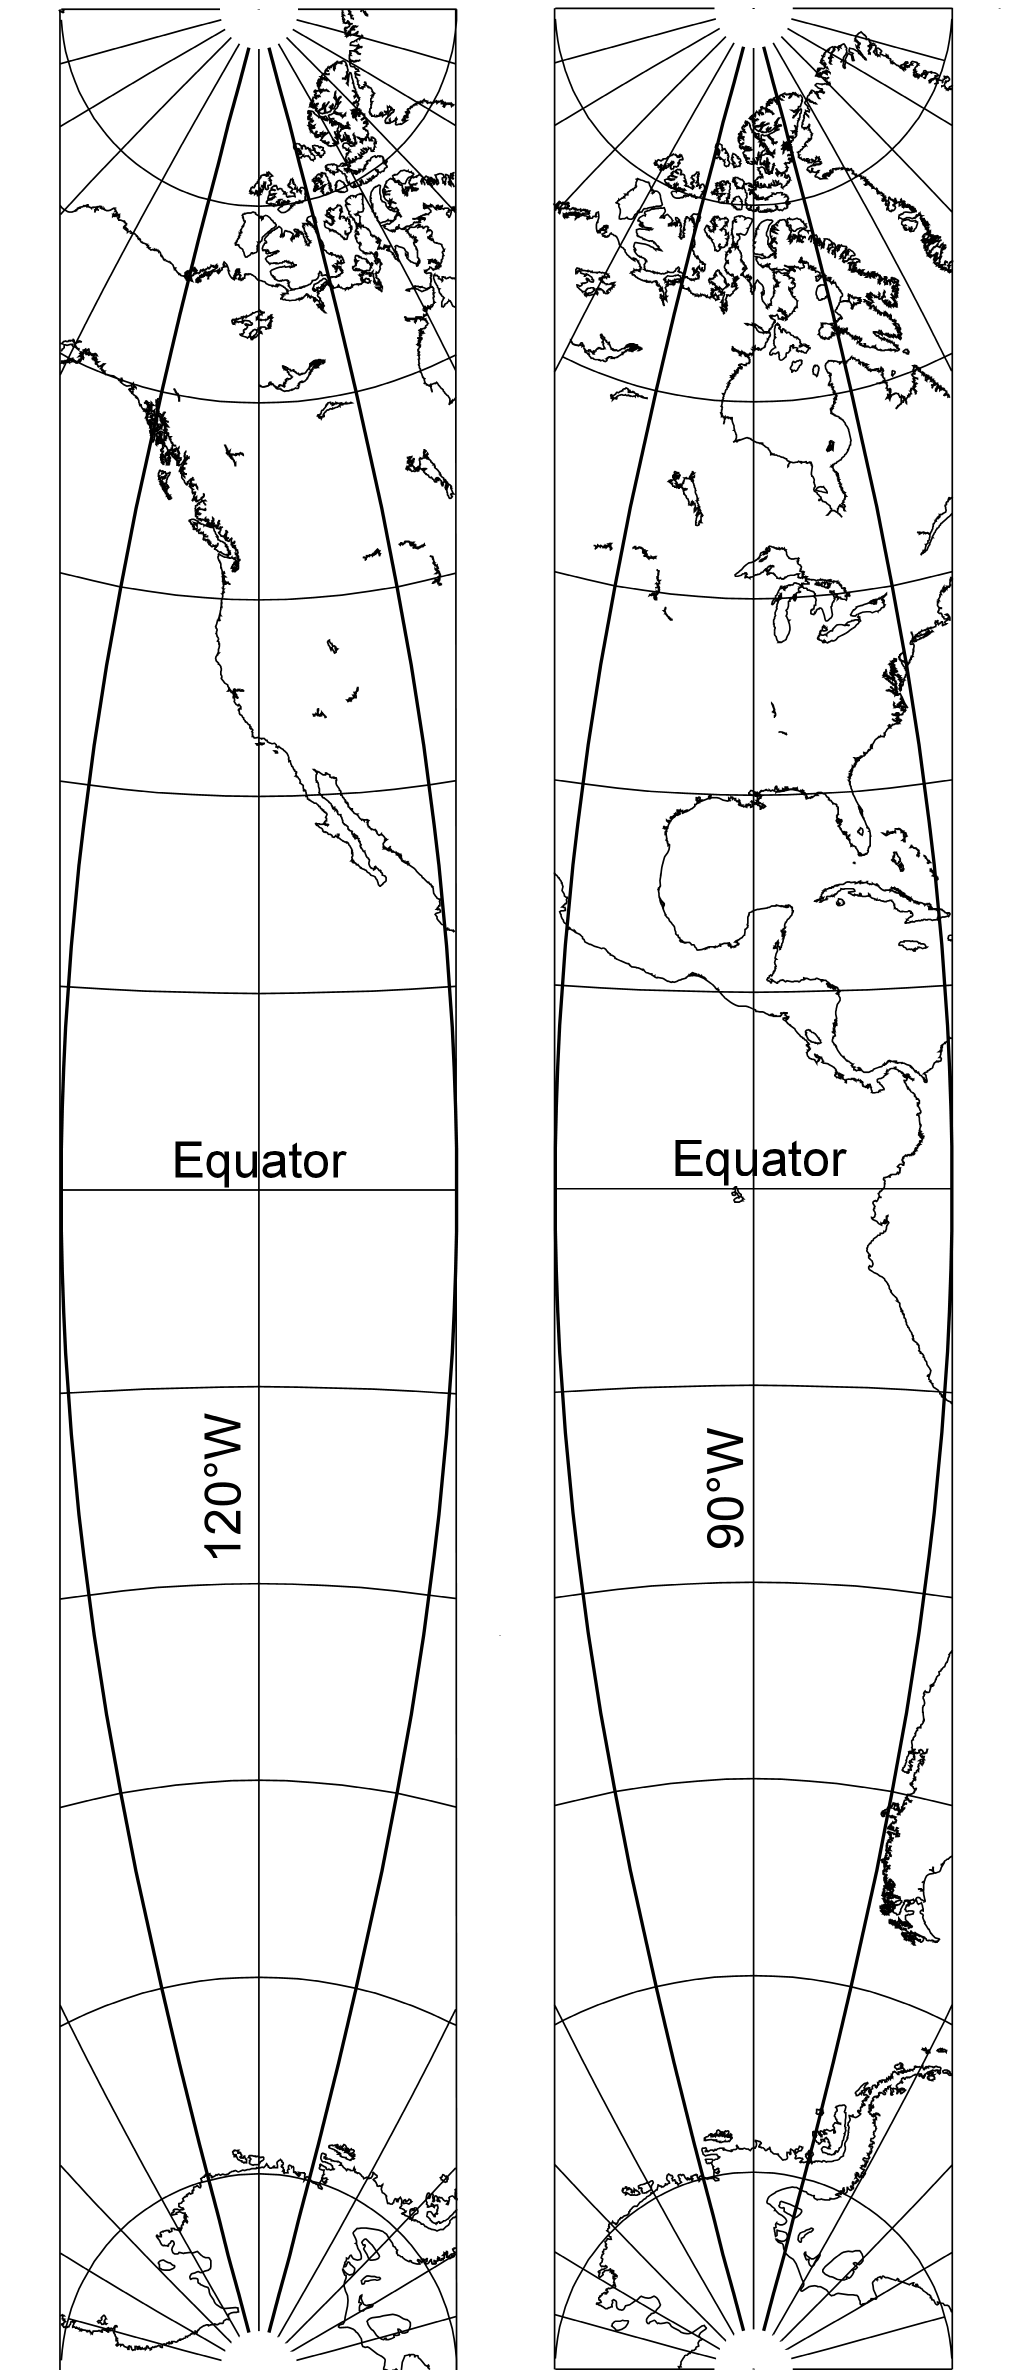
You’re likely to see the transverse Mercator projection used to map north–south strips of the earth called gores (figure 7) which are used in the construction of globes. Because printing the earth’s surface directly onto a round surface is very difficult, instead, a map of the earth is printed in flat elongated sections and then attached to a spherical object.
Figure 7. Gores of the globe on transverse Mercator projections 30 degrees wide at the equator centered at 90°W and 120°W. To make a world globe, the highlighted portion of each map would be cut out and pasted onto the globe and other gores would be used to cover the remaining area.
The narrow, six-degree-wide zones of the universal transverse Mercator grid system are based on the transverse Mercator projection. North–south trending zones of the US State Plane Coordinate system are also based on secant cases of the projection. Most 1:24,000-scale US Geological Survey (USGS) topographic maps were projected on these State Plane Coordinate system zones.
About the web Mercator projection
The web Mercator projection is one of the most popular coordinate systems used in web applications because it fits the entire globe into a square area that can be covered by 256 by 256 pixel tiles. Despite its obvious distortion at small scales, the projection works well for interactive world maps that can be zoomed seamlessly to large-scale maps. At larger map scales (i.e., 1:250,000 and larger), there is relatively little distortion due to the projection’s near-conformality. Understanding the limitations of the Web Mercator projection and how to guard against processing data in web Mercator is essential to correctly using and assessing results obtained from maps that use this projection.
Follow this link to a web application that demonstrates how web Mercator affects distance and area computations.
Conclusion
Cartographers, pilots, navigators, map readers, and web mappers around the world are indebted to Mercator for his many contributions to cartography, not the least of which was his Mercator projection. Happy birthday, Gerhardus, and thank you!
Further reading
Esri, Web Mercator: The Standard for Sharing Data on the Web.
Kimerling, A. Jon, Aileen R. Buckley, Phillip C. Muehrcke, and Juliana O. Muehrcke. 2011. Map Use: Reading, Analysis, Interpretation, Seventh Edition. Redlands, CA: Esri Press, 581 pages.
ArcGIS Online Help: Coordinate system considerations for geoprocessing services

Commenting is not enabled for this article.