Demographic data about populations includes the basics, such as age and ethnicity, but also more sophisticated attributes such as people’s wealth and health, their spending habits, and their politics. ArcGIS includes many hundreds of demographic variables (globally) that are accessible as maps, reports, and raw data that you can use to enrich your own maps.
 The amount of total demographic data available in ArcGIS Online is the epitome of “big data.” The challenge for modern GIS developers and data scientists is to tame big data and deliver summarized, filtered, and interpreted information products. GIS really matters here.
The idea of data enrichment means that you can associate or append demographics to your local geography. This ability to combine your existing data with demographic variables specific to the problem being studied has opened a whole new avenue for everyone, not just consumer marketers, but epidemiologists, political scientists, sociologists, and any professional who wants to better understand a certain segment of the human population.
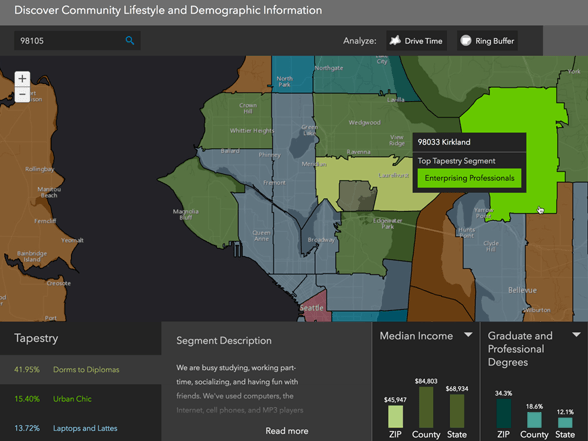
Demographers want to understand populations not only currently, but into the future. How will a given population group change over time? The art of forecasting current-year estimates on the basis of the decennial US Census, for example, is something that is carefully conducted by the demographic experts at Esri. One end product of this work is manifested as Tapestry Segmentation, which comes to life in the app below.
Available US demographic data includes:
Updated Demographics
Accurate current-year estimates and five-year projections for US demographics, including households, income, and housing.
Census and American Community Survey
Census and American Community Survey (ACS) data used to analyze the impact of population changes on services and sites.
Tapestry Segmentation
Detailed descriptions of residential neighborhoods, including demographics, lifestyle data, and economic factors divided into 67 segments.
Consumer Spending
Data about products and services consumers are buying. Includes apparel, food and beverage, entertainment, and household goods and services.
Market Potential
Includes thousands of items that consumers want. The Market Potential Index measures consumer behaviors by area compared with the US average.
Retail Marketplace
Direct comparison between retail sales and consumer spending by industry. Measures the gap between supply and demand.
Business Data
Business Locations and Business Summary data from Dun & Bradstreet. Provides sales, employee information, and industry classification.
Major Shopping Centers
Statistics for thousands of major shopping centers, collected by the Directory of Major Malls. Includes name, total sales, and more.
Crime Indexes
Statistics about major categories of personal and property crime. Includes information about assault, burglary, and more.
Traffic Counts
Peak and low traffic volume of vehicles that cross a certain point or street location. Contains more than one million points.
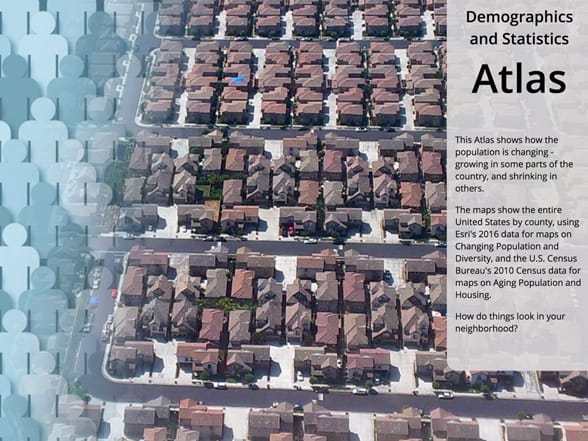 The Demographic and Statistics Atlas shows how population is changing—growing in some parts of the United States, and shrinking in others.
Available global data includes:
Global Demographics
Recent demographics about total population, family size, household income, education, marital status, household type, unemployment, and more.
Global Spending
Total amount spent and amount spent per capita for categories such as food, clothing, household, medical, electronics, and more.
Learn more about demographic data from Esri.
—–
This post is excerpted from The ArcGIS Book, Second Edition: 10 Big Ideas about Applying The Science of Where, by Christian Harder and Clint Brown. The twin goals of this book are to open your eyes to what is now possible with Web GIS, and then spur you into action by putting the technology and deep data resources in your hands. The book is available through Amazon.com and other booksellers, and is also available at TheArcGISBook.com for free.
Commenting is not enabled for this article.